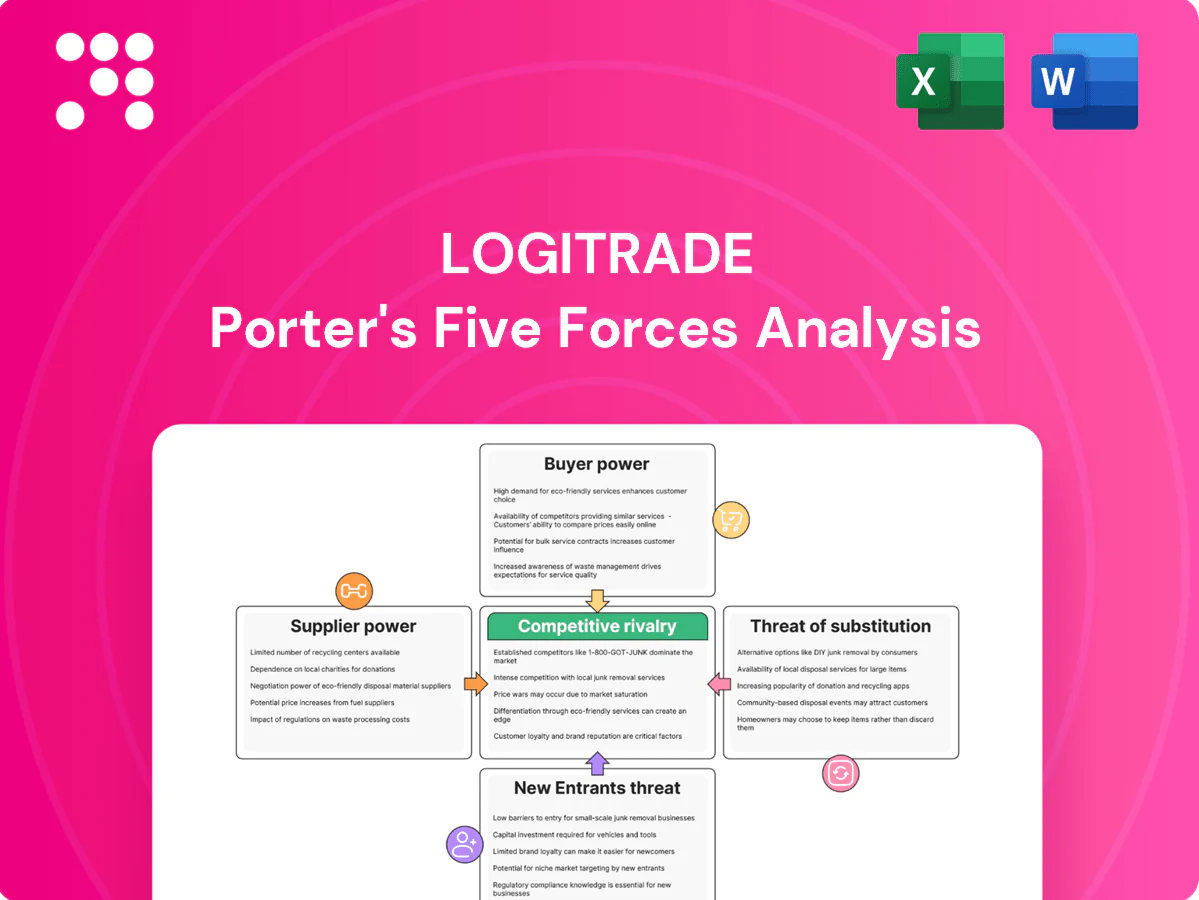
Logitrade Porter's Five Forces Analysis

Don't Miss the Bigger Picture
Logitrade’s Porter's Five Forces snapshot highlights buyer and supplier power, competitive rivalry, threat of entry, and substitutes shaping its market position. This concise view surfaces key risks and strategic levers for management and investors. Unlock the full Porter's Five Forces Analysis to access force-by-force ratings, visuals, and actionable recommendations.
Suppliers Bargaining Power

Cloud vendor dependence
Logitrade relies on hyperscale clouds (AWS ~32%, Azure ~23%, GCP ~11% global market share in 2024), concentrating supplier leverage over pricing and SLAs. Reserved instances and savings plans (discounts up to ~72%) plus egress charges (up to ~$0.09/GB for outbound) materially raise switching costs. Mitigation requires multi-cloud strategies or abstraction layers to reduce vendor lock-in and negotiate better terms.
Data and mapping providers
Location, routing, telematics and pricing datasets are sourced from specialized vendors such as Google, HERE and TomTom; limited high-accuracy providers can command premiums. Enterprise tiers and API quotas constrain scaling — Google Maps Platform offers a $200 monthly credit (about 28,000 map loads) with tiered pricing beyond that. API usage caps and per-call fees can drive costs up for growth-stage logistics platforms. Diversifying sources and building proprietary models reduces dependence.

Carrier network liquidity
Carriers supply capacity and are the platform's critical supply side, with Maersk and MSC together controlling roughly 40% of global container capacity in 2024, giving them negotiating leverage over visibility, fees, and data terms. Large carriers with differentiated lanes can extract premium terms or prefer exclusivity. Widespread multi-homing across platforms increases carrier bargaining power. Well-designed incentives and volume routing can rebalance power by directing load share.

Integration partners and TMS/ERP
Connectivity to SAP, Oracle, Blue Yonder and EDI/VAN partners is essential; certified adapters and partner marketplaces impose fees and certification requirements—2024 market practice shows adapter fees commonly range from $5,000 to $50,000. Dependency on partners can delay deployments by weeks and raise TCO; building reusable connectors can reduce integration time and exposure by ~30%.
- Connectivity: SAP/Oracle/Blue Yonder/EDI
- Costs: $5k–$50k certification/adapter fees (2024)
- Risk: partner delays ↑ deployment time, ↑ costs
- Mitigation: reusable connectors → ~30% faster integration
Regulatory/compliance providers
Sanctions, customs and trade-compliance feeds are concentrated among niche vendors whose accuracy and liability warranties push firms toward higher-priced, premium contracts; contractual SLAs and audit requirements create practical lock-in that raises switching costs. Open-data pipelines and API aggregators emerged in 2024 as viable alternatives, reducing unilateral supplier power and enabling multi-source validation.
- Concentration: niche vendors dominate audited sanctions/customs feeds
- Liability: premium contracts shift risk and pricing upward
- Lock-in: SLAs and audit trails increase switching costs
- Alternatives: 2024 rise of open-data APIs lowers single-vendor dependence
Supplier concentration threatens margins: hyperscalers, carriers, and integrators hold pricing power
Suppliers hold elevated leverage: hyperscalers (AWS ~32%, Azure ~23%, GCP ~11% 2024) drive pricing/egress risk (egress ~$0.09/GB; discounts up to ~72%). Carriers (Maersk+MSC ~40% capacity) and nav/telemetry vendors command premiums. Integration partners charge $5k–$50k; reusable connectors cut integration time ~30%. Open-data APIs in 2024 reduce single-vendor lock-in.
| Supplier | Concentration | Impact | Mitigation |
|---|---|---|---|
| Hyperscalers | AWS32%/Azure23%/GCP11% | Egress $0.09/GB; lock-in | Multi-cloud/abstraction |
| Carriers | Maersk+MSC ~40% | Pricing/data terms | Incentives/routing |
| Integrations | Few cert vendors | $5k–$50k fees | Reusable connectors |
| Compliance feeds | Niche | Premium SLAs | Open-data/APIs |
What is included in the product
 Detailed Word Document
Comprehensive Porter's Five Forces analysis tailored for Logitrade, uncovering competitive rivalry, supplier and buyer power, threat of new entrants and substitutes, and disruptive emerging forces that impact pricing and profitability. Delivered in fully editable Word format for inclusion in investor materials, strategy decks, business plans, or academic projects.

 Customizable Excel Spreadsheet
A one-sheet Logitrade Porter's Five Forces tool that instantly distills competitive pressure into a customizable radar chart and simple scorecards for fast, boardroom-ready decisions. Swap in your data, duplicate scenarios, and integrate with Excel—no macros or finance jargon required.
Customers Bargaining Power

Enterprise shipper concentration
Large enterprise shippers control disproportionate freight spend and volumes; in 2024 they typically secure 10–30% contract discounts and often represent over 40% of a logistics provider’s revenue, amplifying customer bargaining power. They demand custom features and stringent SLAs, and losing one account can materially hit ARR. Tiered pricing and 2–5 year multi-year contracts are common defenses to stabilize terms.
Low switching barriers perception
Competing SaaS tools and the prevalence of ~140 apps per enterprise in 2024 (Blissfully) create a perception that switching is easy, boosting buyer leverage. If data export/import follows open standards, buyers' negotiating power rises. Strong deep integrations and workflow changes create real switching costs, reducing leverage. Clear ROI and adoption services cut churn risk, with enterprise SaaS churn ~15–20% annually in 2024.

Multi-homing across tools
Procurement teams frequently multi-home across modes and regions, with industry surveys in 2024 indicating about 60% of buyers using two or more platforms, fragmenting wallet share and intensifying price pressure. Buyers leverage RFPs to pit vendors against each other, driving down margins. Distinctive analytics and network effects—higher retention where 1st-party data and carrier connectivity are deeper—can reduce churn and curb multi-homing.

Price sensitivity and payback
Transportation is a cost center so Logitrade customers prioritize savings and rapid payback; missed cost-down targets typically trigger renegotiation or scope cuts. Usage-based fees face pushback in peak seasons as spot-rate volatility can rise 20–40% (industry 2023–24 observations). Outcome-based pricing aligns incentives and can lower total landed cost when tied to measurable KPIs.
- Cost focus: savings & payback
- Renegotiation if targets missed
- Peak-season pushback: spot volatility ~20–40%
- Outcome pricing: aligns incentives, reduces TCO
Integration and security demands
Enterprises increasingly demand SSO, SOC 2/ISO certification, data residency controls and immutable audit trails; compliance gaps give buyers clear negotiation leverage. Custom integrations routinely expand project scope and drive discounts of roughly 10–25%, while standardized connectors plus certifications protect margins and can cut implementation time by up to 40%.
- SSO required
- SOC 2 / ISO mandated
- Data residency & audit trails
- Custom integrations → 10–25% discounts
- Standard connectors & certs → defend margins, −40% time
Enterprise shippers >40% revenue amplify leverage amid multi-homing
Enterprise shippers represent >40% revenue, secure 10–30% contract discounts and drive strict SLAs, amplifying bargaining power. Multi-homing (~60% use 2+ platforms) and perceived easy switching (140 apps per enterprise) raise buyer leverage, while deep integrations, 1st-party data and ROI reduce churn (enterprise SaaS churn ~15–20% in 2024). Peak-season spot volatility ~20–40% pressures usage fees; outcome pricing and certifications (SOC2/ISO, SSO) defend margins.
| Metric | Value |
|---|---|
| Enterprise revenue share | >40% |
| Contract discounts | 10–30% |
| Multi-homing | ~60% |
| SaaS churn (2024) | 15–20% |
| Spot volatility | 20–40% |
| Integration discount | 10–25% |
| Implementation time cut | up to 40% |
What You See Is What You Get
Logitrade Porter's Five Forces Analysis
This preview shows the exact Logitrade Porter's Five Forces Analysis you'll receive after purchase—no placeholders, no samples. The full, professionally formatted document is ready for immediate download and use the moment you complete payment. You’re viewing the final deliverable, identical to the file you'll get instantly.

Don't Miss the Bigger Picture
Logitrade’s Porter's Five Forces snapshot highlights buyer and supplier power, competitive rivalry, threat of entry, and substitutes shaping its market position. This concise view surfaces key risks and strategic levers for management and investors. Unlock the full Porter's Five Forces Analysis to access force-by-force ratings, visuals, and actionable recommendations.
Suppliers Bargaining Power
Cloud vendor dependence
Logitrade relies on hyperscale clouds (AWS ~32%, Azure ~23%, GCP ~11% global market share in 2024), concentrating supplier leverage over pricing and SLAs. Reserved instances and savings plans (discounts up to ~72%) plus egress charges (up to ~$0.09/GB for outbound) materially raise switching costs. Mitigation requires multi-cloud strategies or abstraction layers to reduce vendor lock-in and negotiate better terms.
Data and mapping providers
Location, routing, telematics and pricing datasets are sourced from specialized vendors such as Google, HERE and TomTom; limited high-accuracy providers can command premiums. Enterprise tiers and API quotas constrain scaling — Google Maps Platform offers a $200 monthly credit (about 28,000 map loads) with tiered pricing beyond that. API usage caps and per-call fees can drive costs up for growth-stage logistics platforms. Diversifying sources and building proprietary models reduces dependence.
Carrier network liquidity
Carriers supply capacity and are the platform's critical supply side, with Maersk and MSC together controlling roughly 40% of global container capacity in 2024, giving them negotiating leverage over visibility, fees, and data terms. Large carriers with differentiated lanes can extract premium terms or prefer exclusivity. Widespread multi-homing across platforms increases carrier bargaining power. Well-designed incentives and volume routing can rebalance power by directing load share.
Integration partners and TMS/ERP
Connectivity to SAP, Oracle, Blue Yonder and EDI/VAN partners is essential; certified adapters and partner marketplaces impose fees and certification requirements—2024 market practice shows adapter fees commonly range from $5,000 to $50,000. Dependency on partners can delay deployments by weeks and raise TCO; building reusable connectors can reduce integration time and exposure by ~30%.
- Connectivity: SAP/Oracle/Blue Yonder/EDI
- Costs: $5k–$50k certification/adapter fees (2024)
- Risk: partner delays ↑ deployment time, ↑ costs
- Mitigation: reusable connectors → ~30% faster integration
Regulatory/compliance providers
Sanctions, customs and trade-compliance feeds are concentrated among niche vendors whose accuracy and liability warranties push firms toward higher-priced, premium contracts; contractual SLAs and audit requirements create practical lock-in that raises switching costs. Open-data pipelines and API aggregators emerged in 2024 as viable alternatives, reducing unilateral supplier power and enabling multi-source validation.
- Concentration: niche vendors dominate audited sanctions/customs feeds
- Liability: premium contracts shift risk and pricing upward
- Lock-in: SLAs and audit trails increase switching costs
- Alternatives: 2024 rise of open-data APIs lowers single-vendor dependence
Supplier concentration threatens margins: hyperscalers, carriers, and integrators hold pricing power
Suppliers hold elevated leverage: hyperscalers (AWS ~32%, Azure ~23%, GCP ~11% 2024) drive pricing/egress risk (egress ~$0.09/GB; discounts up to ~72%). Carriers (Maersk+MSC ~40% capacity) and nav/telemetry vendors command premiums. Integration partners charge $5k–$50k; reusable connectors cut integration time ~30%. Open-data APIs in 2024 reduce single-vendor lock-in.
| Supplier | Concentration | Impact | Mitigation |
|---|---|---|---|
| Hyperscalers | AWS32%/Azure23%/GCP11% | Egress $0.09/GB; lock-in | Multi-cloud/abstraction |
| Carriers | Maersk+MSC ~40% | Pricing/data terms | Incentives/routing |
| Integrations | Few cert vendors | $5k–$50k fees | Reusable connectors |
| Compliance feeds | Niche | Premium SLAs | Open-data/APIs |
What is included in the product
Detailed Word Document
Comprehensive Porter's Five Forces analysis tailored for Logitrade, uncovering competitive rivalry, supplier and buyer power, threat of new entrants and substitutes, and disruptive emerging forces that impact pricing and profitability. Delivered in fully editable Word format for inclusion in investor materials, strategy decks, business plans, or academic projects.
Customizable Excel Spreadsheet
A one-sheet Logitrade Porter's Five Forces tool that instantly distills competitive pressure into a customizable radar chart and simple scorecards for fast, boardroom-ready decisions. Swap in your data, duplicate scenarios, and integrate with Excel—no macros or finance jargon required.
Customers Bargaining Power
Enterprise shipper concentration
Large enterprise shippers control disproportionate freight spend and volumes; in 2024 they typically secure 10–30% contract discounts and often represent over 40% of a logistics provider’s revenue, amplifying customer bargaining power. They demand custom features and stringent SLAs, and losing one account can materially hit ARR. Tiered pricing and 2–5 year multi-year contracts are common defenses to stabilize terms.
Low switching barriers perception
Competing SaaS tools and the prevalence of ~140 apps per enterprise in 2024 (Blissfully) create a perception that switching is easy, boosting buyer leverage. If data export/import follows open standards, buyers' negotiating power rises. Strong deep integrations and workflow changes create real switching costs, reducing leverage. Clear ROI and adoption services cut churn risk, with enterprise SaaS churn ~15–20% annually in 2024.
Multi-homing across tools
Procurement teams frequently multi-home across modes and regions, with industry surveys in 2024 indicating about 60% of buyers using two or more platforms, fragmenting wallet share and intensifying price pressure. Buyers leverage RFPs to pit vendors against each other, driving down margins. Distinctive analytics and network effects—higher retention where 1st-party data and carrier connectivity are deeper—can reduce churn and curb multi-homing.
Price sensitivity and payback
Transportation is a cost center so Logitrade customers prioritize savings and rapid payback; missed cost-down targets typically trigger renegotiation or scope cuts. Usage-based fees face pushback in peak seasons as spot-rate volatility can rise 20–40% (industry 2023–24 observations). Outcome-based pricing aligns incentives and can lower total landed cost when tied to measurable KPIs.
- Cost focus: savings & payback
- Renegotiation if targets missed
- Peak-season pushback: spot volatility ~20–40%
- Outcome pricing: aligns incentives, reduces TCO
Integration and security demands
Enterprises increasingly demand SSO, SOC 2/ISO certification, data residency controls and immutable audit trails; compliance gaps give buyers clear negotiation leverage. Custom integrations routinely expand project scope and drive discounts of roughly 10–25%, while standardized connectors plus certifications protect margins and can cut implementation time by up to 40%.
- SSO required
- SOC 2 / ISO mandated
- Data residency & audit trails
- Custom integrations → 10–25% discounts
- Standard connectors & certs → defend margins, −40% time
Enterprise shippers >40% revenue amplify leverage amid multi-homing
Enterprise shippers represent >40% revenue, secure 10–30% contract discounts and drive strict SLAs, amplifying bargaining power. Multi-homing (~60% use 2+ platforms) and perceived easy switching (140 apps per enterprise) raise buyer leverage, while deep integrations, 1st-party data and ROI reduce churn (enterprise SaaS churn ~15–20% in 2024). Peak-season spot volatility ~20–40% pressures usage fees; outcome pricing and certifications (SOC2/ISO, SSO) defend margins.
| Metric | Value |
|---|---|
| Enterprise revenue share | >40% |
| Contract discounts | 10–30% |
| Multi-homing | ~60% |
| SaaS churn (2024) | 15–20% |
| Spot volatility | 20–40% |
| Integration discount | 10–25% |
| Implementation time cut | up to 40% |
What You See Is What You Get
Logitrade Porter's Five Forces Analysis
This preview shows the exact Logitrade Porter's Five Forces Analysis you'll receive after purchase—no placeholders, no samples. The full, professionally formatted document is ready for immediate download and use the moment you complete payment. You’re viewing the final deliverable, identical to the file you'll get instantly.
Original: $10.00
-65%$10.00
$3.50Description
Don't Miss the Bigger Picture
Logitrade’s Porter's Five Forces snapshot highlights buyer and supplier power, competitive rivalry, threat of entry, and substitutes shaping its market position. This concise view surfaces key risks and strategic levers for management and investors. Unlock the full Porter's Five Forces Analysis to access force-by-force ratings, visuals, and actionable recommendations.
Suppliers Bargaining Power
Cloud vendor dependence
Logitrade relies on hyperscale clouds (AWS ~32%, Azure ~23%, GCP ~11% global market share in 2024), concentrating supplier leverage over pricing and SLAs. Reserved instances and savings plans (discounts up to ~72%) plus egress charges (up to ~$0.09/GB for outbound) materially raise switching costs. Mitigation requires multi-cloud strategies or abstraction layers to reduce vendor lock-in and negotiate better terms.
Data and mapping providers
Location, routing, telematics and pricing datasets are sourced from specialized vendors such as Google, HERE and TomTom; limited high-accuracy providers can command premiums. Enterprise tiers and API quotas constrain scaling — Google Maps Platform offers a $200 monthly credit (about 28,000 map loads) with tiered pricing beyond that. API usage caps and per-call fees can drive costs up for growth-stage logistics platforms. Diversifying sources and building proprietary models reduces dependence.
Carrier network liquidity
Carriers supply capacity and are the platform's critical supply side, with Maersk and MSC together controlling roughly 40% of global container capacity in 2024, giving them negotiating leverage over visibility, fees, and data terms. Large carriers with differentiated lanes can extract premium terms or prefer exclusivity. Widespread multi-homing across platforms increases carrier bargaining power. Well-designed incentives and volume routing can rebalance power by directing load share.
Integration partners and TMS/ERP
Connectivity to SAP, Oracle, Blue Yonder and EDI/VAN partners is essential; certified adapters and partner marketplaces impose fees and certification requirements—2024 market practice shows adapter fees commonly range from $5,000 to $50,000. Dependency on partners can delay deployments by weeks and raise TCO; building reusable connectors can reduce integration time and exposure by ~30%.
- Connectivity: SAP/Oracle/Blue Yonder/EDI
- Costs: $5k–$50k certification/adapter fees (2024)
- Risk: partner delays ↑ deployment time, ↑ costs
- Mitigation: reusable connectors → ~30% faster integration
Regulatory/compliance providers
Sanctions, customs and trade-compliance feeds are concentrated among niche vendors whose accuracy and liability warranties push firms toward higher-priced, premium contracts; contractual SLAs and audit requirements create practical lock-in that raises switching costs. Open-data pipelines and API aggregators emerged in 2024 as viable alternatives, reducing unilateral supplier power and enabling multi-source validation.
- Concentration: niche vendors dominate audited sanctions/customs feeds
- Liability: premium contracts shift risk and pricing upward
- Lock-in: SLAs and audit trails increase switching costs
- Alternatives: 2024 rise of open-data APIs lowers single-vendor dependence
Supplier concentration threatens margins: hyperscalers, carriers, and integrators hold pricing power
Suppliers hold elevated leverage: hyperscalers (AWS ~32%, Azure ~23%, GCP ~11% 2024) drive pricing/egress risk (egress ~$0.09/GB; discounts up to ~72%). Carriers (Maersk+MSC ~40% capacity) and nav/telemetry vendors command premiums. Integration partners charge $5k–$50k; reusable connectors cut integration time ~30%. Open-data APIs in 2024 reduce single-vendor lock-in.
| Supplier | Concentration | Impact | Mitigation |
|---|---|---|---|
| Hyperscalers | AWS32%/Azure23%/GCP11% | Egress $0.09/GB; lock-in | Multi-cloud/abstraction |
| Carriers | Maersk+MSC ~40% | Pricing/data terms | Incentives/routing |
| Integrations | Few cert vendors | $5k–$50k fees | Reusable connectors |
| Compliance feeds | Niche | Premium SLAs | Open-data/APIs |
What is included in the product
Detailed Word Document
Comprehensive Porter's Five Forces analysis tailored for Logitrade, uncovering competitive rivalry, supplier and buyer power, threat of new entrants and substitutes, and disruptive emerging forces that impact pricing and profitability. Delivered in fully editable Word format for inclusion in investor materials, strategy decks, business plans, or academic projects.
Customizable Excel Spreadsheet
A one-sheet Logitrade Porter's Five Forces tool that instantly distills competitive pressure into a customizable radar chart and simple scorecards for fast, boardroom-ready decisions. Swap in your data, duplicate scenarios, and integrate with Excel—no macros or finance jargon required.
Customers Bargaining Power
Enterprise shipper concentration
Large enterprise shippers control disproportionate freight spend and volumes; in 2024 they typically secure 10–30% contract discounts and often represent over 40% of a logistics provider’s revenue, amplifying customer bargaining power. They demand custom features and stringent SLAs, and losing one account can materially hit ARR. Tiered pricing and 2–5 year multi-year contracts are common defenses to stabilize terms.
Low switching barriers perception
Competing SaaS tools and the prevalence of ~140 apps per enterprise in 2024 (Blissfully) create a perception that switching is easy, boosting buyer leverage. If data export/import follows open standards, buyers' negotiating power rises. Strong deep integrations and workflow changes create real switching costs, reducing leverage. Clear ROI and adoption services cut churn risk, with enterprise SaaS churn ~15–20% annually in 2024.
Multi-homing across tools
Procurement teams frequently multi-home across modes and regions, with industry surveys in 2024 indicating about 60% of buyers using two or more platforms, fragmenting wallet share and intensifying price pressure. Buyers leverage RFPs to pit vendors against each other, driving down margins. Distinctive analytics and network effects—higher retention where 1st-party data and carrier connectivity are deeper—can reduce churn and curb multi-homing.
Price sensitivity and payback
Transportation is a cost center so Logitrade customers prioritize savings and rapid payback; missed cost-down targets typically trigger renegotiation or scope cuts. Usage-based fees face pushback in peak seasons as spot-rate volatility can rise 20–40% (industry 2023–24 observations). Outcome-based pricing aligns incentives and can lower total landed cost when tied to measurable KPIs.
- Cost focus: savings & payback
- Renegotiation if targets missed
- Peak-season pushback: spot volatility ~20–40%
- Outcome pricing: aligns incentives, reduces TCO
Integration and security demands
Enterprises increasingly demand SSO, SOC 2/ISO certification, data residency controls and immutable audit trails; compliance gaps give buyers clear negotiation leverage. Custom integrations routinely expand project scope and drive discounts of roughly 10–25%, while standardized connectors plus certifications protect margins and can cut implementation time by up to 40%.
- SSO required
- SOC 2 / ISO mandated
- Data residency & audit trails
- Custom integrations → 10–25% discounts
- Standard connectors & certs → defend margins, −40% time
Enterprise shippers >40% revenue amplify leverage amid multi-homing
Enterprise shippers represent >40% revenue, secure 10–30% contract discounts and drive strict SLAs, amplifying bargaining power. Multi-homing (~60% use 2+ platforms) and perceived easy switching (140 apps per enterprise) raise buyer leverage, while deep integrations, 1st-party data and ROI reduce churn (enterprise SaaS churn ~15–20% in 2024). Peak-season spot volatility ~20–40% pressures usage fees; outcome pricing and certifications (SOC2/ISO, SSO) defend margins.
| Metric | Value |
|---|---|
| Enterprise revenue share | >40% |
| Contract discounts | 10–30% |
| Multi-homing | ~60% |
| SaaS churn (2024) | 15–20% |
| Spot volatility | 20–40% |
| Integration discount | 10–25% |
| Implementation time cut | up to 40% |
What You See Is What You Get
Logitrade Porter's Five Forces Analysis
This preview shows the exact Logitrade Porter's Five Forces Analysis you'll receive after purchase—no placeholders, no samples. The full, professionally formatted document is ready for immediate download and use the moment you complete payment. You’re viewing the final deliverable, identical to the file you'll get instantly.











