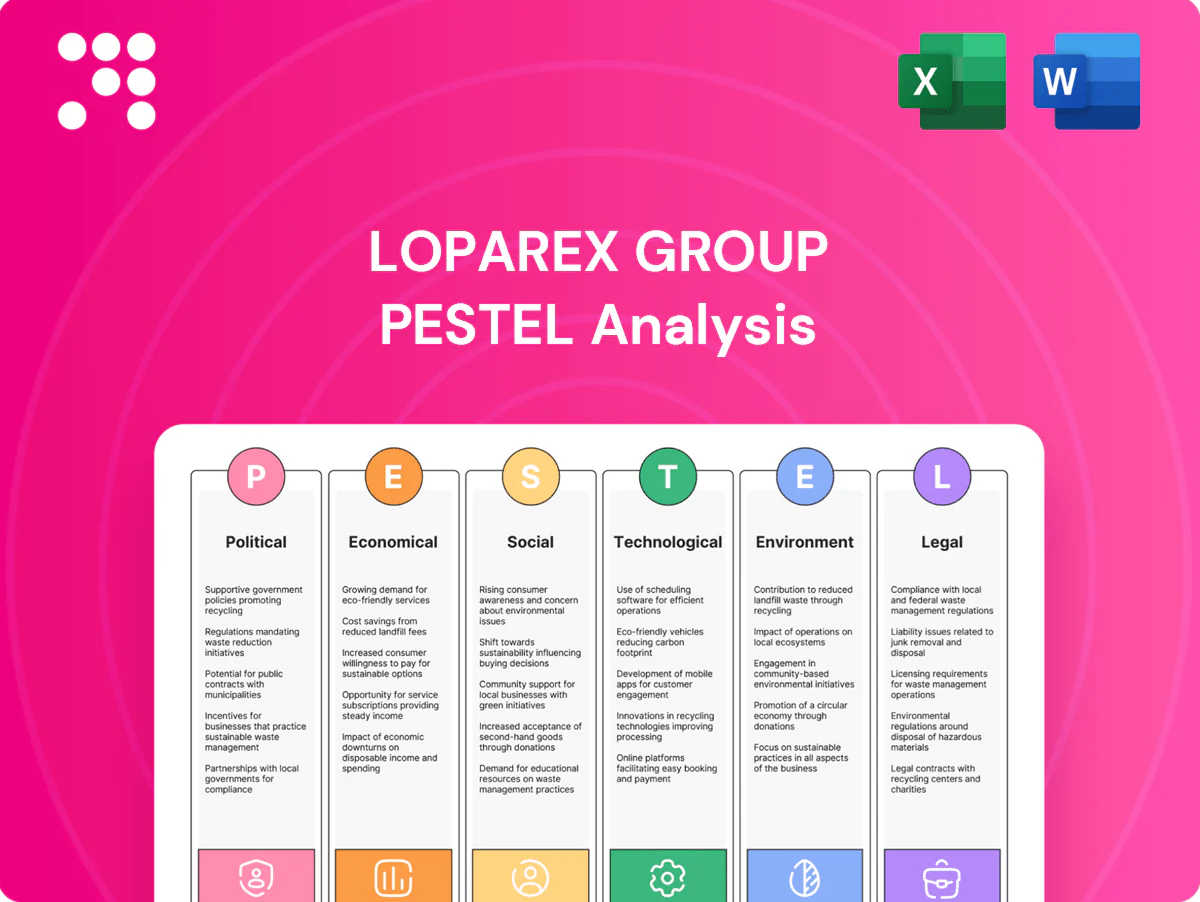
Loparex Group PESTLE Analysis

Plan Smarter. Present Sharper. Compete Stronger.
Gain a strategic advantage with our PESTLE Analysis of Loparex Group. Learn how political, economic, social, technological, legal and environmental forces influence its tape and release liner business and competitive positioning. Purchase the full report for actionable insights and downloadable charts.
Political factors

Trade policy volatility
As a global supplier, Loparex faces shifting tariffs and non-tariff barriers—notably US tariffs on Chinese goods of up to 25% introduced since 2018—which can raise landed costs and extend lead times. Changes in US-China and EU trade relations and WTO-tracked weak trade growth (around 1.7% in 2024) amplify volatility. Geopolitical tensions and sanctions since 2022 have disrupted resin routes; proactive sourcing diversification and regionalization reduce shock exposure.
Industrial subsidies and incentives
Government incentives under programs like the US Inflation Reduction Act (about $369 billion for clean energy) and EU Horizon Europe (€95.5 billion 2021–27) can materially lower capex for new coating lines and energy upgrades, improving ROI timelines. Competing regions use tax credits and investment grants to sway plant siting decisions. Securing circular-materials R&D grants accelerates product innovation. Monitoring national policy calendars reveals optimal application windows.

Healthcare policy priorities
Public funding levels and procurement account for roughly 10–20% of health-sector spending, directly influencing demand for medical liners and hygiene films. Procurement rules increasingly mandate sterility, traceability and recycled content, driving product spec upgrades. Pandemic preparedness policies now commonly require 3–6 months surge capacity for medical supplies. Aligning with national health directives secures multi-year procurement contracts and stable revenue streams.

Energy and industrial policy
Environmental diplomacy and carbon goals
National Paris commitments cascade into carbon pricing and reporting mandates; carbon pricing now covers about 23% of global emissions (World Bank 2024), driving scope for mandatory disclosures. Border carbon adjustments like the EU CBAM (phased since 2023) could add costs to high-embedded-emission resin imports. Participation in policy dialogues and alignment with >140 countries' net-zero plans (covering >80% of emissions) secures license to operate.
- 23% global emissions covered by carbon pricing (World Bank 2024)
- EU CBAM phased since 2023 — risk to resin import costs
- >140 countries with net-zero pledges; >80% emissions coverage
- Policy engagement shapes practical plastics standards
Tariffs, sanctions and decarbonization policies tighten supply chains, raise costs and compliance
Loparex faces tariff shifts, sanctions-driven resin route risk and US/EU trade volatility that raise landed costs and lead times. Energy and decarbonization policies (PPAs, CBAM) affect input costs and sourcing; grants (IRA, Horizon) lower capex for decarbonization. Health procurement and procurement rules create steady demand but require traceability and recycled content compliance.
| Metric | 2024/2025 |
|---|---|
| EU industrial power | €0.20/kWh (2024) |
| Carbon pricing coverage | 23% (World Bank 2024) |
| WTO trade growth | ~1.7% (2024) |
| Net-zero pledges | >140 countries (>80% emissions) |
What is included in the product
 Detailed Word Document
Explores how Political, Economic, Social, Technological, Environmental and Legal forces uniquely affect the Loparex Group, with data-backed, region- and industry-specific insights to identify risks and opportunities; designed for executives and investors and including forward-looking implications for strategy and scenario planning.

 Customizable Excel Spreadsheet
Concise, visually segmented Loparex Group PESTLE summary that’s editable for regional or business-line notes, easily dropped into presentations, shareable across teams, and written in clear language to streamline risk and strategy discussions.
Economic factors

Resin and paper input costs
Polymer resins, silicones and paper base stocks drive 40–60% of Loparex Group COGS, creating volatility as supply-demand imbalances and petrochemical outages produced resin price swings of up to 20% in 2024. Long-term contracts and hedging programs implemented in 2023–24 helped stabilize gross margins by an estimated 6–8%. Dual-sourcing critical inputs has reduced disruption risk and shortened recovery time by roughly 50%.
FX and global demand cycles
Multi-currency revenues and costs leave Loparex exposed to FX swings, with EUR/USD volatility and a DXY that averaged near 103 in 2024 amplifying margin risk. Slowdowns in consumer goods, automotive or construction—sectors linked to 2024 global manufacturing softness as global growth hovered around 3% (IMF)—can reduce tape and label liner volumes. Healthcare and hygiene demand showed resilience in 2023–24, offering partial countercyclicality. Active FX hedging and a balanced portfolio mix mitigate cyclicality and margin pressure.

Energy and logistics inflation
Electricity, gas and transport rate swings materially affect unit costs on Loparex’s energy‑intensive coating lines, with EU industrial power prices down ~25% from 2022 peaks by 2024 but still elevated vs pre‑pandemic levels; freight capacity and container spot rates—about 70–80% below 2021 highs in 2024—continue to shape global service levels; nearshoring and regional inventory buffering reduce exposure; targeted efficiency programs preserve margins during inflationary periods.

Customer consolidation
Large tape, label and medical customers wield pricing power and demand stringent SLAs (often 99% OTIF) and multi-year contracts (3–5 years); consolidation compresses margins by 1–3 percentage points while offering volume stability; Loparex can defend pricing through superior performance, sustainability credentials and technical support; strategic partnerships secure multi-year demand visibility.
- 99% OTIF SLAs
- 3–5 year contracts
- Margin pressure: -1–3 pp
- Defend via performance, sustainability, technical support
Capital intensity and ROI
- Capex range: €3–12m per line
- Typical payback: 3–7 years
- OEE uplift from data programs: 10–20%
- 1% scrap reduction ≈ 1% gross margin uplift
Tariffs, sanctions and decarbonization policies tighten supply chains, raise costs and compliance
Resin, silicone and paper input costs drove volatility—resin swings up to 20% in 2024—partly offset by 2023–24 hedges improving gross margins ~6–8%. FX (DXY ~103 in 2024) and ~3% global growth (IMF 2024) create cyclicality, while healthcare demand remains resilient. Energy down ~25% from 2022 peaks and freight -70–80% vs 2021 cut unit-cost pressure; capex €3–12m/line, payback 3–7y, OEE +10–20%.
| Metric | Value |
|---|---|
| Resin price swing (2024) | up to 20% |
| DXY (avg 2024) | ~103 |
| Global growth (2024 IMF) | ~3% |
| EU power vs 2022 | -25% |
| Freight vs 2021 | -70–80% |
| Capex per line | €3–12m |
| Payback | 3–7 years |
| OEE uplift | 10–20% |
Same Document Delivered
Loparex Group PESTLE Analysis
The Loparex Group PESTLE Analysis preview shown here is the exact document you’ll receive after purchase, fully formatted and ready to use. It contains the complete political, economic, social, technological, legal and environmental assessment as displayed, with professional structure and sourcing. No placeholders or teasers—download the finished file immediately after checkout.

Plan Smarter. Present Sharper. Compete Stronger.
Gain a strategic advantage with our PESTLE Analysis of Loparex Group. Learn how political, economic, social, technological, legal and environmental forces influence its tape and release liner business and competitive positioning. Purchase the full report for actionable insights and downloadable charts.
Political factors
Trade policy volatility
As a global supplier, Loparex faces shifting tariffs and non-tariff barriers—notably US tariffs on Chinese goods of up to 25% introduced since 2018—which can raise landed costs and extend lead times. Changes in US-China and EU trade relations and WTO-tracked weak trade growth (around 1.7% in 2024) amplify volatility. Geopolitical tensions and sanctions since 2022 have disrupted resin routes; proactive sourcing diversification and regionalization reduce shock exposure.
Industrial subsidies and incentives
Government incentives under programs like the US Inflation Reduction Act (about $369 billion for clean energy) and EU Horizon Europe (€95.5 billion 2021–27) can materially lower capex for new coating lines and energy upgrades, improving ROI timelines. Competing regions use tax credits and investment grants to sway plant siting decisions. Securing circular-materials R&D grants accelerates product innovation. Monitoring national policy calendars reveals optimal application windows.
Healthcare policy priorities
Public funding levels and procurement account for roughly 10–20% of health-sector spending, directly influencing demand for medical liners and hygiene films. Procurement rules increasingly mandate sterility, traceability and recycled content, driving product spec upgrades. Pandemic preparedness policies now commonly require 3–6 months surge capacity for medical supplies. Aligning with national health directives secures multi-year procurement contracts and stable revenue streams.
Energy and industrial policy
Environmental diplomacy and carbon goals
National Paris commitments cascade into carbon pricing and reporting mandates; carbon pricing now covers about 23% of global emissions (World Bank 2024), driving scope for mandatory disclosures. Border carbon adjustments like the EU CBAM (phased since 2023) could add costs to high-embedded-emission resin imports. Participation in policy dialogues and alignment with >140 countries' net-zero plans (covering >80% of emissions) secures license to operate.
- 23% global emissions covered by carbon pricing (World Bank 2024)
- EU CBAM phased since 2023 — risk to resin import costs
- >140 countries with net-zero pledges; >80% emissions coverage
- Policy engagement shapes practical plastics standards
Tariffs, sanctions and decarbonization policies tighten supply chains, raise costs and compliance
Loparex faces tariff shifts, sanctions-driven resin route risk and US/EU trade volatility that raise landed costs and lead times. Energy and decarbonization policies (PPAs, CBAM) affect input costs and sourcing; grants (IRA, Horizon) lower capex for decarbonization. Health procurement and procurement rules create steady demand but require traceability and recycled content compliance.
| Metric | 2024/2025 |
|---|---|
| EU industrial power | €0.20/kWh (2024) |
| Carbon pricing coverage | 23% (World Bank 2024) |
| WTO trade growth | ~1.7% (2024) |
| Net-zero pledges | >140 countries (>80% emissions) |
What is included in the product
Detailed Word Document
Explores how Political, Economic, Social, Technological, Environmental and Legal forces uniquely affect the Loparex Group, with data-backed, region- and industry-specific insights to identify risks and opportunities; designed for executives and investors and including forward-looking implications for strategy and scenario planning.
Customizable Excel Spreadsheet
Concise, visually segmented Loparex Group PESTLE summary that’s editable for regional or business-line notes, easily dropped into presentations, shareable across teams, and written in clear language to streamline risk and strategy discussions.
Economic factors
Resin and paper input costs
Polymer resins, silicones and paper base stocks drive 40–60% of Loparex Group COGS, creating volatility as supply-demand imbalances and petrochemical outages produced resin price swings of up to 20% in 2024. Long-term contracts and hedging programs implemented in 2023–24 helped stabilize gross margins by an estimated 6–8%. Dual-sourcing critical inputs has reduced disruption risk and shortened recovery time by roughly 50%.
FX and global demand cycles
Multi-currency revenues and costs leave Loparex exposed to FX swings, with EUR/USD volatility and a DXY that averaged near 103 in 2024 amplifying margin risk. Slowdowns in consumer goods, automotive or construction—sectors linked to 2024 global manufacturing softness as global growth hovered around 3% (IMF)—can reduce tape and label liner volumes. Healthcare and hygiene demand showed resilience in 2023–24, offering partial countercyclicality. Active FX hedging and a balanced portfolio mix mitigate cyclicality and margin pressure.
Energy and logistics inflation
Electricity, gas and transport rate swings materially affect unit costs on Loparex’s energy‑intensive coating lines, with EU industrial power prices down ~25% from 2022 peaks by 2024 but still elevated vs pre‑pandemic levels; freight capacity and container spot rates—about 70–80% below 2021 highs in 2024—continue to shape global service levels; nearshoring and regional inventory buffering reduce exposure; targeted efficiency programs preserve margins during inflationary periods.
Customer consolidation
Large tape, label and medical customers wield pricing power and demand stringent SLAs (often 99% OTIF) and multi-year contracts (3–5 years); consolidation compresses margins by 1–3 percentage points while offering volume stability; Loparex can defend pricing through superior performance, sustainability credentials and technical support; strategic partnerships secure multi-year demand visibility.
- 99% OTIF SLAs
- 3–5 year contracts
- Margin pressure: -1–3 pp
- Defend via performance, sustainability, technical support
Capital intensity and ROI
- Capex range: €3–12m per line
- Typical payback: 3–7 years
- OEE uplift from data programs: 10–20%
- 1% scrap reduction ≈ 1% gross margin uplift
Tariffs, sanctions and decarbonization policies tighten supply chains, raise costs and compliance
Resin, silicone and paper input costs drove volatility—resin swings up to 20% in 2024—partly offset by 2023–24 hedges improving gross margins ~6–8%. FX (DXY ~103 in 2024) and ~3% global growth (IMF 2024) create cyclicality, while healthcare demand remains resilient. Energy down ~25% from 2022 peaks and freight -70–80% vs 2021 cut unit-cost pressure; capex €3–12m/line, payback 3–7y, OEE +10–20%.
| Metric | Value |
|---|---|
| Resin price swing (2024) | up to 20% |
| DXY (avg 2024) | ~103 |
| Global growth (2024 IMF) | ~3% |
| EU power vs 2022 | -25% |
| Freight vs 2021 | -70–80% |
| Capex per line | €3–12m |
| Payback | 3–7 years |
| OEE uplift | 10–20% |
Same Document Delivered
Loparex Group PESTLE Analysis
The Loparex Group PESTLE Analysis preview shown here is the exact document you’ll receive after purchase, fully formatted and ready to use. It contains the complete political, economic, social, technological, legal and environmental assessment as displayed, with professional structure and sourcing. No placeholders or teasers—download the finished file immediately after checkout.
Original: $10.00
-65%$10.00
$3.50Description
Plan Smarter. Present Sharper. Compete Stronger.
Gain a strategic advantage with our PESTLE Analysis of Loparex Group. Learn how political, economic, social, technological, legal and environmental forces influence its tape and release liner business and competitive positioning. Purchase the full report for actionable insights and downloadable charts.
Political factors
Trade policy volatility
As a global supplier, Loparex faces shifting tariffs and non-tariff barriers—notably US tariffs on Chinese goods of up to 25% introduced since 2018—which can raise landed costs and extend lead times. Changes in US-China and EU trade relations and WTO-tracked weak trade growth (around 1.7% in 2024) amplify volatility. Geopolitical tensions and sanctions since 2022 have disrupted resin routes; proactive sourcing diversification and regionalization reduce shock exposure.
Industrial subsidies and incentives
Government incentives under programs like the US Inflation Reduction Act (about $369 billion for clean energy) and EU Horizon Europe (€95.5 billion 2021–27) can materially lower capex for new coating lines and energy upgrades, improving ROI timelines. Competing regions use tax credits and investment grants to sway plant siting decisions. Securing circular-materials R&D grants accelerates product innovation. Monitoring national policy calendars reveals optimal application windows.
Healthcare policy priorities
Public funding levels and procurement account for roughly 10–20% of health-sector spending, directly influencing demand for medical liners and hygiene films. Procurement rules increasingly mandate sterility, traceability and recycled content, driving product spec upgrades. Pandemic preparedness policies now commonly require 3–6 months surge capacity for medical supplies. Aligning with national health directives secures multi-year procurement contracts and stable revenue streams.
Energy and industrial policy
Environmental diplomacy and carbon goals
National Paris commitments cascade into carbon pricing and reporting mandates; carbon pricing now covers about 23% of global emissions (World Bank 2024), driving scope for mandatory disclosures. Border carbon adjustments like the EU CBAM (phased since 2023) could add costs to high-embedded-emission resin imports. Participation in policy dialogues and alignment with >140 countries' net-zero plans (covering >80% of emissions) secures license to operate.
- 23% global emissions covered by carbon pricing (World Bank 2024)
- EU CBAM phased since 2023 — risk to resin import costs
- >140 countries with net-zero pledges; >80% emissions coverage
- Policy engagement shapes practical plastics standards
Tariffs, sanctions and decarbonization policies tighten supply chains, raise costs and compliance
Loparex faces tariff shifts, sanctions-driven resin route risk and US/EU trade volatility that raise landed costs and lead times. Energy and decarbonization policies (PPAs, CBAM) affect input costs and sourcing; grants (IRA, Horizon) lower capex for decarbonization. Health procurement and procurement rules create steady demand but require traceability and recycled content compliance.
| Metric | 2024/2025 |
|---|---|
| EU industrial power | €0.20/kWh (2024) |
| Carbon pricing coverage | 23% (World Bank 2024) |
| WTO trade growth | ~1.7% (2024) |
| Net-zero pledges | >140 countries (>80% emissions) |
What is included in the product
Detailed Word Document
Explores how Political, Economic, Social, Technological, Environmental and Legal forces uniquely affect the Loparex Group, with data-backed, region- and industry-specific insights to identify risks and opportunities; designed for executives and investors and including forward-looking implications for strategy and scenario planning.
Customizable Excel Spreadsheet
Concise, visually segmented Loparex Group PESTLE summary that’s editable for regional or business-line notes, easily dropped into presentations, shareable across teams, and written in clear language to streamline risk and strategy discussions.
Economic factors
Resin and paper input costs
Polymer resins, silicones and paper base stocks drive 40–60% of Loparex Group COGS, creating volatility as supply-demand imbalances and petrochemical outages produced resin price swings of up to 20% in 2024. Long-term contracts and hedging programs implemented in 2023–24 helped stabilize gross margins by an estimated 6–8%. Dual-sourcing critical inputs has reduced disruption risk and shortened recovery time by roughly 50%.
FX and global demand cycles
Multi-currency revenues and costs leave Loparex exposed to FX swings, with EUR/USD volatility and a DXY that averaged near 103 in 2024 amplifying margin risk. Slowdowns in consumer goods, automotive or construction—sectors linked to 2024 global manufacturing softness as global growth hovered around 3% (IMF)—can reduce tape and label liner volumes. Healthcare and hygiene demand showed resilience in 2023–24, offering partial countercyclicality. Active FX hedging and a balanced portfolio mix mitigate cyclicality and margin pressure.
Energy and logistics inflation
Electricity, gas and transport rate swings materially affect unit costs on Loparex’s energy‑intensive coating lines, with EU industrial power prices down ~25% from 2022 peaks by 2024 but still elevated vs pre‑pandemic levels; freight capacity and container spot rates—about 70–80% below 2021 highs in 2024—continue to shape global service levels; nearshoring and regional inventory buffering reduce exposure; targeted efficiency programs preserve margins during inflationary periods.
Customer consolidation
Large tape, label and medical customers wield pricing power and demand stringent SLAs (often 99% OTIF) and multi-year contracts (3–5 years); consolidation compresses margins by 1–3 percentage points while offering volume stability; Loparex can defend pricing through superior performance, sustainability credentials and technical support; strategic partnerships secure multi-year demand visibility.
- 99% OTIF SLAs
- 3–5 year contracts
- Margin pressure: -1–3 pp
- Defend via performance, sustainability, technical support
Capital intensity and ROI
- Capex range: €3–12m per line
- Typical payback: 3–7 years
- OEE uplift from data programs: 10–20%
- 1% scrap reduction ≈ 1% gross margin uplift
Tariffs, sanctions and decarbonization policies tighten supply chains, raise costs and compliance
Resin, silicone and paper input costs drove volatility—resin swings up to 20% in 2024—partly offset by 2023–24 hedges improving gross margins ~6–8%. FX (DXY ~103 in 2024) and ~3% global growth (IMF 2024) create cyclicality, while healthcare demand remains resilient. Energy down ~25% from 2022 peaks and freight -70–80% vs 2021 cut unit-cost pressure; capex €3–12m/line, payback 3–7y, OEE +10–20%.
| Metric | Value |
|---|---|
| Resin price swing (2024) | up to 20% |
| DXY (avg 2024) | ~103 |
| Global growth (2024 IMF) | ~3% |
| EU power vs 2022 | -25% |
| Freight vs 2021 | -70–80% |
| Capex per line | €3–12m |
| Payback | 3–7 years |
| OEE uplift | 10–20% |
Same Document Delivered
Loparex Group PESTLE Analysis
The Loparex Group PESTLE Analysis preview shown here is the exact document you’ll receive after purchase, fully formatted and ready to use. It contains the complete political, economic, social, technological, legal and environmental assessment as displayed, with professional structure and sourcing. No placeholders or teasers—download the finished file immediately after checkout.











