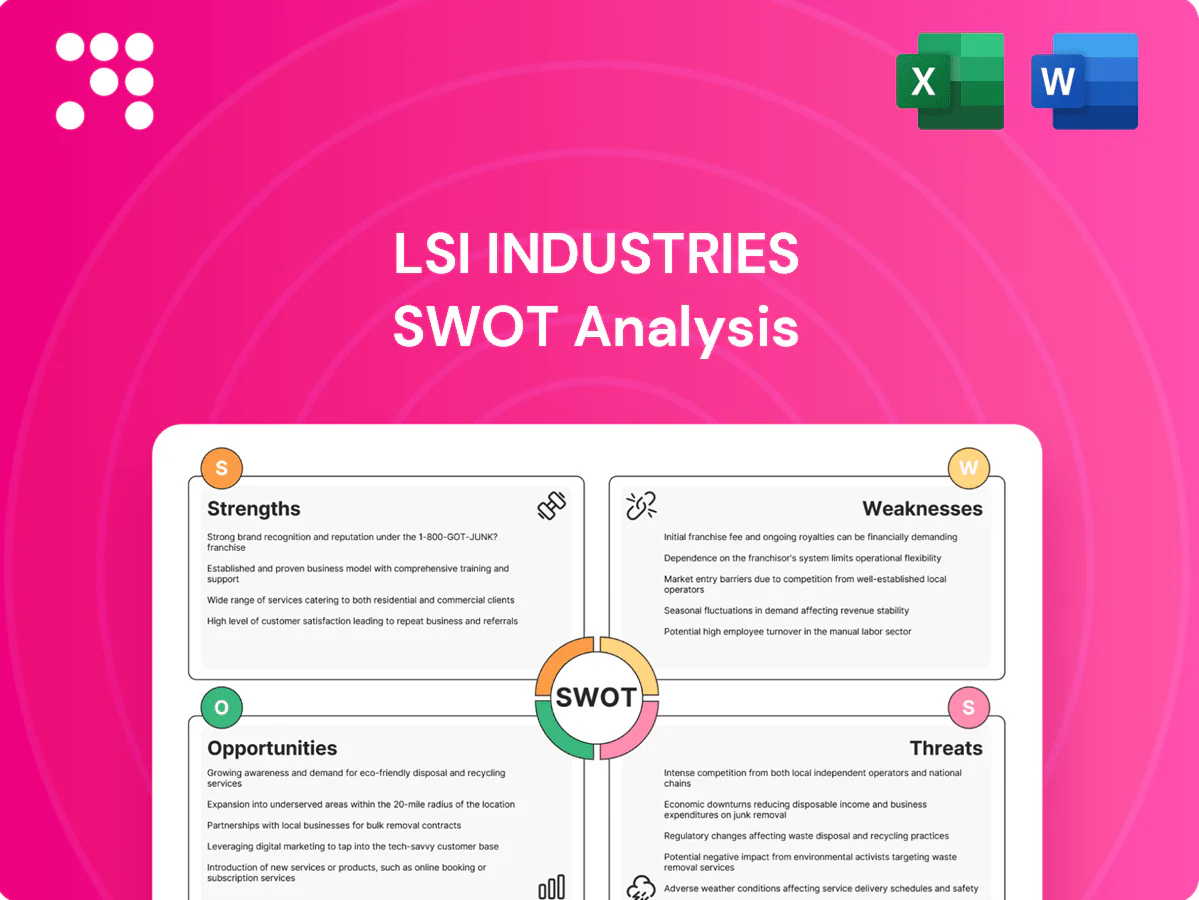
LSI Industries SWOT Analysis

Make Insightful Decisions Backed by Expert Research
LSI Industries faces solid niche leadership in lighting and controls but navigates supply-chain volatility and competitive pressure; growth hinges on product innovation and energy-efficiency demand. Want a full, editable SWOT with data-driven insights and Excel + Word deliverables? Purchase the complete analysis to strategize, pitch, or invest with confidence.
Strengths

Diversified end-market exposure
Serving four end-markets — petroleum/convenience, quick-service restaurants, retail and industrial — reduces dependence on any single vertical and helps smooth demand cycles. This customer mix stabilizes revenue streams and enables cross-selling of lighting and graphics across formats. Diversification enhances resilience during sector-specific slowdowns, lowering concentration risk for LSI.
Energy-efficient lighting expertise
LSI’s focus on high-efficiency indoor/outdoor LED fixtures aligns with ongoing LED adoption, with DOE noting LEDs use at least 75% less energy than incandescents and last far longer. Demonstrable site-level savings of 30–50% in commercial retrofits strengthen value propositions for multi-site operators. Efficiency leadership supports premium pricing and typical LED retrofit payback of 1–3 years, positioning LSI for large retrofit waves as legacy lighting is replaced.

Integrated lighting and visual communication
Combining luminaires with digital signage allows LSI to offer bundled branded-environment solutions that drove part of its reported fiscal 2024 net sales of $420.9 million, simplifying procurement and installation for national accounts. One-stop offerings reduce project timelines and logistics for multi-site rollouts, enhancing appeal to retailers and chains. Integrated fixtures improve site aesthetics and customer engagement, a differentiation that has boosted LSI’s competitive bid win rates.

Project and program capabilities for multi-site rollouts
LSI Industries leverages chain-format experience to deliver standardized designs that enable rapid deployment and regulatory compliance, while program management minimizes customer downtime and total project cost. Scalable operations support large retrofit or refresh initiatives and help convert single projects into repeat, long-term relationships with commercial and retail chains.
- Standardized design: faster approvals and compliance
- Program management: reduced downtime and lower TCO
- Scalability: supports large multi-site rollouts
- Customer retention: drives repeat, long-term contracts
Outdoor and harsh-environment competence
LSI Industries (NASDAQ:LYTS) leverages durable, high-photometric outdoor fixtures for canopies, parking, and perimeters—solutions that fit petroleum forecourts and logistics/industrial sites and lower operator maintenance and safety risks. The strong outdoor portfolio expands addressable projects and supports commercial spec pipelines; LSI reported FY2024 net sales of 469.6 million, underscoring scale.
- Durability
- Photometric performance
- Forecourt & logistics fit
- Reduces maintenance/safety risk
Diversified across 4 markets, LED saves ≥75%, typical payback 1–3 yrs, $469.6M sales
Diversified across four end-markets reduces single-vertical risk and enables cross-selling. LED leadership (DOE: LEDs use ≥75% less energy) and typical retrofit payback of 1–3 years support premium pricing and retrofit demand. Durable outdoor fixtures and chain-format program management helped drive FY2024 net sales of $469.6M.
| Metric | Value |
|---|---|
| FY2024 net sales | $469.6M |
| End-markets | 4 |
| LED energy savings | ≥75% |
| Retrofit payback | 1–3 yrs |
What is included in the product
 Detailed Word Document
Analyzes LSI Industries’s competitive position by outlining its strengths, weaknesses, opportunities, and threats, highlighting core lighting and controls expertise, market diversification prospects, supply-chain and margin pressures, and regulatory and competitive risks shaping future growth.

 Customizable Excel Spreadsheet
Delivers a concise SWOT matrix for LSI Industries to streamline strategic alignment and accelerate executive decision-making.
Weaknesses

Exposure to construction and retrofit cycles
Demand for LSI Industries is closely tied to capital budgets for new builds and remodels, so slowdowns in retail and QSR expansion can defer projects and compress order flow. Retrofit waves are lumpy, producing uneven factory utilization and margin pressure. This cyclicality complicates forecasting and forces conservative inventory planning and variable production scheduling.
High competitive intensity
High competitive intensity: lighting is crowded with global majors like Signify and Acuity Brands plus agile niche players, in a global market estimated at $120 billion in 2024. Price-based bidding pressures margins, particularly for commoditized fixtures, compressing gross margins by several percentage points. LSI must maintain product differentiation and may need increased marketing and channel investments to avoid race-to-the-bottom pricing.

Technology pace and product obsolescence
Rapid advances in LED, controls and signage technologies compress product lifecycles, forcing LSI (LYTS) into more frequent redesigns that strain R&D and working capital. Missteps can trigger inventory write-downs or failure to meet evolving specifications. Maintaining interoperability with standards such as DALI and Zhaga adds engineering complexity and integration costs.

Potential dependence on large accounts
Winning national chain programs can concentrate revenue in a few customers; in FY2024 LSI reported its top five customers accounted for about 31% of net sales, so loss or delay of a key program could materially dent quarterly results. Large buyers often hold pricing leverage, pressuring margins; diversifying the account base remains necessary to reduce volatility and protect cash flow.
- Top-5 ~31% (FY2024)
- High customer concentration risk
- Pricing leverage favors large buyers
- Need to diversify to stabilize revenue
Signage/graphics integration complexity
- Multi-vendor integration risk
- Extended service/warranty scope
- Higher project timeline volatility
- Margin and satisfaction erosion
Cyclical lighting demand, top-5 concentration 31% and margin squeeze
LSI's revenue is cyclical and tied to capital budgets, causing lumpy orders and uneven factory utilization. Top-5 customers ~31% of FY2024 net sales, creating concentration and pricing leverage risks. Intense competition in a ~$120B 2024 lighting market and rapid LED/control churn compress margins and raise R&D, inventory and warranty costs.
| Metric | Value |
|---|---|
| Top-5 customers (FY2024) | ~31% |
| Global lighting market (2024) | ~$120B |
| Margin pressure | Down several pts (competitive) |
Same Document Delivered
LSI Industries SWOT Analysis
This is the actual LSI Industries SWOT analysis document you’ll receive upon purchase—no surprises, just professional quality. The preview below is taken directly from the full report you'll get, and the complete, editable version becomes available after checkout. Buy now to unlock the full, detailed analysis.

Make Insightful Decisions Backed by Expert Research
LSI Industries faces solid niche leadership in lighting and controls but navigates supply-chain volatility and competitive pressure; growth hinges on product innovation and energy-efficiency demand. Want a full, editable SWOT with data-driven insights and Excel + Word deliverables? Purchase the complete analysis to strategize, pitch, or invest with confidence.
Strengths
Diversified end-market exposure
Serving four end-markets — petroleum/convenience, quick-service restaurants, retail and industrial — reduces dependence on any single vertical and helps smooth demand cycles. This customer mix stabilizes revenue streams and enables cross-selling of lighting and graphics across formats. Diversification enhances resilience during sector-specific slowdowns, lowering concentration risk for LSI.
Energy-efficient lighting expertise
LSI’s focus on high-efficiency indoor/outdoor LED fixtures aligns with ongoing LED adoption, with DOE noting LEDs use at least 75% less energy than incandescents and last far longer. Demonstrable site-level savings of 30–50% in commercial retrofits strengthen value propositions for multi-site operators. Efficiency leadership supports premium pricing and typical LED retrofit payback of 1–3 years, positioning LSI for large retrofit waves as legacy lighting is replaced.
Integrated lighting and visual communication
Combining luminaires with digital signage allows LSI to offer bundled branded-environment solutions that drove part of its reported fiscal 2024 net sales of $420.9 million, simplifying procurement and installation for national accounts. One-stop offerings reduce project timelines and logistics for multi-site rollouts, enhancing appeal to retailers and chains. Integrated fixtures improve site aesthetics and customer engagement, a differentiation that has boosted LSI’s competitive bid win rates.
Project and program capabilities for multi-site rollouts
LSI Industries leverages chain-format experience to deliver standardized designs that enable rapid deployment and regulatory compliance, while program management minimizes customer downtime and total project cost. Scalable operations support large retrofit or refresh initiatives and help convert single projects into repeat, long-term relationships with commercial and retail chains.
- Standardized design: faster approvals and compliance
- Program management: reduced downtime and lower TCO
- Scalability: supports large multi-site rollouts
- Customer retention: drives repeat, long-term contracts
Outdoor and harsh-environment competence
LSI Industries (NASDAQ:LYTS) leverages durable, high-photometric outdoor fixtures for canopies, parking, and perimeters—solutions that fit petroleum forecourts and logistics/industrial sites and lower operator maintenance and safety risks. The strong outdoor portfolio expands addressable projects and supports commercial spec pipelines; LSI reported FY2024 net sales of 469.6 million, underscoring scale.
- Durability
- Photometric performance
- Forecourt & logistics fit
- Reduces maintenance/safety risk
Diversified across 4 markets, LED saves ≥75%, typical payback 1–3 yrs, $469.6M sales
Diversified across four end-markets reduces single-vertical risk and enables cross-selling. LED leadership (DOE: LEDs use ≥75% less energy) and typical retrofit payback of 1–3 years support premium pricing and retrofit demand. Durable outdoor fixtures and chain-format program management helped drive FY2024 net sales of $469.6M.
| Metric | Value |
|---|---|
| FY2024 net sales | $469.6M |
| End-markets | 4 |
| LED energy savings | ≥75% |
| Retrofit payback | 1–3 yrs |
What is included in the product
Detailed Word Document
Analyzes LSI Industries’s competitive position by outlining its strengths, weaknesses, opportunities, and threats, highlighting core lighting and controls expertise, market diversification prospects, supply-chain and margin pressures, and regulatory and competitive risks shaping future growth.
Customizable Excel Spreadsheet
Delivers a concise SWOT matrix for LSI Industries to streamline strategic alignment and accelerate executive decision-making.
Weaknesses
Exposure to construction and retrofit cycles
Demand for LSI Industries is closely tied to capital budgets for new builds and remodels, so slowdowns in retail and QSR expansion can defer projects and compress order flow. Retrofit waves are lumpy, producing uneven factory utilization and margin pressure. This cyclicality complicates forecasting and forces conservative inventory planning and variable production scheduling.
High competitive intensity
High competitive intensity: lighting is crowded with global majors like Signify and Acuity Brands plus agile niche players, in a global market estimated at $120 billion in 2024. Price-based bidding pressures margins, particularly for commoditized fixtures, compressing gross margins by several percentage points. LSI must maintain product differentiation and may need increased marketing and channel investments to avoid race-to-the-bottom pricing.
Technology pace and product obsolescence
Rapid advances in LED, controls and signage technologies compress product lifecycles, forcing LSI (LYTS) into more frequent redesigns that strain R&D and working capital. Missteps can trigger inventory write-downs or failure to meet evolving specifications. Maintaining interoperability with standards such as DALI and Zhaga adds engineering complexity and integration costs.
Potential dependence on large accounts
Winning national chain programs can concentrate revenue in a few customers; in FY2024 LSI reported its top five customers accounted for about 31% of net sales, so loss or delay of a key program could materially dent quarterly results. Large buyers often hold pricing leverage, pressuring margins; diversifying the account base remains necessary to reduce volatility and protect cash flow.
- Top-5 ~31% (FY2024)
- High customer concentration risk
- Pricing leverage favors large buyers
- Need to diversify to stabilize revenue
Signage/graphics integration complexity
- Multi-vendor integration risk
- Extended service/warranty scope
- Higher project timeline volatility
- Margin and satisfaction erosion
Cyclical lighting demand, top-5 concentration 31% and margin squeeze
LSI's revenue is cyclical and tied to capital budgets, causing lumpy orders and uneven factory utilization. Top-5 customers ~31% of FY2024 net sales, creating concentration and pricing leverage risks. Intense competition in a ~$120B 2024 lighting market and rapid LED/control churn compress margins and raise R&D, inventory and warranty costs.
| Metric | Value |
|---|---|
| Top-5 customers (FY2024) | ~31% |
| Global lighting market (2024) | ~$120B |
| Margin pressure | Down several pts (competitive) |
Same Document Delivered
LSI Industries SWOT Analysis
This is the actual LSI Industries SWOT analysis document you’ll receive upon purchase—no surprises, just professional quality. The preview below is taken directly from the full report you'll get, and the complete, editable version becomes available after checkout. Buy now to unlock the full, detailed analysis.
Description
Make Insightful Decisions Backed by Expert Research
LSI Industries faces solid niche leadership in lighting and controls but navigates supply-chain volatility and competitive pressure; growth hinges on product innovation and energy-efficiency demand. Want a full, editable SWOT with data-driven insights and Excel + Word deliverables? Purchase the complete analysis to strategize, pitch, or invest with confidence.
Strengths
Diversified end-market exposure
Serving four end-markets — petroleum/convenience, quick-service restaurants, retail and industrial — reduces dependence on any single vertical and helps smooth demand cycles. This customer mix stabilizes revenue streams and enables cross-selling of lighting and graphics across formats. Diversification enhances resilience during sector-specific slowdowns, lowering concentration risk for LSI.
Energy-efficient lighting expertise
LSI’s focus on high-efficiency indoor/outdoor LED fixtures aligns with ongoing LED adoption, with DOE noting LEDs use at least 75% less energy than incandescents and last far longer. Demonstrable site-level savings of 30–50% in commercial retrofits strengthen value propositions for multi-site operators. Efficiency leadership supports premium pricing and typical LED retrofit payback of 1–3 years, positioning LSI for large retrofit waves as legacy lighting is replaced.
Integrated lighting and visual communication
Combining luminaires with digital signage allows LSI to offer bundled branded-environment solutions that drove part of its reported fiscal 2024 net sales of $420.9 million, simplifying procurement and installation for national accounts. One-stop offerings reduce project timelines and logistics for multi-site rollouts, enhancing appeal to retailers and chains. Integrated fixtures improve site aesthetics and customer engagement, a differentiation that has boosted LSI’s competitive bid win rates.
Project and program capabilities for multi-site rollouts
LSI Industries leverages chain-format experience to deliver standardized designs that enable rapid deployment and regulatory compliance, while program management minimizes customer downtime and total project cost. Scalable operations support large retrofit or refresh initiatives and help convert single projects into repeat, long-term relationships with commercial and retail chains.
- Standardized design: faster approvals and compliance
- Program management: reduced downtime and lower TCO
- Scalability: supports large multi-site rollouts
- Customer retention: drives repeat, long-term contracts
Outdoor and harsh-environment competence
LSI Industries (NASDAQ:LYTS) leverages durable, high-photometric outdoor fixtures for canopies, parking, and perimeters—solutions that fit petroleum forecourts and logistics/industrial sites and lower operator maintenance and safety risks. The strong outdoor portfolio expands addressable projects and supports commercial spec pipelines; LSI reported FY2024 net sales of 469.6 million, underscoring scale.
- Durability
- Photometric performance
- Forecourt & logistics fit
- Reduces maintenance/safety risk
Diversified across 4 markets, LED saves ≥75%, typical payback 1–3 yrs, $469.6M sales
Diversified across four end-markets reduces single-vertical risk and enables cross-selling. LED leadership (DOE: LEDs use ≥75% less energy) and typical retrofit payback of 1–3 years support premium pricing and retrofit demand. Durable outdoor fixtures and chain-format program management helped drive FY2024 net sales of $469.6M.
| Metric | Value |
|---|---|
| FY2024 net sales | $469.6M |
| End-markets | 4 |
| LED energy savings | ≥75% |
| Retrofit payback | 1–3 yrs |
What is included in the product
Detailed Word Document
Analyzes LSI Industries’s competitive position by outlining its strengths, weaknesses, opportunities, and threats, highlighting core lighting and controls expertise, market diversification prospects, supply-chain and margin pressures, and regulatory and competitive risks shaping future growth.
Customizable Excel Spreadsheet
Delivers a concise SWOT matrix for LSI Industries to streamline strategic alignment and accelerate executive decision-making.
Weaknesses
Exposure to construction and retrofit cycles
Demand for LSI Industries is closely tied to capital budgets for new builds and remodels, so slowdowns in retail and QSR expansion can defer projects and compress order flow. Retrofit waves are lumpy, producing uneven factory utilization and margin pressure. This cyclicality complicates forecasting and forces conservative inventory planning and variable production scheduling.
High competitive intensity
High competitive intensity: lighting is crowded with global majors like Signify and Acuity Brands plus agile niche players, in a global market estimated at $120 billion in 2024. Price-based bidding pressures margins, particularly for commoditized fixtures, compressing gross margins by several percentage points. LSI must maintain product differentiation and may need increased marketing and channel investments to avoid race-to-the-bottom pricing.
Technology pace and product obsolescence
Rapid advances in LED, controls and signage technologies compress product lifecycles, forcing LSI (LYTS) into more frequent redesigns that strain R&D and working capital. Missteps can trigger inventory write-downs or failure to meet evolving specifications. Maintaining interoperability with standards such as DALI and Zhaga adds engineering complexity and integration costs.
Potential dependence on large accounts
Winning national chain programs can concentrate revenue in a few customers; in FY2024 LSI reported its top five customers accounted for about 31% of net sales, so loss or delay of a key program could materially dent quarterly results. Large buyers often hold pricing leverage, pressuring margins; diversifying the account base remains necessary to reduce volatility and protect cash flow.
- Top-5 ~31% (FY2024)
- High customer concentration risk
- Pricing leverage favors large buyers
- Need to diversify to stabilize revenue
Signage/graphics integration complexity
- Multi-vendor integration risk
- Extended service/warranty scope
- Higher project timeline volatility
- Margin and satisfaction erosion
Cyclical lighting demand, top-5 concentration 31% and margin squeeze
LSI's revenue is cyclical and tied to capital budgets, causing lumpy orders and uneven factory utilization. Top-5 customers ~31% of FY2024 net sales, creating concentration and pricing leverage risks. Intense competition in a ~$120B 2024 lighting market and rapid LED/control churn compress margins and raise R&D, inventory and warranty costs.
| Metric | Value |
|---|---|
| Top-5 customers (FY2024) | ~31% |
| Global lighting market (2024) | ~$120B |
| Margin pressure | Down several pts (competitive) |
Same Document Delivered
LSI Industries SWOT Analysis
This is the actual LSI Industries SWOT analysis document you’ll receive upon purchase—no surprises, just professional quality. The preview below is taken directly from the full report you'll get, and the complete, editable version becomes available after checkout. Buy now to unlock the full, detailed analysis.











