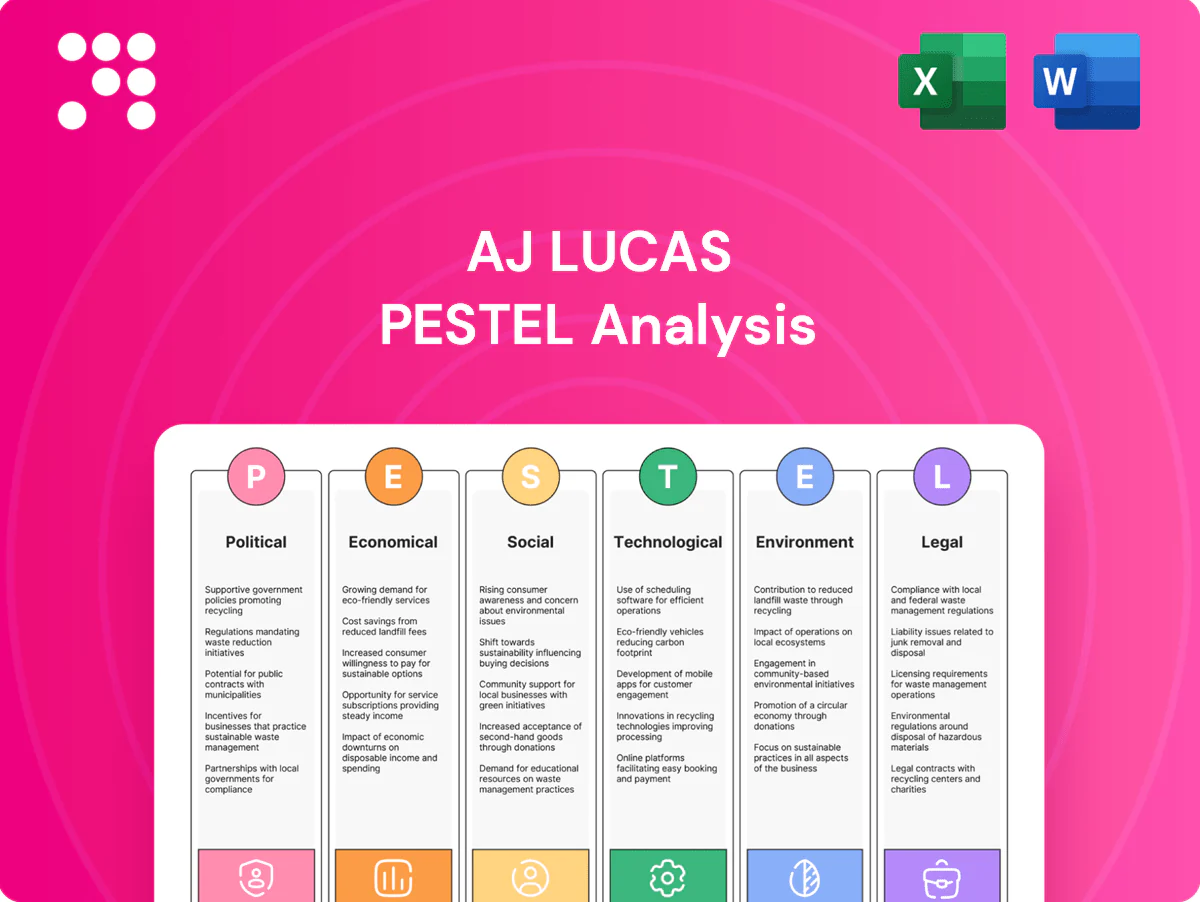
AJ Lucas PESTLE Analysis

Your Shortcut to Market Insight Starts Here
Discover how political shifts, economic cycles, and technological change are shaping AJ Lucas’s strategic outlook in our concise PESTLE snapshot. This analysis highlights regulatory risks and growth levers you can act on immediately. Purchase the full PESTLE to access the complete, editable report and make informed decisions with confidence.
Political factors

UK shale policy volatility
Cuadrilla’s prospects hinge on UK political stances toward fracking, which have swung from a moratorium after a 2.9 ML seismic event at Preston New Road in 2019 to limited trials since then. Government changes can rapidly alter licensing, planning approvals and operating permissions. Policy uncertainty lengthens valuation timelines and redirects capital allocation. Close monitoring of Whitehall and devolved authorities is essential.
Australian infrastructure priorities
Public investment cycles in Australia, including the A$15 billion National Reconstruction Fund, drive drilling and engineering demand across utilities and transport, with federal and state budgets and election timetables shaping tender pipelines. Recent policy shifts prioritize resilience—flood and bushfire hardening—redirecting capital toward remediation and mitigation projects. AJ Lucas can align drilling and pipeline capabilities with priority corridors to stabilize revenue amid these programmatic shifts.

Energy security agendas
Rising geopolitical tensions reinforce domestic gas supply imperatives for AJ Lucas, especially as Australia’s LNG export capacity sits near 88 Mtpa, creating export versus domestic allocation pressures. Policymakers have signaled support for exploration and storage to cut import risks, unlocking potential funding, faster permitting and strategic partnerships. However, renewables accounted for about 37% of Australia’s electricity in 2023, threatening to crowd out gas-focused initiatives.

Trade and procurement rules
- Local content: tighter supplier pools
- Tariffs: higher equipment costs
- Visas: 195,000 planning level 2023–24
- Transparency: favors incumbents
- Compliance: boosts tender success
Regional community politics
Regional community politics shape AJ Lucas project outcomes as state and local councils control approvals, haulage routes and site operations; in 2024 several NSW council decisions extended approvals timelines for infrastructure projects, increasing oversight and conditional permits. Community-backed representatives have imposed strict conditions or delays on resource projects, while proactive stakeholder engagement has demonstrably reduced legal and social licence risks. Political goodwill lowers disruption costs and can shorten mobilisation windows.
- State/local approvals: high influence on timelines
- Community reps: source of conditional delays
- Engagement: mitigates legal/social risk
- Goodwill: reduces disruption and cost
NRF A$15bn, LNG ~88 Mtpa, renewables 37% and migration cap 195,000 constrain costs
Government program priorities (A$15bn National Reconstruction Fund) and export/domestic gas politics (LNG capacity ~88 Mtpa) drive AJ Lucas demand; renewables 37% (2023) and UK fracking uncertainty lengthen timelines. Tariffs, local‑content rules and migration cap 195,000 (2023–24) affect costs and labour availability.
| Metric | Value |
|---|---|
| NRF | A$15bn |
| LNG cap | ~88 Mtpa |
| Renewables | 37% (2023) |
| Migration | 195,000 (23–24) |
What is included in the product
 Detailed Word Document
Explores how Political, Economic, Social, Technological, Environmental and Legal factors uniquely affect AJ Lucas, with data-backed trends and region-specific regulatory context. Designed for executives and investors, it offers forward-looking insights and ready-to-use findings for strategy, risk management and funding pitches.

 Customizable Excel Spreadsheet
A concise, visually segmented PESTLE summary for AJ Lucas that can be dropped into presentations, annotated with local context or notes, and easily shared across teams to streamline external risk discussions and strategic planning.
Economic factors

Commodity price cycles
Drilling demand for AJ Lucas closely tracks oil, gas and coal prices—Brent averaged about USD 88/bbl in 2024, Henry Hub ~USD 3/MMBtu and Newcastle thermal coal ~USD 140/t—driving client capex cycles. Price volatility reduces backlog visibility and depresses fleet utilization, with spot rig rates swinging 20–40% in 2023–24. Hedging and flexible contracting can smooth revenue, while diversification across hydrocarbons and minerals buffers downturns.
Interest rates and funding
Higher interest rates (RBA cash rate 4.35% and 10‑yr bond ~4.2% in mid‑2025) lift WACC and depress client project NPVs, delaying sanctioning. Refinancing and equipment leasing have become materially costlier as credit spreads widened versus 2021. Strong cash discipline and staggered maturities reduce refinancing stress, while Australia's sizeable counter‑cyclical infrastructure pipeline helps offset demand slack.

Exchange rate exposure
Revenue and costs in AUD and GBP create translation and transaction exposure; GBP/AUD was about 1.85 on 1 July 2025 (Bloomberg), so sterling swings materially change reported AUD earnings. GBP volatility alters the AUD value of AJ Lucas’s Cuadrilla-related assets and cash flows. Company hedging programs for imported equipment and increased local sourcing provide margin protection and natural hedges.

Labor and input inflation
Tight Australian labour markets pushed wage growth into the mid-3% range (Wage Price Index ~3.6% year to March 2025), lifting subcontractor rates and crew costs for AJ Lucas. Steel and fuel costs remain volatile—Brent crude near USD 80/bbl in mid-2025 and hot-rolled coil ~15% below 2022 peaks—adding input pressure. Index-linked contracts and centralised procurement frameworks have preserved margins while productivity programs target single-digit cost reductions to offset inflation.
- Wage Price Index ~3.6% (Mar 2025)
- Brent ~USD 80/bbl (mid-2025)
- Steel ~15% down from 2022 peaks
- Index-linked contracts preserve margin
- Productivity programs target 5-10% savings
Client capex discipline
Majors and utilities increasingly require phased, modular projects with milestone payments, squeezing vendors to accept staged billing and delayed cash flows.
Balance-sheet conservatism among clients narrows approved vendors to low-risk contractors with strong bonds and credit, so demonstrable safety, schedule and cost-control track records directly win awards.
Recurring maintenance and brownfield work provide steadier, higher-margin revenue that smooths earnings volatility for service providers like AJ Lucas.
- Phased modular delivery: reduces upfront capex risk
- Milestone payments: lengthen cash conversion cycles
- Vendor selection: favors low-risk, well-bonded contractors
- Competitive edge: safety + schedule + cost control = contract wins
- Recurring maintenance: stabilizes revenue and margins
NRF A$15bn, LNG ~88 Mtpa, renewables 37% and migration cap 195,000 constrain costs
AJ Lucas revenue and demand track energy prices (Brent ~USD 80/bbl mid‑2025) and commodity cycles, causing 20–40% spot rig rate swings in 2023–24. Higher rates (RBA cash 4.35%, 10yr ~4.2%) lift WACC and delay client sanctioning. FX (GBP/AUD ~1.85 on 1 Jul 2025) and wage inflation (WPI ~3.6% Mar 2025) squeeze margins; hedging, index‑linked contracts and maintenance work partially mitigate volatility.
| Metric | Value |
|---|---|
| Brent | ~USD 80/bbl (mid‑2025) |
| RBA cash | 4.35% (mid‑2025) |
| WPI | 3.6% (Mar 2025) |
| GBP/AUD | ~1.85 (1 Jul 2025) |
What You See Is What You Get
AJ Lucas PESTLE Analysis
The preview shown here is the exact AJ Lucas PESTLE Analysis you’ll receive after purchase—fully formatted and ready to use. It provides a complete review of political, economic, social, technological, legal and environmental factors affecting AJ Lucas with no placeholders or teasers. What you see is the final downloadable file, delivered exactly as displayed upon checkout.

Your Shortcut to Market Insight Starts Here
Discover how political shifts, economic cycles, and technological change are shaping AJ Lucas’s strategic outlook in our concise PESTLE snapshot. This analysis highlights regulatory risks and growth levers you can act on immediately. Purchase the full PESTLE to access the complete, editable report and make informed decisions with confidence.
Political factors
UK shale policy volatility
Cuadrilla’s prospects hinge on UK political stances toward fracking, which have swung from a moratorium after a 2.9 ML seismic event at Preston New Road in 2019 to limited trials since then. Government changes can rapidly alter licensing, planning approvals and operating permissions. Policy uncertainty lengthens valuation timelines and redirects capital allocation. Close monitoring of Whitehall and devolved authorities is essential.
Australian infrastructure priorities
Public investment cycles in Australia, including the A$15 billion National Reconstruction Fund, drive drilling and engineering demand across utilities and transport, with federal and state budgets and election timetables shaping tender pipelines. Recent policy shifts prioritize resilience—flood and bushfire hardening—redirecting capital toward remediation and mitigation projects. AJ Lucas can align drilling and pipeline capabilities with priority corridors to stabilize revenue amid these programmatic shifts.
Energy security agendas
Rising geopolitical tensions reinforce domestic gas supply imperatives for AJ Lucas, especially as Australia’s LNG export capacity sits near 88 Mtpa, creating export versus domestic allocation pressures. Policymakers have signaled support for exploration and storage to cut import risks, unlocking potential funding, faster permitting and strategic partnerships. However, renewables accounted for about 37% of Australia’s electricity in 2023, threatening to crowd out gas-focused initiatives.
Trade and procurement rules
- Local content: tighter supplier pools
- Tariffs: higher equipment costs
- Visas: 195,000 planning level 2023–24
- Transparency: favors incumbents
- Compliance: boosts tender success
Regional community politics
Regional community politics shape AJ Lucas project outcomes as state and local councils control approvals, haulage routes and site operations; in 2024 several NSW council decisions extended approvals timelines for infrastructure projects, increasing oversight and conditional permits. Community-backed representatives have imposed strict conditions or delays on resource projects, while proactive stakeholder engagement has demonstrably reduced legal and social licence risks. Political goodwill lowers disruption costs and can shorten mobilisation windows.
- State/local approvals: high influence on timelines
- Community reps: source of conditional delays
- Engagement: mitigates legal/social risk
- Goodwill: reduces disruption and cost
NRF A$15bn, LNG ~88 Mtpa, renewables 37% and migration cap 195,000 constrain costs
Government program priorities (A$15bn National Reconstruction Fund) and export/domestic gas politics (LNG capacity ~88 Mtpa) drive AJ Lucas demand; renewables 37% (2023) and UK fracking uncertainty lengthen timelines. Tariffs, local‑content rules and migration cap 195,000 (2023–24) affect costs and labour availability.
| Metric | Value |
|---|---|
| NRF | A$15bn |
| LNG cap | ~88 Mtpa |
| Renewables | 37% (2023) |
| Migration | 195,000 (23–24) |
What is included in the product
Detailed Word Document
Explores how Political, Economic, Social, Technological, Environmental and Legal factors uniquely affect AJ Lucas, with data-backed trends and region-specific regulatory context. Designed for executives and investors, it offers forward-looking insights and ready-to-use findings for strategy, risk management and funding pitches.
Customizable Excel Spreadsheet
A concise, visually segmented PESTLE summary for AJ Lucas that can be dropped into presentations, annotated with local context or notes, and easily shared across teams to streamline external risk discussions and strategic planning.
Economic factors
Commodity price cycles
Drilling demand for AJ Lucas closely tracks oil, gas and coal prices—Brent averaged about USD 88/bbl in 2024, Henry Hub ~USD 3/MMBtu and Newcastle thermal coal ~USD 140/t—driving client capex cycles. Price volatility reduces backlog visibility and depresses fleet utilization, with spot rig rates swinging 20–40% in 2023–24. Hedging and flexible contracting can smooth revenue, while diversification across hydrocarbons and minerals buffers downturns.
Interest rates and funding
Higher interest rates (RBA cash rate 4.35% and 10‑yr bond ~4.2% in mid‑2025) lift WACC and depress client project NPVs, delaying sanctioning. Refinancing and equipment leasing have become materially costlier as credit spreads widened versus 2021. Strong cash discipline and staggered maturities reduce refinancing stress, while Australia's sizeable counter‑cyclical infrastructure pipeline helps offset demand slack.
Exchange rate exposure
Revenue and costs in AUD and GBP create translation and transaction exposure; GBP/AUD was about 1.85 on 1 July 2025 (Bloomberg), so sterling swings materially change reported AUD earnings. GBP volatility alters the AUD value of AJ Lucas’s Cuadrilla-related assets and cash flows. Company hedging programs for imported equipment and increased local sourcing provide margin protection and natural hedges.
Labor and input inflation
Tight Australian labour markets pushed wage growth into the mid-3% range (Wage Price Index ~3.6% year to March 2025), lifting subcontractor rates and crew costs for AJ Lucas. Steel and fuel costs remain volatile—Brent crude near USD 80/bbl in mid-2025 and hot-rolled coil ~15% below 2022 peaks—adding input pressure. Index-linked contracts and centralised procurement frameworks have preserved margins while productivity programs target single-digit cost reductions to offset inflation.
- Wage Price Index ~3.6% (Mar 2025)
- Brent ~USD 80/bbl (mid-2025)
- Steel ~15% down from 2022 peaks
- Index-linked contracts preserve margin
- Productivity programs target 5-10% savings
Client capex discipline
Majors and utilities increasingly require phased, modular projects with milestone payments, squeezing vendors to accept staged billing and delayed cash flows.
Balance-sheet conservatism among clients narrows approved vendors to low-risk contractors with strong bonds and credit, so demonstrable safety, schedule and cost-control track records directly win awards.
Recurring maintenance and brownfield work provide steadier, higher-margin revenue that smooths earnings volatility for service providers like AJ Lucas.
- Phased modular delivery: reduces upfront capex risk
- Milestone payments: lengthen cash conversion cycles
- Vendor selection: favors low-risk, well-bonded contractors
- Competitive edge: safety + schedule + cost control = contract wins
- Recurring maintenance: stabilizes revenue and margins
NRF A$15bn, LNG ~88 Mtpa, renewables 37% and migration cap 195,000 constrain costs
AJ Lucas revenue and demand track energy prices (Brent ~USD 80/bbl mid‑2025) and commodity cycles, causing 20–40% spot rig rate swings in 2023–24. Higher rates (RBA cash 4.35%, 10yr ~4.2%) lift WACC and delay client sanctioning. FX (GBP/AUD ~1.85 on 1 Jul 2025) and wage inflation (WPI ~3.6% Mar 2025) squeeze margins; hedging, index‑linked contracts and maintenance work partially mitigate volatility.
| Metric | Value |
|---|---|
| Brent | ~USD 80/bbl (mid‑2025) |
| RBA cash | 4.35% (mid‑2025) |
| WPI | 3.6% (Mar 2025) |
| GBP/AUD | ~1.85 (1 Jul 2025) |
What You See Is What You Get
AJ Lucas PESTLE Analysis
The preview shown here is the exact AJ Lucas PESTLE Analysis you’ll receive after purchase—fully formatted and ready to use. It provides a complete review of political, economic, social, technological, legal and environmental factors affecting AJ Lucas with no placeholders or teasers. What you see is the final downloadable file, delivered exactly as displayed upon checkout.
Original: $10.00
-65%$10.00
$3.50Description
Your Shortcut to Market Insight Starts Here
Discover how political shifts, economic cycles, and technological change are shaping AJ Lucas’s strategic outlook in our concise PESTLE snapshot. This analysis highlights regulatory risks and growth levers you can act on immediately. Purchase the full PESTLE to access the complete, editable report and make informed decisions with confidence.
Political factors
UK shale policy volatility
Cuadrilla’s prospects hinge on UK political stances toward fracking, which have swung from a moratorium after a 2.9 ML seismic event at Preston New Road in 2019 to limited trials since then. Government changes can rapidly alter licensing, planning approvals and operating permissions. Policy uncertainty lengthens valuation timelines and redirects capital allocation. Close monitoring of Whitehall and devolved authorities is essential.
Australian infrastructure priorities
Public investment cycles in Australia, including the A$15 billion National Reconstruction Fund, drive drilling and engineering demand across utilities and transport, with federal and state budgets and election timetables shaping tender pipelines. Recent policy shifts prioritize resilience—flood and bushfire hardening—redirecting capital toward remediation and mitigation projects. AJ Lucas can align drilling and pipeline capabilities with priority corridors to stabilize revenue amid these programmatic shifts.
Energy security agendas
Rising geopolitical tensions reinforce domestic gas supply imperatives for AJ Lucas, especially as Australia’s LNG export capacity sits near 88 Mtpa, creating export versus domestic allocation pressures. Policymakers have signaled support for exploration and storage to cut import risks, unlocking potential funding, faster permitting and strategic partnerships. However, renewables accounted for about 37% of Australia’s electricity in 2023, threatening to crowd out gas-focused initiatives.
Trade and procurement rules
- Local content: tighter supplier pools
- Tariffs: higher equipment costs
- Visas: 195,000 planning level 2023–24
- Transparency: favors incumbents
- Compliance: boosts tender success
Regional community politics
Regional community politics shape AJ Lucas project outcomes as state and local councils control approvals, haulage routes and site operations; in 2024 several NSW council decisions extended approvals timelines for infrastructure projects, increasing oversight and conditional permits. Community-backed representatives have imposed strict conditions or delays on resource projects, while proactive stakeholder engagement has demonstrably reduced legal and social licence risks. Political goodwill lowers disruption costs and can shorten mobilisation windows.
- State/local approvals: high influence on timelines
- Community reps: source of conditional delays
- Engagement: mitigates legal/social risk
- Goodwill: reduces disruption and cost
NRF A$15bn, LNG ~88 Mtpa, renewables 37% and migration cap 195,000 constrain costs
Government program priorities (A$15bn National Reconstruction Fund) and export/domestic gas politics (LNG capacity ~88 Mtpa) drive AJ Lucas demand; renewables 37% (2023) and UK fracking uncertainty lengthen timelines. Tariffs, local‑content rules and migration cap 195,000 (2023–24) affect costs and labour availability.
| Metric | Value |
|---|---|
| NRF | A$15bn |
| LNG cap | ~88 Mtpa |
| Renewables | 37% (2023) |
| Migration | 195,000 (23–24) |
What is included in the product
Detailed Word Document
Explores how Political, Economic, Social, Technological, Environmental and Legal factors uniquely affect AJ Lucas, with data-backed trends and region-specific regulatory context. Designed for executives and investors, it offers forward-looking insights and ready-to-use findings for strategy, risk management and funding pitches.
Customizable Excel Spreadsheet
A concise, visually segmented PESTLE summary for AJ Lucas that can be dropped into presentations, annotated with local context or notes, and easily shared across teams to streamline external risk discussions and strategic planning.
Economic factors
Commodity price cycles
Drilling demand for AJ Lucas closely tracks oil, gas and coal prices—Brent averaged about USD 88/bbl in 2024, Henry Hub ~USD 3/MMBtu and Newcastle thermal coal ~USD 140/t—driving client capex cycles. Price volatility reduces backlog visibility and depresses fleet utilization, with spot rig rates swinging 20–40% in 2023–24. Hedging and flexible contracting can smooth revenue, while diversification across hydrocarbons and minerals buffers downturns.
Interest rates and funding
Higher interest rates (RBA cash rate 4.35% and 10‑yr bond ~4.2% in mid‑2025) lift WACC and depress client project NPVs, delaying sanctioning. Refinancing and equipment leasing have become materially costlier as credit spreads widened versus 2021. Strong cash discipline and staggered maturities reduce refinancing stress, while Australia's sizeable counter‑cyclical infrastructure pipeline helps offset demand slack.
Exchange rate exposure
Revenue and costs in AUD and GBP create translation and transaction exposure; GBP/AUD was about 1.85 on 1 July 2025 (Bloomberg), so sterling swings materially change reported AUD earnings. GBP volatility alters the AUD value of AJ Lucas’s Cuadrilla-related assets and cash flows. Company hedging programs for imported equipment and increased local sourcing provide margin protection and natural hedges.
Labor and input inflation
Tight Australian labour markets pushed wage growth into the mid-3% range (Wage Price Index ~3.6% year to March 2025), lifting subcontractor rates and crew costs for AJ Lucas. Steel and fuel costs remain volatile—Brent crude near USD 80/bbl in mid-2025 and hot-rolled coil ~15% below 2022 peaks—adding input pressure. Index-linked contracts and centralised procurement frameworks have preserved margins while productivity programs target single-digit cost reductions to offset inflation.
- Wage Price Index ~3.6% (Mar 2025)
- Brent ~USD 80/bbl (mid-2025)
- Steel ~15% down from 2022 peaks
- Index-linked contracts preserve margin
- Productivity programs target 5-10% savings
Client capex discipline
Majors and utilities increasingly require phased, modular projects with milestone payments, squeezing vendors to accept staged billing and delayed cash flows.
Balance-sheet conservatism among clients narrows approved vendors to low-risk contractors with strong bonds and credit, so demonstrable safety, schedule and cost-control track records directly win awards.
Recurring maintenance and brownfield work provide steadier, higher-margin revenue that smooths earnings volatility for service providers like AJ Lucas.
- Phased modular delivery: reduces upfront capex risk
- Milestone payments: lengthen cash conversion cycles
- Vendor selection: favors low-risk, well-bonded contractors
- Competitive edge: safety + schedule + cost control = contract wins
- Recurring maintenance: stabilizes revenue and margins
NRF A$15bn, LNG ~88 Mtpa, renewables 37% and migration cap 195,000 constrain costs
AJ Lucas revenue and demand track energy prices (Brent ~USD 80/bbl mid‑2025) and commodity cycles, causing 20–40% spot rig rate swings in 2023–24. Higher rates (RBA cash 4.35%, 10yr ~4.2%) lift WACC and delay client sanctioning. FX (GBP/AUD ~1.85 on 1 Jul 2025) and wage inflation (WPI ~3.6% Mar 2025) squeeze margins; hedging, index‑linked contracts and maintenance work partially mitigate volatility.
| Metric | Value |
|---|---|
| Brent | ~USD 80/bbl (mid‑2025) |
| RBA cash | 4.35% (mid‑2025) |
| WPI | 3.6% (Mar 2025) |
| GBP/AUD | ~1.85 (1 Jul 2025) |
What You See Is What You Get
AJ Lucas PESTLE Analysis
The preview shown here is the exact AJ Lucas PESTLE Analysis you’ll receive after purchase—fully formatted and ready to use. It provides a complete review of political, economic, social, technological, legal and environmental factors affecting AJ Lucas with no placeholders or teasers. What you see is the final downloadable file, delivered exactly as displayed upon checkout.











