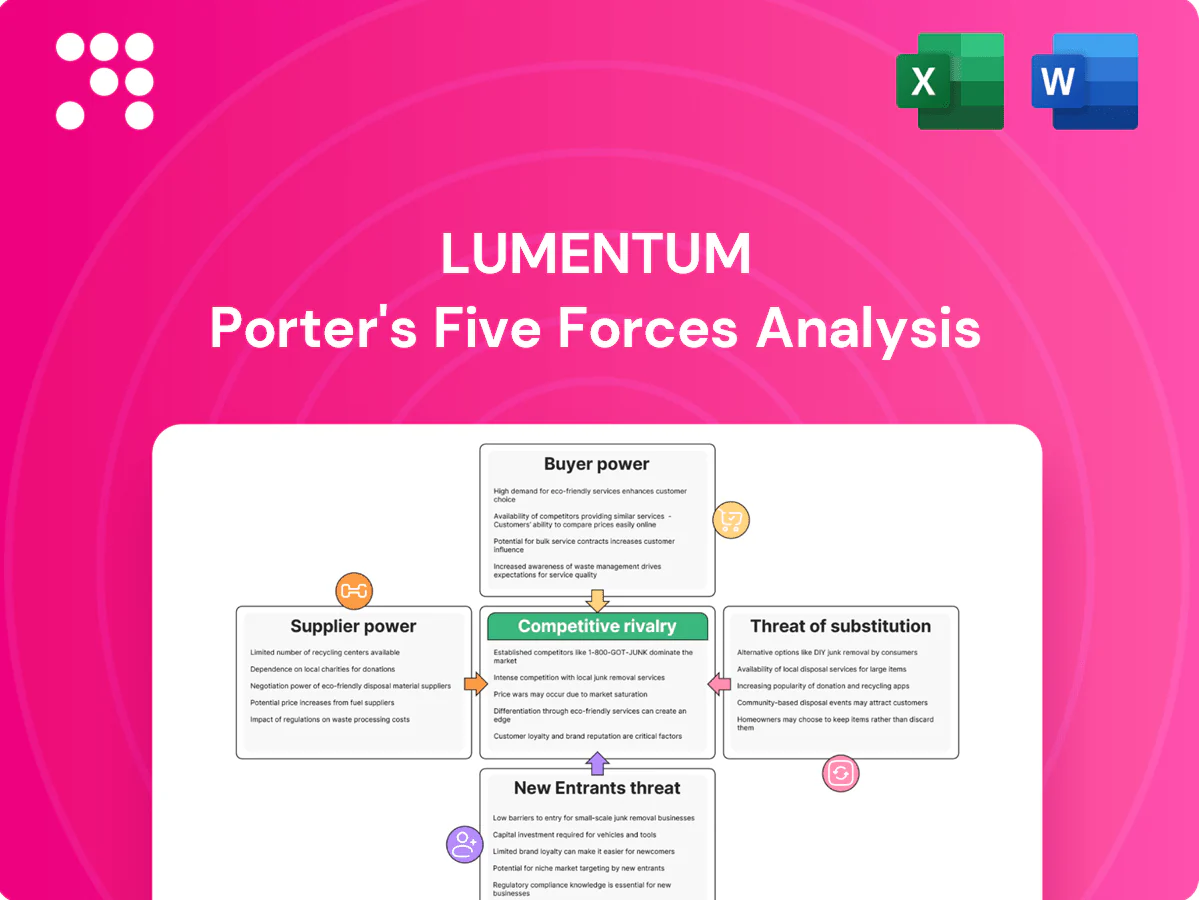
Lumentum Porter's Five Forces Analysis

Elevate Your Analysis with the Complete Porter's Five Forces Analysis
Lumentum faces intense rivalry, shifting buyer power, and supplier concentration that shape its optical components market; barriers to entry are moderate while substitutes and technological shifts pose evolving threats. This snapshot highlights key tensions but omits force-by-force ratings and visuals. Unlock the full Porter's Five Forces Analysis to get a complete, actionable strategic breakdown tailored to Lumentum.
Suppliers Bargaining Power

Specialty materials concentration
Core inputs like InP, GaAs, rare-earth dopants and precision optics come from a handful of qualified suppliers, concentrating supply risk. China accounted for roughly 60% of rare-earth processing in 2024, magnifying geopolitical and supply disruptions. Concentration raises switching costs and lead-time risk for Lumentum and can compress margins and delivery schedules if prices spike. Dual-sourcing is feasible but typically requires 9–18 months of qualification.
Equipment and process lock-in
Capital tools like MOCVD reactors ($5–15M), advanced lithography and wafer-test systems are vendor-specific, and OEM-tied process recipes create strong equipment and process lock-in for Lumentum. Replacement or requalification typically requires 3–9 months and multimillion-dollar qualification runs, making swaps costly and slow. During 2021–2024 capacity-tightness cycles suppliers have commanded premiums and leverage as utilization exceeded ~80% in key tool segments.

Quality/traceability requirements
Telco-grade reliability demands tight traceability and lot consistency, with GR-468 and similar standards driving lot-level documentation and failure-rate targets; this reduces eligible suppliers and increases supplier bargaining power. Lumentum reported FY2024 revenue of about $1.7 billion and mitigates risk through stringent SLAs and rigorous incoming inspection protocols.

Geopolitical/export constraints
Geopolitical export controls expanded in 2023–2024 to cover advanced photonics and related equipment, constraining materials and equipment flows and forcing suppliers to seek licenses; US tariffs on roughly $360 billion of Chinese goods since 2018 further tighten sourcing. Restrictions reduce available suppliers and shift terms unfavorably, while permit requirements stretch lead times and diversification raises cost and complexity.
- Export controls: 2023–2024 expansion
- Tariffs: ~$360 billion impacted
- Effect: fewer suppliers, worse terms
- Operational: longer lead times, higher diversification cost
Scale vs. counter-leverage
Lumentum’s production scale and aggressive technical roadmaps give it measurable counter-leverage with suppliers, and long-term supply agreements in 2024 helped stabilize pricing and allocation amid market volatility. Specialty optical and wafer inputs continue to command premiums, and bargaining power shifts with industry cycles and wafer availability.
China ~60% rare-earths & MOCVD lock-in $5–15M
Supplier power is high: core inputs concentrated (China ~60% of rare-earth processing in 2024) and specialty optics/wafer inputs carry premiums. Equipment lock-in (MOCVD $5–15M) and >80% utilization in key tool segments (2021–2024) raise switching costs. Lumentum (FY2024 rev ~$1.7B) offsets risk with long-term contracts but bargaining swings with wafer availability and export controls.
| Metric | Value |
|---|---|
| China rare-earth processing (2024) | ~60% |
| FY2024 revenue | $1.7B |
| MOCVD cost | $5–15M |
| Tool utilization (2021–24) | >80% |
| Tariffs since 2018 | ~$360B |
What is included in the product
 Detailed Word Document
Tailored Porter's Five Forces for Lumentum that uncovers key competitive drivers, supplier and buyer power, substitutes and disruptive threats, and barriers protecting its market position.

 Customizable Excel Spreadsheet
A concise one-sheet Porter’s Five Forces for Lumentum that visualizes competitive pressure with an editable spider chart, ready to drop into decks; customize inputs, scenarios, and labels without macros to simplify boardroom decisions and integrate into broader reports.
Customers Bargaining Power

Customer concentration
Tier-1 OEMs, hyperscalers and carriers drive a large share of Lumentum demand, with FY2024 revenue about $1.9B and the top customers historically accounting for a concentrated portion of sales, giving buyers pricing influence and tougher contract terms. High concentration means loss of a single program can materially impact revenue and margins. Diversification across telecom, datacom and lasers mitigates but does not eliminate this customer-risk exposure.
Qualification and switching
Components require lengthy qualification and interoperability testing, commonly taking 6–12 months for optical modules in telecom. Once qualified, buyers frequently push for multi-sourcing, often splitting volumes so no single supplier exceeds ~50% share to mitigate supply risk. Switching costs for system integrators are moderate to high due to integration and recertification. This drives price pressure at renewal while limiting abrupt exits.

Price erosion norms
Optics markets exhibit routine annual price erosion tied to technology cost curves, with industry trackers (LightCounting/Omdia) reporting typical ASP declines of about 5–12% yearly. Buyers push step-downs and formal value-engineering roadmaps into contracts, driving predictable roadmap-based concessions. ASP compression is most acute in high-volume datacom, where declines can reach ~15% in peak segments, so Lumentum must offset erosion through measurable performance or integration-led differentiation.

Customization leverage
Design-in work and custom specs deepen buyer engagement but increase customer leverage as Lumentum absorbs NRE and aligns to co-development timelines; Lumentum reported FY2024 revenue of $1.88 billion, highlighting scale but also concentration risk. Buyers can push for IP rights or exclusivity, squeezing terms; margins therefore hinge on differentiated, hard-to-replicate performance features.
- Design-in lock: NRE/co-dev exposure
- IP/exclusivity risk: contract leverage
- Margin driver: unique performance premium
Performance and SLA demands
Strict SLAs on yield, reliability and delivery shift risk to Lumentum, with FY2024 revenue of $1.58 billion placing outsized exposure on a few large buyers. Penalties and expedited logistics in 2024 cases compressed margins on short-cycle orders. Forecast volatility from hyperscalers strained capacity planning, while consignment and VMI terms further favor large customers.
- Risk shift: SLAs raise supplier liability
- Margin pressure: penalties + expedited logistics
- Volatility: hyperscaler forecasting strain
- Buyer leverage: consignment/VMI favors large buyers
Concentrated Tier-1 demand compresses margins; FY2024 revenue $1.88B
Large Tier-1 OEMs, hyperscalers and carriers (FY2024 revenue context $1.88B) drive concentrated demand, giving buyers strong pricing and contract leverage. Qualification times (6–12 months) and design-in NRE increase switching costs yet deepen customer bargaining power. Annual ASP erosion of ~5–12% (up to ~15% in peak datacom) and strict SLAs/penalties further compress margins.
| Metric | Value |
|---|---|
| FY2024 revenue | $1.88B |
| Qualification time | 6–12 months |
| ASP decline | 5–12% (datacom up to 15%) |
| Customer concentration | High; buyers hold pricing leverage |
Same Document Delivered
Lumentum Porter's Five Forces Analysis
This preview shows the exact Lumentum Porter’s Five Forces analysis you’ll receive immediately after purchase—no surprises or placeholders. The document displayed is fully formatted, professionally written, and ready for download the moment you buy. You’re viewing the final file you’ll get.

Elevate Your Analysis with the Complete Porter's Five Forces Analysis
Lumentum faces intense rivalry, shifting buyer power, and supplier concentration that shape its optical components market; barriers to entry are moderate while substitutes and technological shifts pose evolving threats. This snapshot highlights key tensions but omits force-by-force ratings and visuals. Unlock the full Porter's Five Forces Analysis to get a complete, actionable strategic breakdown tailored to Lumentum.
Suppliers Bargaining Power
Specialty materials concentration
Core inputs like InP, GaAs, rare-earth dopants and precision optics come from a handful of qualified suppliers, concentrating supply risk. China accounted for roughly 60% of rare-earth processing in 2024, magnifying geopolitical and supply disruptions. Concentration raises switching costs and lead-time risk for Lumentum and can compress margins and delivery schedules if prices spike. Dual-sourcing is feasible but typically requires 9–18 months of qualification.
Equipment and process lock-in
Capital tools like MOCVD reactors ($5–15M), advanced lithography and wafer-test systems are vendor-specific, and OEM-tied process recipes create strong equipment and process lock-in for Lumentum. Replacement or requalification typically requires 3–9 months and multimillion-dollar qualification runs, making swaps costly and slow. During 2021–2024 capacity-tightness cycles suppliers have commanded premiums and leverage as utilization exceeded ~80% in key tool segments.
Quality/traceability requirements
Telco-grade reliability demands tight traceability and lot consistency, with GR-468 and similar standards driving lot-level documentation and failure-rate targets; this reduces eligible suppliers and increases supplier bargaining power. Lumentum reported FY2024 revenue of about $1.7 billion and mitigates risk through stringent SLAs and rigorous incoming inspection protocols.
Geopolitical/export constraints
Geopolitical export controls expanded in 2023–2024 to cover advanced photonics and related equipment, constraining materials and equipment flows and forcing suppliers to seek licenses; US tariffs on roughly $360 billion of Chinese goods since 2018 further tighten sourcing. Restrictions reduce available suppliers and shift terms unfavorably, while permit requirements stretch lead times and diversification raises cost and complexity.
- Export controls: 2023–2024 expansion
- Tariffs: ~$360 billion impacted
- Effect: fewer suppliers, worse terms
- Operational: longer lead times, higher diversification cost
Scale vs. counter-leverage
Lumentum’s production scale and aggressive technical roadmaps give it measurable counter-leverage with suppliers, and long-term supply agreements in 2024 helped stabilize pricing and allocation amid market volatility. Specialty optical and wafer inputs continue to command premiums, and bargaining power shifts with industry cycles and wafer availability.
China ~60% rare-earths & MOCVD lock-in $5–15M
Supplier power is high: core inputs concentrated (China ~60% of rare-earth processing in 2024) and specialty optics/wafer inputs carry premiums. Equipment lock-in (MOCVD $5–15M) and >80% utilization in key tool segments (2021–2024) raise switching costs. Lumentum (FY2024 rev ~$1.7B) offsets risk with long-term contracts but bargaining swings with wafer availability and export controls.
| Metric | Value |
|---|---|
| China rare-earth processing (2024) | ~60% |
| FY2024 revenue | $1.7B |
| MOCVD cost | $5–15M |
| Tool utilization (2021–24) | >80% |
| Tariffs since 2018 | ~$360B |
What is included in the product
Detailed Word Document
Tailored Porter's Five Forces for Lumentum that uncovers key competitive drivers, supplier and buyer power, substitutes and disruptive threats, and barriers protecting its market position.
Customizable Excel Spreadsheet
A concise one-sheet Porter’s Five Forces for Lumentum that visualizes competitive pressure with an editable spider chart, ready to drop into decks; customize inputs, scenarios, and labels without macros to simplify boardroom decisions and integrate into broader reports.
Customers Bargaining Power
Customer concentration
Tier-1 OEMs, hyperscalers and carriers drive a large share of Lumentum demand, with FY2024 revenue about $1.9B and the top customers historically accounting for a concentrated portion of sales, giving buyers pricing influence and tougher contract terms. High concentration means loss of a single program can materially impact revenue and margins. Diversification across telecom, datacom and lasers mitigates but does not eliminate this customer-risk exposure.
Qualification and switching
Components require lengthy qualification and interoperability testing, commonly taking 6–12 months for optical modules in telecom. Once qualified, buyers frequently push for multi-sourcing, often splitting volumes so no single supplier exceeds ~50% share to mitigate supply risk. Switching costs for system integrators are moderate to high due to integration and recertification. This drives price pressure at renewal while limiting abrupt exits.
Price erosion norms
Optics markets exhibit routine annual price erosion tied to technology cost curves, with industry trackers (LightCounting/Omdia) reporting typical ASP declines of about 5–12% yearly. Buyers push step-downs and formal value-engineering roadmaps into contracts, driving predictable roadmap-based concessions. ASP compression is most acute in high-volume datacom, where declines can reach ~15% in peak segments, so Lumentum must offset erosion through measurable performance or integration-led differentiation.
Customization leverage
Design-in work and custom specs deepen buyer engagement but increase customer leverage as Lumentum absorbs NRE and aligns to co-development timelines; Lumentum reported FY2024 revenue of $1.88 billion, highlighting scale but also concentration risk. Buyers can push for IP rights or exclusivity, squeezing terms; margins therefore hinge on differentiated, hard-to-replicate performance features.
- Design-in lock: NRE/co-dev exposure
- IP/exclusivity risk: contract leverage
- Margin driver: unique performance premium
Performance and SLA demands
Strict SLAs on yield, reliability and delivery shift risk to Lumentum, with FY2024 revenue of $1.58 billion placing outsized exposure on a few large buyers. Penalties and expedited logistics in 2024 cases compressed margins on short-cycle orders. Forecast volatility from hyperscalers strained capacity planning, while consignment and VMI terms further favor large customers.
- Risk shift: SLAs raise supplier liability
- Margin pressure: penalties + expedited logistics
- Volatility: hyperscaler forecasting strain
- Buyer leverage: consignment/VMI favors large buyers
Concentrated Tier-1 demand compresses margins; FY2024 revenue $1.88B
Large Tier-1 OEMs, hyperscalers and carriers (FY2024 revenue context $1.88B) drive concentrated demand, giving buyers strong pricing and contract leverage. Qualification times (6–12 months) and design-in NRE increase switching costs yet deepen customer bargaining power. Annual ASP erosion of ~5–12% (up to ~15% in peak datacom) and strict SLAs/penalties further compress margins.
| Metric | Value |
|---|---|
| FY2024 revenue | $1.88B |
| Qualification time | 6–12 months |
| ASP decline | 5–12% (datacom up to 15%) |
| Customer concentration | High; buyers hold pricing leverage |
Same Document Delivered
Lumentum Porter's Five Forces Analysis
This preview shows the exact Lumentum Porter’s Five Forces analysis you’ll receive immediately after purchase—no surprises or placeholders. The document displayed is fully formatted, professionally written, and ready for download the moment you buy. You’re viewing the final file you’ll get.
Description
Elevate Your Analysis with the Complete Porter's Five Forces Analysis
Lumentum faces intense rivalry, shifting buyer power, and supplier concentration that shape its optical components market; barriers to entry are moderate while substitutes and technological shifts pose evolving threats. This snapshot highlights key tensions but omits force-by-force ratings and visuals. Unlock the full Porter's Five Forces Analysis to get a complete, actionable strategic breakdown tailored to Lumentum.
Suppliers Bargaining Power
Specialty materials concentration
Core inputs like InP, GaAs, rare-earth dopants and precision optics come from a handful of qualified suppliers, concentrating supply risk. China accounted for roughly 60% of rare-earth processing in 2024, magnifying geopolitical and supply disruptions. Concentration raises switching costs and lead-time risk for Lumentum and can compress margins and delivery schedules if prices spike. Dual-sourcing is feasible but typically requires 9–18 months of qualification.
Equipment and process lock-in
Capital tools like MOCVD reactors ($5–15M), advanced lithography and wafer-test systems are vendor-specific, and OEM-tied process recipes create strong equipment and process lock-in for Lumentum. Replacement or requalification typically requires 3–9 months and multimillion-dollar qualification runs, making swaps costly and slow. During 2021–2024 capacity-tightness cycles suppliers have commanded premiums and leverage as utilization exceeded ~80% in key tool segments.
Quality/traceability requirements
Telco-grade reliability demands tight traceability and lot consistency, with GR-468 and similar standards driving lot-level documentation and failure-rate targets; this reduces eligible suppliers and increases supplier bargaining power. Lumentum reported FY2024 revenue of about $1.7 billion and mitigates risk through stringent SLAs and rigorous incoming inspection protocols.
Geopolitical/export constraints
Geopolitical export controls expanded in 2023–2024 to cover advanced photonics and related equipment, constraining materials and equipment flows and forcing suppliers to seek licenses; US tariffs on roughly $360 billion of Chinese goods since 2018 further tighten sourcing. Restrictions reduce available suppliers and shift terms unfavorably, while permit requirements stretch lead times and diversification raises cost and complexity.
- Export controls: 2023–2024 expansion
- Tariffs: ~$360 billion impacted
- Effect: fewer suppliers, worse terms
- Operational: longer lead times, higher diversification cost
Scale vs. counter-leverage
Lumentum’s production scale and aggressive technical roadmaps give it measurable counter-leverage with suppliers, and long-term supply agreements in 2024 helped stabilize pricing and allocation amid market volatility. Specialty optical and wafer inputs continue to command premiums, and bargaining power shifts with industry cycles and wafer availability.
China ~60% rare-earths & MOCVD lock-in $5–15M
Supplier power is high: core inputs concentrated (China ~60% of rare-earth processing in 2024) and specialty optics/wafer inputs carry premiums. Equipment lock-in (MOCVD $5–15M) and >80% utilization in key tool segments (2021–2024) raise switching costs. Lumentum (FY2024 rev ~$1.7B) offsets risk with long-term contracts but bargaining swings with wafer availability and export controls.
| Metric | Value |
|---|---|
| China rare-earth processing (2024) | ~60% |
| FY2024 revenue | $1.7B |
| MOCVD cost | $5–15M |
| Tool utilization (2021–24) | >80% |
| Tariffs since 2018 | ~$360B |
What is included in the product
Detailed Word Document
Tailored Porter's Five Forces for Lumentum that uncovers key competitive drivers, supplier and buyer power, substitutes and disruptive threats, and barriers protecting its market position.
Customizable Excel Spreadsheet
A concise one-sheet Porter’s Five Forces for Lumentum that visualizes competitive pressure with an editable spider chart, ready to drop into decks; customize inputs, scenarios, and labels without macros to simplify boardroom decisions and integrate into broader reports.
Customers Bargaining Power
Customer concentration
Tier-1 OEMs, hyperscalers and carriers drive a large share of Lumentum demand, with FY2024 revenue about $1.9B and the top customers historically accounting for a concentrated portion of sales, giving buyers pricing influence and tougher contract terms. High concentration means loss of a single program can materially impact revenue and margins. Diversification across telecom, datacom and lasers mitigates but does not eliminate this customer-risk exposure.
Qualification and switching
Components require lengthy qualification and interoperability testing, commonly taking 6–12 months for optical modules in telecom. Once qualified, buyers frequently push for multi-sourcing, often splitting volumes so no single supplier exceeds ~50% share to mitigate supply risk. Switching costs for system integrators are moderate to high due to integration and recertification. This drives price pressure at renewal while limiting abrupt exits.
Price erosion norms
Optics markets exhibit routine annual price erosion tied to technology cost curves, with industry trackers (LightCounting/Omdia) reporting typical ASP declines of about 5–12% yearly. Buyers push step-downs and formal value-engineering roadmaps into contracts, driving predictable roadmap-based concessions. ASP compression is most acute in high-volume datacom, where declines can reach ~15% in peak segments, so Lumentum must offset erosion through measurable performance or integration-led differentiation.
Customization leverage
Design-in work and custom specs deepen buyer engagement but increase customer leverage as Lumentum absorbs NRE and aligns to co-development timelines; Lumentum reported FY2024 revenue of $1.88 billion, highlighting scale but also concentration risk. Buyers can push for IP rights or exclusivity, squeezing terms; margins therefore hinge on differentiated, hard-to-replicate performance features.
- Design-in lock: NRE/co-dev exposure
- IP/exclusivity risk: contract leverage
- Margin driver: unique performance premium
Performance and SLA demands
Strict SLAs on yield, reliability and delivery shift risk to Lumentum, with FY2024 revenue of $1.58 billion placing outsized exposure on a few large buyers. Penalties and expedited logistics in 2024 cases compressed margins on short-cycle orders. Forecast volatility from hyperscalers strained capacity planning, while consignment and VMI terms further favor large customers.
- Risk shift: SLAs raise supplier liability
- Margin pressure: penalties + expedited logistics
- Volatility: hyperscaler forecasting strain
- Buyer leverage: consignment/VMI favors large buyers
Concentrated Tier-1 demand compresses margins; FY2024 revenue $1.88B
Large Tier-1 OEMs, hyperscalers and carriers (FY2024 revenue context $1.88B) drive concentrated demand, giving buyers strong pricing and contract leverage. Qualification times (6–12 months) and design-in NRE increase switching costs yet deepen customer bargaining power. Annual ASP erosion of ~5–12% (up to ~15% in peak datacom) and strict SLAs/penalties further compress margins.
| Metric | Value |
|---|---|
| FY2024 revenue | $1.88B |
| Qualification time | 6–12 months |
| ASP decline | 5–12% (datacom up to 15%) |
| Customer concentration | High; buyers hold pricing leverage |
Same Document Delivered
Lumentum Porter's Five Forces Analysis
This preview shows the exact Lumentum Porter’s Five Forces analysis you’ll receive immediately after purchase—no surprises or placeholders. The document displayed is fully formatted, professionally written, and ready for download the moment you buy. You’re viewing the final file you’ll get.











