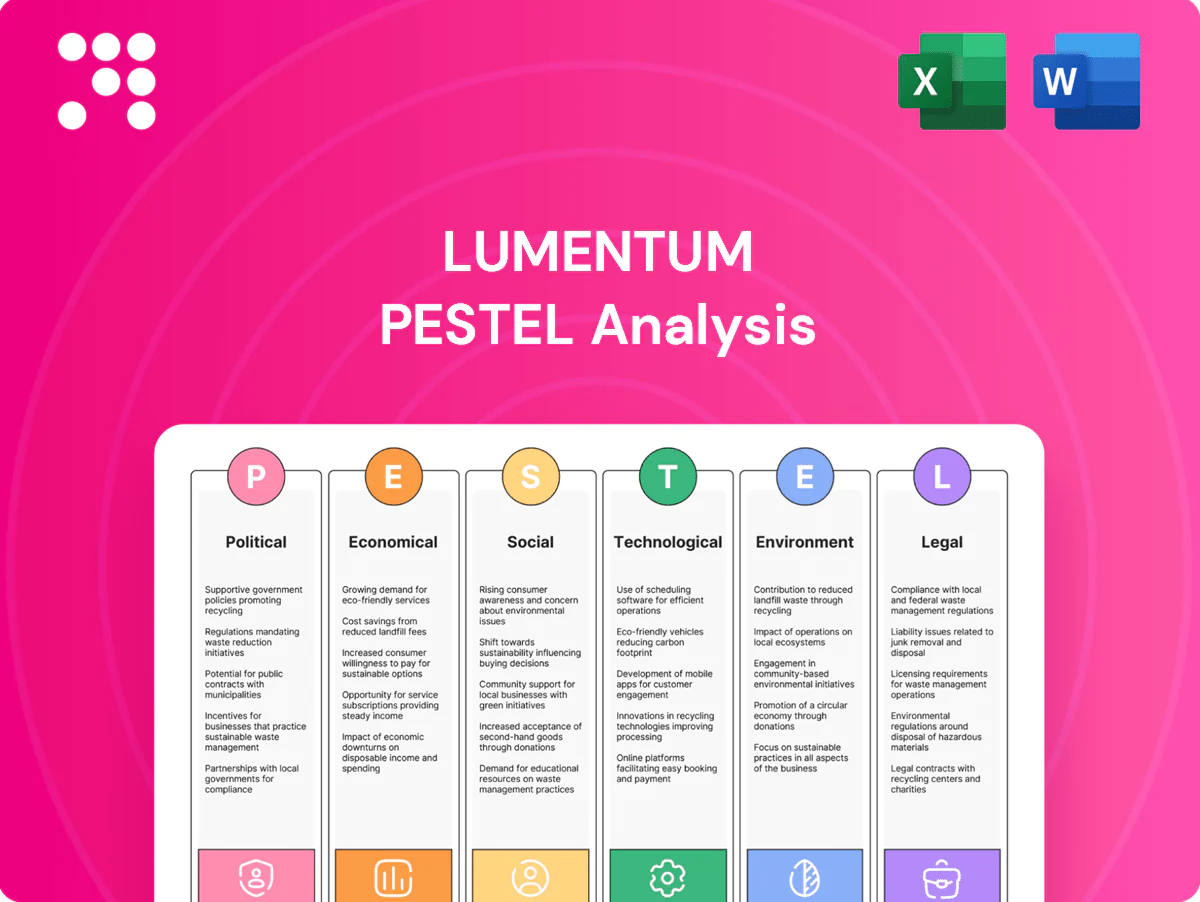
Lumentum PESTLE Analysis

Your Competitive Advantage Starts with This Report
Our PESTLE Analysis distills the political, economic, social, technological, legal, and environmental forces shaping Lumentum’s trajectory into actionable insights. Perfect for investors and strategists, it reveals risks and growth levers you won’t find in headlines. Buy the full, editable report now to inform smarter decisions and stay ahead.
Political factors

US–China tech tensions
US export controls on advanced optics and lasers limit Lumentum sales into China’s telecom and industrial sectors, forcing product segmentation to meet licensing rules while retaining competitiveness. License requirements add lead time and booking uncertainty and can require case-by-case approvals. Sudden US policy shifts have historically triggered customer demand pauses or pull-ins, disrupting revenue visibility. Compliance costs and roadmap delays increase operational risk.
Trade tariffs and localization
Tariffs on components and finished goods, often ranging 7.5–25% under recent US/China measures, raise input costs or force price concessions for suppliers like Lumentum.
Governments increasingly incentivize local manufacturing, with local‑content thresholds commonly 30–60%, reshaping footprint and partner decisions.
Diversifying assembly and test geographies reduces political concentration risk; many tech firms moved 20–30% capacity outside China since 2020.
Localization can unlock public‑sector contracts but increases operating complexity, capex and supply‑chain management burden.

Government network investment
Public broadband and 5G funding—notably the US IIJA’s $65B broadband package including $42.45B BEAD—boost optical demand, but country-by-country timing creates uneven multi-year order pipelines.
State-backed vendor qualification can be a strategic wedge for Lumentum to secure long-term buildouts.
Shifts in administration priorities may reallocate funds across regions and technologies, altering revenue timing and mix.

Allied export alignment
US, EU, UK, Japan and the Netherlands have increasingly synchronized controls on sensitive photonics since 2022, meaning restrictions on Lumentum products can apply across major markets simultaneously. Coordinated measures amplify commercial impact and force continuously updated, multi-jurisdictional compliance programs. Regulatory missteps expose firms to civil/criminal penalties, export debarment and material reputational damage.
- Scope: coordinated controls across US/EU/UK/JP/NL
- Compliance: multi-jurisdictional, dynamic
- Risk: fines, debarment, reputational harm
Standards and spectrum policy
- ETSI/3GPP/ITU governance
- US C‑band $80.9B
- Regulatory clarity → faster optics uptake
- Policy lag → delayed deployments/revenue
Export controls curb China access, raising compliance costs; US/EU/JP/UK demand timing shifts optics
US/EU/UK/JP/NL coordinated export controls since 2022 constrain Lumentum access to China, raising compliance costs and booking uncertainty. IIJA/BEAD ($65B/$42.45B) and C‑band auctions ($80.9B) drive optical demand but timing shifts alter revenue. 20–30% supplier reshoring since 2020 raises capex and supply complexity.
| Item | Value |
|---|---|
| BEAD | $42.45B |
| IIJA | $65B |
| C‑band | $80.9B |
| Reshoring | 20–30% |
What is included in the product
 Detailed Word Document
Explores how macro-environmental forces uniquely affect Lumentum across Political, Economic, Social, Technological, Environmental, and Legal dimensions, with data-backed trends and industry-specific examples. Designed for executives and investors to identify risks, opportunities, and actionable, forward-looking strategies.

 Customizable Excel Spreadsheet
A concise, visually segmented PESTLE summary of Lumentum that’s easily droppable into presentations and shareable across teams for quick alignment and risk discussion, with editable notes to adapt insights by region or product line.
Economic factors

Capex cycles in telecom/datacom
Carrier and hyperscaler spending drives optics demand volatility; top cloud providers invested over $90 billion in data-center capex in 2023, making their buildouts a primary swing factor for Lumentum’s markets. Inventory-digestion phases have historically compressed OEM orders even as end-traffic grows, sometimes reducing quarterly orders by double-digit percentages. Forecast accuracy hinges on visibility into cloud and AI buildouts and contract timing. Diversified end-markets (5G, enterprise, cloud) buffer but do not eliminate cyclicality.
ASP pressure and mix
Competition and rapid node transitions compress ASPs—industry ASPs have fallen roughly 10–15% year-over-year in key photonics segments—while Lumentum pushes higher-speed coherent and 3D sensing modules that command premium pricing and can lift product mix and gross margins by low-to-mid hundreds of basis points. Cost roadmaps in lasers and components must outpace these price declines to protect margins. Customer concentration amplifies pricing pressure during negotiations, given top customers account for over 40% of revenue in recent quarters.

Currency and global footprint
Lumentum’s multi-currency revenue and cost base exposes earnings to FX swings, with significant sales in Asia and Europe amplifying translation and transaction risk; FY2024 revenue was about $1.67 billion, increasing sensitivity to USD movements. Hedging programs partially mitigate volatility but cannot fully neutralize sudden currency moves. Global sourcing and diversified manufacturing footprint improve cost-base resilience, yet manufacturing slowdowns—reflected in weaker global PMIs in 2024—reduce commercial laser demand.

Interest rates and capital access
Higher interest rates (Fed funds ~5.25–5.50% mid‑2025) dampen customer capex and increase Lumentum’s financing costs, pushing network upgrade ROIs above historical thresholds and delaying purchases; working capital strains rise as component lead times remain extended (≈12–20 weeks), raising inventory and receivables needs.
- Higher rates: tighter capex, higher financing
- ROI hurdle: stricter project approvals
- Working capital: longer lead times, more inventory
- Lower rates: could spur consolidation and capacity investment
M&A and industry consolidation
Consolidation among component suppliers and large customers has reshaped bargaining power in Lumentum's optical components markets, increasing pressure on margins and supplier selection. Greater scale from consolidators can enhance procurement discounts and R&D leverage, but integration risk can distract management and delay projected synergies. To mitigate supplier concentration, key customers increasingly dual-source critical modules.
- Consolidation shifts bargaining power
- Scale improves procurement and R&D leverage
- Integration risk delays synergies
- Customers dual-source to reduce supplier concentration
Export controls curb China access, raising compliance costs; US/EU/JP/UK demand timing shifts optics
Carrier and hyperscaler capex (cloud providers spent >$90B in 2023) drives optics volatility; FY2024 revenue ~ $1.67B amplifies exposure. ASPs fell ~10–15% YoY in key photonics segments while Fed funds ~5.25–5.50% mid‑2025 tightens customer capex and working capital. FX, supply consolidation and 12–20 week lead times add margin and timing risk.
| Metric | Value |
|---|---|
| Cloud capex 2023 | >$90B |
| FY2024 rev | $1.67B |
| ASPs YoY | -10–15% |
Full Version Awaits
Lumentum PESTLE Analysis
The Lumentum PESTLE Analysis preview shown here is the exact document you’ll receive after purchase—fully formatted and ready to use. It covers political, economic, social, technological, legal, and environmental factors for Lumentum in a professional layout. No placeholders or teasers—this is the final file available for immediate download.

Your Competitive Advantage Starts with This Report
Our PESTLE Analysis distills the political, economic, social, technological, legal, and environmental forces shaping Lumentum’s trajectory into actionable insights. Perfect for investors and strategists, it reveals risks and growth levers you won’t find in headlines. Buy the full, editable report now to inform smarter decisions and stay ahead.
Political factors
US–China tech tensions
US export controls on advanced optics and lasers limit Lumentum sales into China’s telecom and industrial sectors, forcing product segmentation to meet licensing rules while retaining competitiveness. License requirements add lead time and booking uncertainty and can require case-by-case approvals. Sudden US policy shifts have historically triggered customer demand pauses or pull-ins, disrupting revenue visibility. Compliance costs and roadmap delays increase operational risk.
Trade tariffs and localization
Tariffs on components and finished goods, often ranging 7.5–25% under recent US/China measures, raise input costs or force price concessions for suppliers like Lumentum.
Governments increasingly incentivize local manufacturing, with local‑content thresholds commonly 30–60%, reshaping footprint and partner decisions.
Diversifying assembly and test geographies reduces political concentration risk; many tech firms moved 20–30% capacity outside China since 2020.
Localization can unlock public‑sector contracts but increases operating complexity, capex and supply‑chain management burden.
Government network investment
Public broadband and 5G funding—notably the US IIJA’s $65B broadband package including $42.45B BEAD—boost optical demand, but country-by-country timing creates uneven multi-year order pipelines.
State-backed vendor qualification can be a strategic wedge for Lumentum to secure long-term buildouts.
Shifts in administration priorities may reallocate funds across regions and technologies, altering revenue timing and mix.
Allied export alignment
US, EU, UK, Japan and the Netherlands have increasingly synchronized controls on sensitive photonics since 2022, meaning restrictions on Lumentum products can apply across major markets simultaneously. Coordinated measures amplify commercial impact and force continuously updated, multi-jurisdictional compliance programs. Regulatory missteps expose firms to civil/criminal penalties, export debarment and material reputational damage.
- Scope: coordinated controls across US/EU/UK/JP/NL
- Compliance: multi-jurisdictional, dynamic
- Risk: fines, debarment, reputational harm
Standards and spectrum policy
- ETSI/3GPP/ITU governance
- US C‑band $80.9B
- Regulatory clarity → faster optics uptake
- Policy lag → delayed deployments/revenue
Export controls curb China access, raising compliance costs; US/EU/JP/UK demand timing shifts optics
US/EU/UK/JP/NL coordinated export controls since 2022 constrain Lumentum access to China, raising compliance costs and booking uncertainty. IIJA/BEAD ($65B/$42.45B) and C‑band auctions ($80.9B) drive optical demand but timing shifts alter revenue. 20–30% supplier reshoring since 2020 raises capex and supply complexity.
| Item | Value |
|---|---|
| BEAD | $42.45B |
| IIJA | $65B |
| C‑band | $80.9B |
| Reshoring | 20–30% |
What is included in the product
Detailed Word Document
Explores how macro-environmental forces uniquely affect Lumentum across Political, Economic, Social, Technological, Environmental, and Legal dimensions, with data-backed trends and industry-specific examples. Designed for executives and investors to identify risks, opportunities, and actionable, forward-looking strategies.
Customizable Excel Spreadsheet
A concise, visually segmented PESTLE summary of Lumentum that’s easily droppable into presentations and shareable across teams for quick alignment and risk discussion, with editable notes to adapt insights by region or product line.
Economic factors
Capex cycles in telecom/datacom
Carrier and hyperscaler spending drives optics demand volatility; top cloud providers invested over $90 billion in data-center capex in 2023, making their buildouts a primary swing factor for Lumentum’s markets. Inventory-digestion phases have historically compressed OEM orders even as end-traffic grows, sometimes reducing quarterly orders by double-digit percentages. Forecast accuracy hinges on visibility into cloud and AI buildouts and contract timing. Diversified end-markets (5G, enterprise, cloud) buffer but do not eliminate cyclicality.
ASP pressure and mix
Competition and rapid node transitions compress ASPs—industry ASPs have fallen roughly 10–15% year-over-year in key photonics segments—while Lumentum pushes higher-speed coherent and 3D sensing modules that command premium pricing and can lift product mix and gross margins by low-to-mid hundreds of basis points. Cost roadmaps in lasers and components must outpace these price declines to protect margins. Customer concentration amplifies pricing pressure during negotiations, given top customers account for over 40% of revenue in recent quarters.
Currency and global footprint
Lumentum’s multi-currency revenue and cost base exposes earnings to FX swings, with significant sales in Asia and Europe amplifying translation and transaction risk; FY2024 revenue was about $1.67 billion, increasing sensitivity to USD movements. Hedging programs partially mitigate volatility but cannot fully neutralize sudden currency moves. Global sourcing and diversified manufacturing footprint improve cost-base resilience, yet manufacturing slowdowns—reflected in weaker global PMIs in 2024—reduce commercial laser demand.
Interest rates and capital access
Higher interest rates (Fed funds ~5.25–5.50% mid‑2025) dampen customer capex and increase Lumentum’s financing costs, pushing network upgrade ROIs above historical thresholds and delaying purchases; working capital strains rise as component lead times remain extended (≈12–20 weeks), raising inventory and receivables needs.
- Higher rates: tighter capex, higher financing
- ROI hurdle: stricter project approvals
- Working capital: longer lead times, more inventory
- Lower rates: could spur consolidation and capacity investment
M&A and industry consolidation
Consolidation among component suppliers and large customers has reshaped bargaining power in Lumentum's optical components markets, increasing pressure on margins and supplier selection. Greater scale from consolidators can enhance procurement discounts and R&D leverage, but integration risk can distract management and delay projected synergies. To mitigate supplier concentration, key customers increasingly dual-source critical modules.
- Consolidation shifts bargaining power
- Scale improves procurement and R&D leverage
- Integration risk delays synergies
- Customers dual-source to reduce supplier concentration
Export controls curb China access, raising compliance costs; US/EU/JP/UK demand timing shifts optics
Carrier and hyperscaler capex (cloud providers spent >$90B in 2023) drives optics volatility; FY2024 revenue ~ $1.67B amplifies exposure. ASPs fell ~10–15% YoY in key photonics segments while Fed funds ~5.25–5.50% mid‑2025 tightens customer capex and working capital. FX, supply consolidation and 12–20 week lead times add margin and timing risk.
| Metric | Value |
|---|---|
| Cloud capex 2023 | >$90B |
| FY2024 rev | $1.67B |
| ASPs YoY | -10–15% |
Full Version Awaits
Lumentum PESTLE Analysis
The Lumentum PESTLE Analysis preview shown here is the exact document you’ll receive after purchase—fully formatted and ready to use. It covers political, economic, social, technological, legal, and environmental factors for Lumentum in a professional layout. No placeholders or teasers—this is the final file available for immediate download.
Description
Your Competitive Advantage Starts with This Report
Our PESTLE Analysis distills the political, economic, social, technological, legal, and environmental forces shaping Lumentum’s trajectory into actionable insights. Perfect for investors and strategists, it reveals risks and growth levers you won’t find in headlines. Buy the full, editable report now to inform smarter decisions and stay ahead.
Political factors
US–China tech tensions
US export controls on advanced optics and lasers limit Lumentum sales into China’s telecom and industrial sectors, forcing product segmentation to meet licensing rules while retaining competitiveness. License requirements add lead time and booking uncertainty and can require case-by-case approvals. Sudden US policy shifts have historically triggered customer demand pauses or pull-ins, disrupting revenue visibility. Compliance costs and roadmap delays increase operational risk.
Trade tariffs and localization
Tariffs on components and finished goods, often ranging 7.5–25% under recent US/China measures, raise input costs or force price concessions for suppliers like Lumentum.
Governments increasingly incentivize local manufacturing, with local‑content thresholds commonly 30–60%, reshaping footprint and partner decisions.
Diversifying assembly and test geographies reduces political concentration risk; many tech firms moved 20–30% capacity outside China since 2020.
Localization can unlock public‑sector contracts but increases operating complexity, capex and supply‑chain management burden.
Government network investment
Public broadband and 5G funding—notably the US IIJA’s $65B broadband package including $42.45B BEAD—boost optical demand, but country-by-country timing creates uneven multi-year order pipelines.
State-backed vendor qualification can be a strategic wedge for Lumentum to secure long-term buildouts.
Shifts in administration priorities may reallocate funds across regions and technologies, altering revenue timing and mix.
Allied export alignment
US, EU, UK, Japan and the Netherlands have increasingly synchronized controls on sensitive photonics since 2022, meaning restrictions on Lumentum products can apply across major markets simultaneously. Coordinated measures amplify commercial impact and force continuously updated, multi-jurisdictional compliance programs. Regulatory missteps expose firms to civil/criminal penalties, export debarment and material reputational damage.
- Scope: coordinated controls across US/EU/UK/JP/NL
- Compliance: multi-jurisdictional, dynamic
- Risk: fines, debarment, reputational harm
Standards and spectrum policy
- ETSI/3GPP/ITU governance
- US C‑band $80.9B
- Regulatory clarity → faster optics uptake
- Policy lag → delayed deployments/revenue
Export controls curb China access, raising compliance costs; US/EU/JP/UK demand timing shifts optics
US/EU/UK/JP/NL coordinated export controls since 2022 constrain Lumentum access to China, raising compliance costs and booking uncertainty. IIJA/BEAD ($65B/$42.45B) and C‑band auctions ($80.9B) drive optical demand but timing shifts alter revenue. 20–30% supplier reshoring since 2020 raises capex and supply complexity.
| Item | Value |
|---|---|
| BEAD | $42.45B |
| IIJA | $65B |
| C‑band | $80.9B |
| Reshoring | 20–30% |
What is included in the product
Detailed Word Document
Explores how macro-environmental forces uniquely affect Lumentum across Political, Economic, Social, Technological, Environmental, and Legal dimensions, with data-backed trends and industry-specific examples. Designed for executives and investors to identify risks, opportunities, and actionable, forward-looking strategies.
Customizable Excel Spreadsheet
A concise, visually segmented PESTLE summary of Lumentum that’s easily droppable into presentations and shareable across teams for quick alignment and risk discussion, with editable notes to adapt insights by region or product line.
Economic factors
Capex cycles in telecom/datacom
Carrier and hyperscaler spending drives optics demand volatility; top cloud providers invested over $90 billion in data-center capex in 2023, making their buildouts a primary swing factor for Lumentum’s markets. Inventory-digestion phases have historically compressed OEM orders even as end-traffic grows, sometimes reducing quarterly orders by double-digit percentages. Forecast accuracy hinges on visibility into cloud and AI buildouts and contract timing. Diversified end-markets (5G, enterprise, cloud) buffer but do not eliminate cyclicality.
ASP pressure and mix
Competition and rapid node transitions compress ASPs—industry ASPs have fallen roughly 10–15% year-over-year in key photonics segments—while Lumentum pushes higher-speed coherent and 3D sensing modules that command premium pricing and can lift product mix and gross margins by low-to-mid hundreds of basis points. Cost roadmaps in lasers and components must outpace these price declines to protect margins. Customer concentration amplifies pricing pressure during negotiations, given top customers account for over 40% of revenue in recent quarters.
Currency and global footprint
Lumentum’s multi-currency revenue and cost base exposes earnings to FX swings, with significant sales in Asia and Europe amplifying translation and transaction risk; FY2024 revenue was about $1.67 billion, increasing sensitivity to USD movements. Hedging programs partially mitigate volatility but cannot fully neutralize sudden currency moves. Global sourcing and diversified manufacturing footprint improve cost-base resilience, yet manufacturing slowdowns—reflected in weaker global PMIs in 2024—reduce commercial laser demand.
Interest rates and capital access
Higher interest rates (Fed funds ~5.25–5.50% mid‑2025) dampen customer capex and increase Lumentum’s financing costs, pushing network upgrade ROIs above historical thresholds and delaying purchases; working capital strains rise as component lead times remain extended (≈12–20 weeks), raising inventory and receivables needs.
- Higher rates: tighter capex, higher financing
- ROI hurdle: stricter project approvals
- Working capital: longer lead times, more inventory
- Lower rates: could spur consolidation and capacity investment
M&A and industry consolidation
Consolidation among component suppliers and large customers has reshaped bargaining power in Lumentum's optical components markets, increasing pressure on margins and supplier selection. Greater scale from consolidators can enhance procurement discounts and R&D leverage, but integration risk can distract management and delay projected synergies. To mitigate supplier concentration, key customers increasingly dual-source critical modules.
- Consolidation shifts bargaining power
- Scale improves procurement and R&D leverage
- Integration risk delays synergies
- Customers dual-source to reduce supplier concentration
Export controls curb China access, raising compliance costs; US/EU/JP/UK demand timing shifts optics
Carrier and hyperscaler capex (cloud providers spent >$90B in 2023) drives optics volatility; FY2024 revenue ~ $1.67B amplifies exposure. ASPs fell ~10–15% YoY in key photonics segments while Fed funds ~5.25–5.50% mid‑2025 tightens customer capex and working capital. FX, supply consolidation and 12–20 week lead times add margin and timing risk.
| Metric | Value |
|---|---|
| Cloud capex 2023 | >$90B |
| FY2024 rev | $1.67B |
| ASPs YoY | -10–15% |
Full Version Awaits
Lumentum PESTLE Analysis
The Lumentum PESTLE Analysis preview shown here is the exact document you’ll receive after purchase—fully formatted and ready to use. It covers political, economic, social, technological, legal, and environmental factors for Lumentum in a professional layout. No placeholders or teasers—this is the final file available for immediate download.











