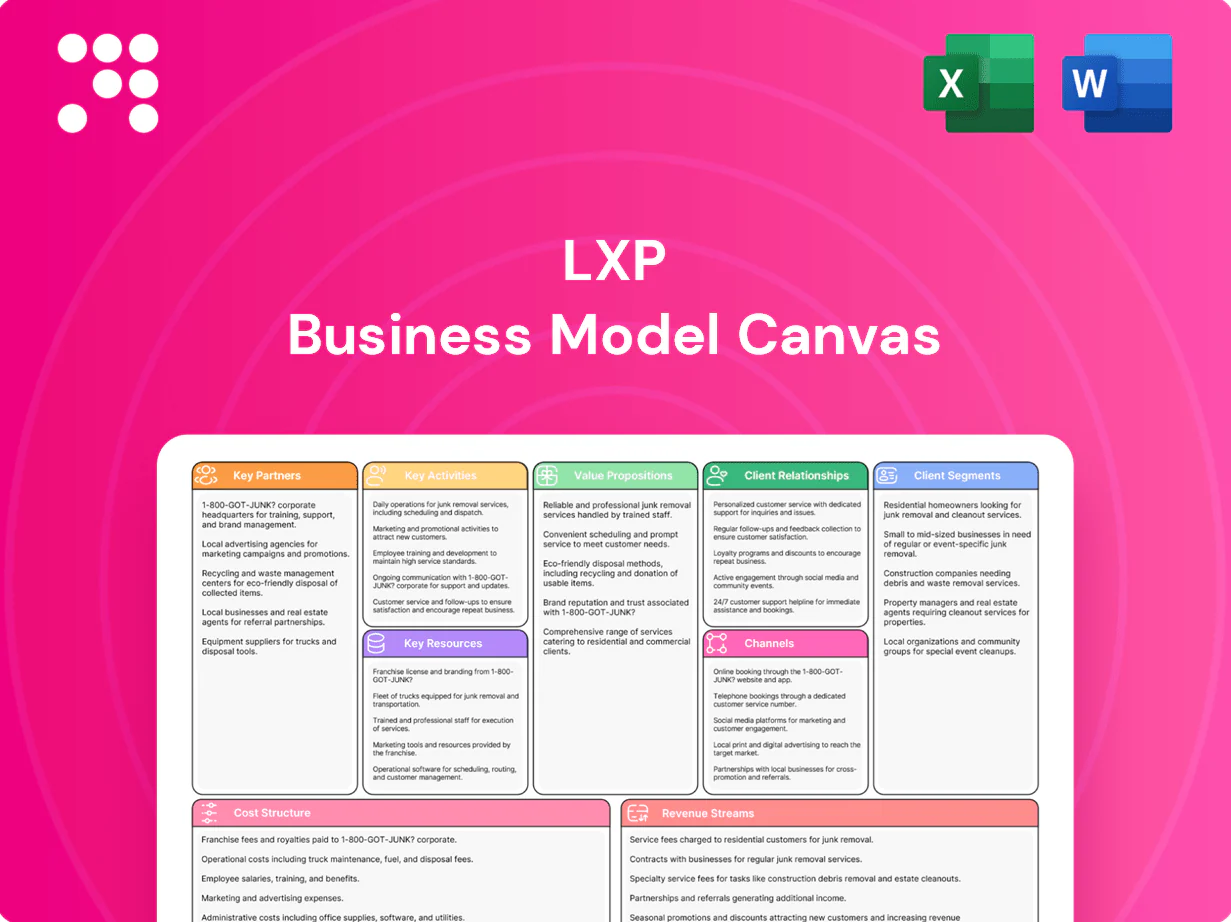
LXP Business Model Canvas

Unlock the Business Model Canvas for a Scalable Learning Experience Platform
Unlock the full strategic blueprint behind LXP's business model with our in-depth Business Model Canvas. This downloadable, editable Word and Excel file reveals how LXP creates value, scales revenue, and outmaneuvers competitors—ideal for entrepreneurs, consultants, and investors. Purchase the complete canvas to get section-by-section insights, financial implications, and actionable strategies you can apply immediately.
Partnerships

Institutional capital providers
Partnerships with banks, insurers, and private lenders provide revolving credit and term loans that can compress WACC, support development and acquisition pipelines, and supply liquidity for lease-up and redevelopment. With the US policy rate at 5.25–5.50% in 2024 and global insurance assets around $34 trillion, flexible capital structures enable timing advantages in competitive bids and stronger cash runway during lease-up.
Developers and general contractors
Collaborations with industrial developers and general contractors enable both build-to-suit and speculative projects, leveraging partner permitting expertise, cost-control protocols and faster delivery timelines; in 2024 over 50% of industrial deal flow moved through off-market or direct channels, expanding origination beyond brokers. These partnerships materially de-risk construction, limit cost overruns and help meet sustainability standards while preserving quality.

Brokerage networks and site selectors
National and regional brokerage networks funnel tenant requirements and off-market industrial assets directly to LXP platforms, accelerating occupancy and aligning sites with supply chain demands. Site selectors bring corporate mandates for distribution and manufacturing footprints, crucial as e-commerce reached about 22.6% of global retail sales in 2024. These partners also supply market intelligence on rental rates and incentives, shortening lease-up cycles and informing pricing strategies.

Economic development authorities
In 2024 partnerships with economic development authorities routinely unlock tax abatements, TIFs, and job credits that materially reduce effective project costs and shorten tenant time-to-operation. Public partners streamline approvals and infrastructure upgrades, cutting permitting and utility lead times. These relationships strengthen community ties and drive long-term occupancy stability for LXP campuses.
- Tax abatements, TIFs, job credits
- Faster approvals & infrastructure
- Lower effective costs, quicker operations
- Stronger community ties, higher occupancy stability
Property services and tech vendors
Property services, ESG data platforms and security providers sustain operational uptime with vendor SLAs (eg 99.9% availability) and standardized response across dispersed portfolios. Smart building and energy-management vendors deliver 10–20% energy savings and help meet compliance and reporting needs. Integrated systems improve tenant experience and streamline ESG and operational reporting.
- Vendor SLAs: 99.9% uptime
- Energy savings: 10–20%
- Integrated systems: streamlined reporting
Capital & insurers unlock liquidity, policy rate 5.25-5.50%, $34T assets
Strategic capital partners (banks, insurers, private lenders) lower WACC and supply liquidity; US policy rate 5.25–5.50% and global insurance assets ~$34T in 2024 enable competitive bidding and lease-up resilience.
Developer, contractor and brokerage alliances speed delivery and off-market origination (>50% of 2024 industrial deal flow), reducing construction risk and vacancy.
Public incentives and service vendors (SLAs 99.9%, 10–20% energy savings) cut effective costs and improve operational uptime.
| Partner | 2024 Metric |
|---|---|
| Insurers/capitals | $34T assets |
| Policy rate | 5.25–5.50% |
| Off-market flow | >50% |
| Vendor SLAs/energy | 99.9% / 10–20% |
What is included in the product
 Detailed Word Document
An LXP Business Model Canvas: a comprehensive, pre-written strategy mapping learner experience platform operations across nine BMC blocks, detailing customer segments, value propositions, channels, revenue and cost structures. Ideal for presentations and investor discussions, it includes competitive analysis, SWOT-linked insights, and validated real-world data to support decision-making.

 Customizable Excel Spreadsheet
Quickly map learner pain points and solutions in a one-page LXP Business Model Canvas with editable cells for team collaboration, fast iteration, and ready-to-share executive summaries.
Activities

Acquisition underwriting
Rigorous financial modeling evaluates projected cash flows, lease escalations and terminal residual values to underwrite acquisitions. Market comps and tenant credit analysis enforce pricing discipline and rent-per-sqft assumptions. Risk-adjusted returns are benchmarked to portfolio hurdle rates above 10-year Treasury yields (around 4.2% in 2024). Legal and environmental diligence reduce downside and contingent liability risk.
Development and redevelopment
Build-to-suit and value-add projects tailor assets to tenant specifications, driving occupancy and lease terms aligned with user needs. Rigorous schedule and budget management protect expected returns and limit construction risk. Flexible layouts and future-proof designs support 10+ year adaptability, while ESG features in 2024 cut operating costs by roughly 10–20% and can lift rental premiums ~3–5%.

Asset and property management
Proactive maintenance and capital planning protect asset value and target 100–300 basis points of NOI uplift through lifecycle interventions. Regular tenant touchpoints reduce churn and address operational needs, supporting retention metrics tracked monthly. Tight operating expense control (benchmarking to peer medians) enhances NOI margins. Continuous data tracking (occupancy, rent/sq ft, OpEx per unit) informs leasing and disposition decisions in 2024.

Leasing and tenant relations
Long-term net leases are negotiated to align with tenant operations, commonly spanning 7–15 years to match supply-chain cycles; U.S. industrial vacancy hovered around 4% in 2024, supporting pricing power. Lease structures balance escalators, renewal options and TI packages to protect cash flow while enabling tenant fit-outs. Creditworthy, investment-grade tenants anchor income durability and ongoing support raises renewal probability and stabilizes NOI.
- Lease term: 7–15 years
- 2024 US industrial vacancy: ~4%
- Structure focus: escalators, renewals, TI
- Priority: investment-grade tenants
Capital markets and portfolio optimization
Debt refinancing with laddered maturities reduces interest rate exposure while preserving liquidity; with the Fed funds target at 5.25–5.50% at end-2024, laddering was critical for cost control. Regular dispositions recycle capital from non-core or mature assets to fund higher-return opportunities. Geographic and tenant diversification limit concentration risk, and targeted equity raises scale fund growth.
- Debt laddering: lower rate shock
- Dispositions: recycle capital
- Diversification: reduce concentration
- Equity raises: fund scalable growth
Underwrite with DCFs & comps; target >10y Treasury (~4.2%), ESG OpEx 10–20%
Underwrite deals with DCFs, comps and tenant credit; target returns >10-year Treasury (~4.2% in 2024). Execute build-to-suit/value-add with 10–20% ESG OpEx savings and 100–300 bps NOI uplift. Operate with proactive maintenance, tight OpEx control and monthly KPI tracking. Finance via debt laddering (Fed funds 5.25–5.50% end-2024), dispositions and targeted equity raises.
| Metric | 2024 |
|---|---|
| 10y Treasury | ~4.2% |
| Fed funds | 5.25–5.50% |
| US industrial vacancy | ~4% |
Preview Before You Purchase
Business Model Canvas
This preview of the LXP Business Model Canvas is the actual deliverable, not a mockup. After purchase you’ll receive the same complete document, formatted and editable exactly as shown. The file is ready-to-use for presentation, planning, and implementation.

Unlock the Business Model Canvas for a Scalable Learning Experience Platform
Unlock the full strategic blueprint behind LXP's business model with our in-depth Business Model Canvas. This downloadable, editable Word and Excel file reveals how LXP creates value, scales revenue, and outmaneuvers competitors—ideal for entrepreneurs, consultants, and investors. Purchase the complete canvas to get section-by-section insights, financial implications, and actionable strategies you can apply immediately.
Partnerships
Institutional capital providers
Partnerships with banks, insurers, and private lenders provide revolving credit and term loans that can compress WACC, support development and acquisition pipelines, and supply liquidity for lease-up and redevelopment. With the US policy rate at 5.25–5.50% in 2024 and global insurance assets around $34 trillion, flexible capital structures enable timing advantages in competitive bids and stronger cash runway during lease-up.
Developers and general contractors
Collaborations with industrial developers and general contractors enable both build-to-suit and speculative projects, leveraging partner permitting expertise, cost-control protocols and faster delivery timelines; in 2024 over 50% of industrial deal flow moved through off-market or direct channels, expanding origination beyond brokers. These partnerships materially de-risk construction, limit cost overruns and help meet sustainability standards while preserving quality.
Brokerage networks and site selectors
National and regional brokerage networks funnel tenant requirements and off-market industrial assets directly to LXP platforms, accelerating occupancy and aligning sites with supply chain demands. Site selectors bring corporate mandates for distribution and manufacturing footprints, crucial as e-commerce reached about 22.6% of global retail sales in 2024. These partners also supply market intelligence on rental rates and incentives, shortening lease-up cycles and informing pricing strategies.
Economic development authorities
In 2024 partnerships with economic development authorities routinely unlock tax abatements, TIFs, and job credits that materially reduce effective project costs and shorten tenant time-to-operation. Public partners streamline approvals and infrastructure upgrades, cutting permitting and utility lead times. These relationships strengthen community ties and drive long-term occupancy stability for LXP campuses.
- Tax abatements, TIFs, job credits
- Faster approvals & infrastructure
- Lower effective costs, quicker operations
- Stronger community ties, higher occupancy stability
Property services and tech vendors
Property services, ESG data platforms and security providers sustain operational uptime with vendor SLAs (eg 99.9% availability) and standardized response across dispersed portfolios. Smart building and energy-management vendors deliver 10–20% energy savings and help meet compliance and reporting needs. Integrated systems improve tenant experience and streamline ESG and operational reporting.
- Vendor SLAs: 99.9% uptime
- Energy savings: 10–20%
- Integrated systems: streamlined reporting
Capital & insurers unlock liquidity, policy rate 5.25-5.50%, $34T assets
Strategic capital partners (banks, insurers, private lenders) lower WACC and supply liquidity; US policy rate 5.25–5.50% and global insurance assets ~$34T in 2024 enable competitive bidding and lease-up resilience.
Developer, contractor and brokerage alliances speed delivery and off-market origination (>50% of 2024 industrial deal flow), reducing construction risk and vacancy.
Public incentives and service vendors (SLAs 99.9%, 10–20% energy savings) cut effective costs and improve operational uptime.
| Partner | 2024 Metric |
|---|---|
| Insurers/capitals | $34T assets |
| Policy rate | 5.25–5.50% |
| Off-market flow | >50% |
| Vendor SLAs/energy | 99.9% / 10–20% |
What is included in the product
Detailed Word Document
An LXP Business Model Canvas: a comprehensive, pre-written strategy mapping learner experience platform operations across nine BMC blocks, detailing customer segments, value propositions, channels, revenue and cost structures. Ideal for presentations and investor discussions, it includes competitive analysis, SWOT-linked insights, and validated real-world data to support decision-making.
Customizable Excel Spreadsheet
Quickly map learner pain points and solutions in a one-page LXP Business Model Canvas with editable cells for team collaboration, fast iteration, and ready-to-share executive summaries.
Activities
Acquisition underwriting
Rigorous financial modeling evaluates projected cash flows, lease escalations and terminal residual values to underwrite acquisitions. Market comps and tenant credit analysis enforce pricing discipline and rent-per-sqft assumptions. Risk-adjusted returns are benchmarked to portfolio hurdle rates above 10-year Treasury yields (around 4.2% in 2024). Legal and environmental diligence reduce downside and contingent liability risk.
Development and redevelopment
Build-to-suit and value-add projects tailor assets to tenant specifications, driving occupancy and lease terms aligned with user needs. Rigorous schedule and budget management protect expected returns and limit construction risk. Flexible layouts and future-proof designs support 10+ year adaptability, while ESG features in 2024 cut operating costs by roughly 10–20% and can lift rental premiums ~3–5%.
Asset and property management
Proactive maintenance and capital planning protect asset value and target 100–300 basis points of NOI uplift through lifecycle interventions. Regular tenant touchpoints reduce churn and address operational needs, supporting retention metrics tracked monthly. Tight operating expense control (benchmarking to peer medians) enhances NOI margins. Continuous data tracking (occupancy, rent/sq ft, OpEx per unit) informs leasing and disposition decisions in 2024.
Leasing and tenant relations
Long-term net leases are negotiated to align with tenant operations, commonly spanning 7–15 years to match supply-chain cycles; U.S. industrial vacancy hovered around 4% in 2024, supporting pricing power. Lease structures balance escalators, renewal options and TI packages to protect cash flow while enabling tenant fit-outs. Creditworthy, investment-grade tenants anchor income durability and ongoing support raises renewal probability and stabilizes NOI.
- Lease term: 7–15 years
- 2024 US industrial vacancy: ~4%
- Structure focus: escalators, renewals, TI
- Priority: investment-grade tenants
Capital markets and portfolio optimization
Debt refinancing with laddered maturities reduces interest rate exposure while preserving liquidity; with the Fed funds target at 5.25–5.50% at end-2024, laddering was critical for cost control. Regular dispositions recycle capital from non-core or mature assets to fund higher-return opportunities. Geographic and tenant diversification limit concentration risk, and targeted equity raises scale fund growth.
- Debt laddering: lower rate shock
- Dispositions: recycle capital
- Diversification: reduce concentration
- Equity raises: fund scalable growth
Underwrite with DCFs & comps; target >10y Treasury (~4.2%), ESG OpEx 10–20%
Underwrite deals with DCFs, comps and tenant credit; target returns >10-year Treasury (~4.2% in 2024). Execute build-to-suit/value-add with 10–20% ESG OpEx savings and 100–300 bps NOI uplift. Operate with proactive maintenance, tight OpEx control and monthly KPI tracking. Finance via debt laddering (Fed funds 5.25–5.50% end-2024), dispositions and targeted equity raises.
| Metric | 2024 |
|---|---|
| 10y Treasury | ~4.2% |
| Fed funds | 5.25–5.50% |
| US industrial vacancy | ~4% |
Preview Before You Purchase
Business Model Canvas
This preview of the LXP Business Model Canvas is the actual deliverable, not a mockup. After purchase you’ll receive the same complete document, formatted and editable exactly as shown. The file is ready-to-use for presentation, planning, and implementation.
Original: $10.00
-65%$10.00
$3.50Description
Unlock the Business Model Canvas for a Scalable Learning Experience Platform
Unlock the full strategic blueprint behind LXP's business model with our in-depth Business Model Canvas. This downloadable, editable Word and Excel file reveals how LXP creates value, scales revenue, and outmaneuvers competitors—ideal for entrepreneurs, consultants, and investors. Purchase the complete canvas to get section-by-section insights, financial implications, and actionable strategies you can apply immediately.
Partnerships
Institutional capital providers
Partnerships with banks, insurers, and private lenders provide revolving credit and term loans that can compress WACC, support development and acquisition pipelines, and supply liquidity for lease-up and redevelopment. With the US policy rate at 5.25–5.50% in 2024 and global insurance assets around $34 trillion, flexible capital structures enable timing advantages in competitive bids and stronger cash runway during lease-up.
Developers and general contractors
Collaborations with industrial developers and general contractors enable both build-to-suit and speculative projects, leveraging partner permitting expertise, cost-control protocols and faster delivery timelines; in 2024 over 50% of industrial deal flow moved through off-market or direct channels, expanding origination beyond brokers. These partnerships materially de-risk construction, limit cost overruns and help meet sustainability standards while preserving quality.
Brokerage networks and site selectors
National and regional brokerage networks funnel tenant requirements and off-market industrial assets directly to LXP platforms, accelerating occupancy and aligning sites with supply chain demands. Site selectors bring corporate mandates for distribution and manufacturing footprints, crucial as e-commerce reached about 22.6% of global retail sales in 2024. These partners also supply market intelligence on rental rates and incentives, shortening lease-up cycles and informing pricing strategies.
Economic development authorities
In 2024 partnerships with economic development authorities routinely unlock tax abatements, TIFs, and job credits that materially reduce effective project costs and shorten tenant time-to-operation. Public partners streamline approvals and infrastructure upgrades, cutting permitting and utility lead times. These relationships strengthen community ties and drive long-term occupancy stability for LXP campuses.
- Tax abatements, TIFs, job credits
- Faster approvals & infrastructure
- Lower effective costs, quicker operations
- Stronger community ties, higher occupancy stability
Property services and tech vendors
Property services, ESG data platforms and security providers sustain operational uptime with vendor SLAs (eg 99.9% availability) and standardized response across dispersed portfolios. Smart building and energy-management vendors deliver 10–20% energy savings and help meet compliance and reporting needs. Integrated systems improve tenant experience and streamline ESG and operational reporting.
- Vendor SLAs: 99.9% uptime
- Energy savings: 10–20%
- Integrated systems: streamlined reporting
Capital & insurers unlock liquidity, policy rate 5.25-5.50%, $34T assets
Strategic capital partners (banks, insurers, private lenders) lower WACC and supply liquidity; US policy rate 5.25–5.50% and global insurance assets ~$34T in 2024 enable competitive bidding and lease-up resilience.
Developer, contractor and brokerage alliances speed delivery and off-market origination (>50% of 2024 industrial deal flow), reducing construction risk and vacancy.
Public incentives and service vendors (SLAs 99.9%, 10–20% energy savings) cut effective costs and improve operational uptime.
| Partner | 2024 Metric |
|---|---|
| Insurers/capitals | $34T assets |
| Policy rate | 5.25–5.50% |
| Off-market flow | >50% |
| Vendor SLAs/energy | 99.9% / 10–20% |
What is included in the product
Detailed Word Document
An LXP Business Model Canvas: a comprehensive, pre-written strategy mapping learner experience platform operations across nine BMC blocks, detailing customer segments, value propositions, channels, revenue and cost structures. Ideal for presentations and investor discussions, it includes competitive analysis, SWOT-linked insights, and validated real-world data to support decision-making.
Customizable Excel Spreadsheet
Quickly map learner pain points and solutions in a one-page LXP Business Model Canvas with editable cells for team collaboration, fast iteration, and ready-to-share executive summaries.
Activities
Acquisition underwriting
Rigorous financial modeling evaluates projected cash flows, lease escalations and terminal residual values to underwrite acquisitions. Market comps and tenant credit analysis enforce pricing discipline and rent-per-sqft assumptions. Risk-adjusted returns are benchmarked to portfolio hurdle rates above 10-year Treasury yields (around 4.2% in 2024). Legal and environmental diligence reduce downside and contingent liability risk.
Development and redevelopment
Build-to-suit and value-add projects tailor assets to tenant specifications, driving occupancy and lease terms aligned with user needs. Rigorous schedule and budget management protect expected returns and limit construction risk. Flexible layouts and future-proof designs support 10+ year adaptability, while ESG features in 2024 cut operating costs by roughly 10–20% and can lift rental premiums ~3–5%.
Asset and property management
Proactive maintenance and capital planning protect asset value and target 100–300 basis points of NOI uplift through lifecycle interventions. Regular tenant touchpoints reduce churn and address operational needs, supporting retention metrics tracked monthly. Tight operating expense control (benchmarking to peer medians) enhances NOI margins. Continuous data tracking (occupancy, rent/sq ft, OpEx per unit) informs leasing and disposition decisions in 2024.
Leasing and tenant relations
Long-term net leases are negotiated to align with tenant operations, commonly spanning 7–15 years to match supply-chain cycles; U.S. industrial vacancy hovered around 4% in 2024, supporting pricing power. Lease structures balance escalators, renewal options and TI packages to protect cash flow while enabling tenant fit-outs. Creditworthy, investment-grade tenants anchor income durability and ongoing support raises renewal probability and stabilizes NOI.
- Lease term: 7–15 years
- 2024 US industrial vacancy: ~4%
- Structure focus: escalators, renewals, TI
- Priority: investment-grade tenants
Capital markets and portfolio optimization
Debt refinancing with laddered maturities reduces interest rate exposure while preserving liquidity; with the Fed funds target at 5.25–5.50% at end-2024, laddering was critical for cost control. Regular dispositions recycle capital from non-core or mature assets to fund higher-return opportunities. Geographic and tenant diversification limit concentration risk, and targeted equity raises scale fund growth.
- Debt laddering: lower rate shock
- Dispositions: recycle capital
- Diversification: reduce concentration
- Equity raises: fund scalable growth
Underwrite with DCFs & comps; target >10y Treasury (~4.2%), ESG OpEx 10–20%
Underwrite deals with DCFs, comps and tenant credit; target returns >10-year Treasury (~4.2% in 2024). Execute build-to-suit/value-add with 10–20% ESG OpEx savings and 100–300 bps NOI uplift. Operate with proactive maintenance, tight OpEx control and monthly KPI tracking. Finance via debt laddering (Fed funds 5.25–5.50% end-2024), dispositions and targeted equity raises.
| Metric | 2024 |
|---|---|
| 10y Treasury | ~4.2% |
| Fed funds | 5.25–5.50% |
| US industrial vacancy | ~4% |
Preview Before You Purchase
Business Model Canvas
This preview of the LXP Business Model Canvas is the actual deliverable, not a mockup. After purchase you’ll receive the same complete document, formatted and editable exactly as shown. The file is ready-to-use for presentation, planning, and implementation.











