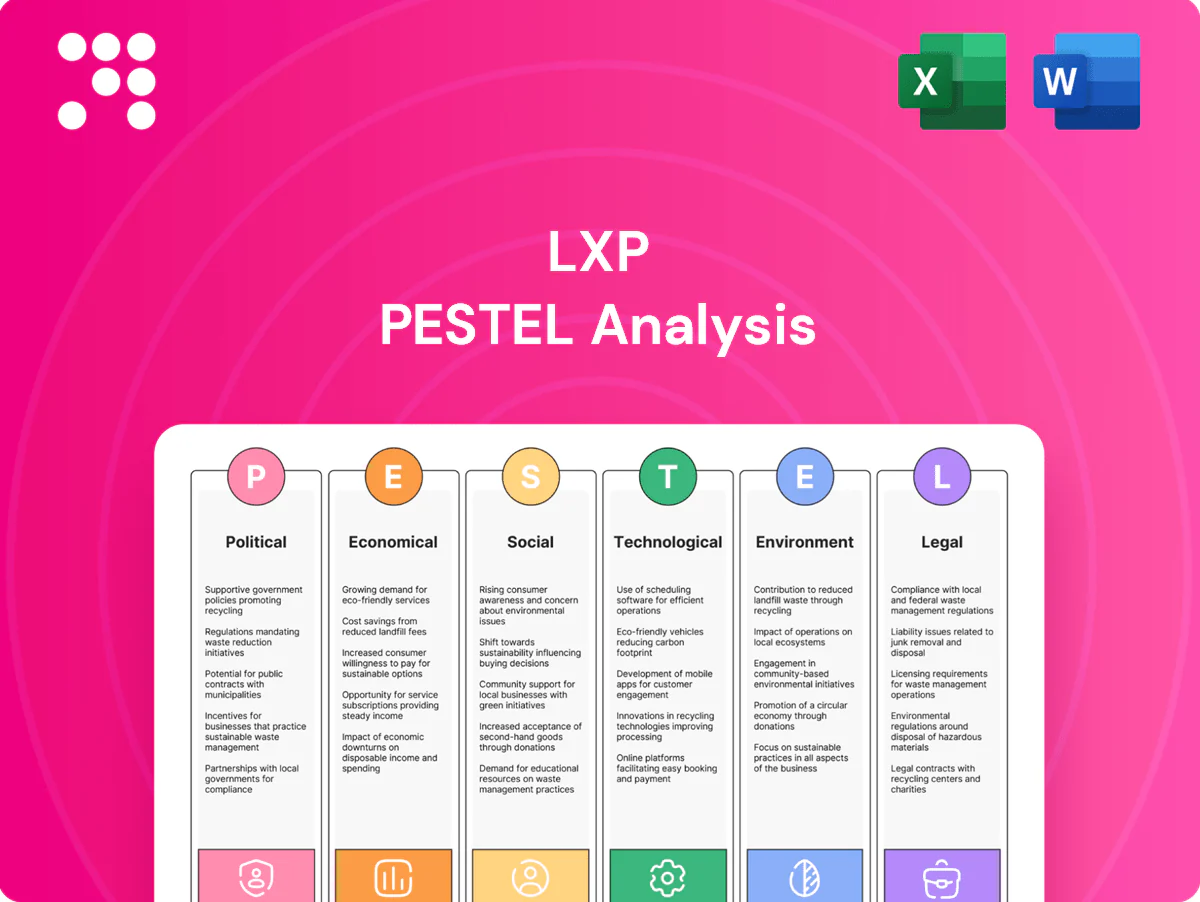
LXP PESTLE Analysis

Skip the Research. Get the Strategy.
Unlock strategic clarity with our PESTLE Analysis of LXP—three to five-sentence insights won’t cut it, so get the full, professionally researched breakdown to see how political, economic, social, technological, legal, and environmental forces will shape LXP’s future. Perfect for investors and strategists, the complete report is ready to download and customize. Buy now for immediate, actionable intelligence.
Political factors

Local/state incentives and permitting
Industrial developments often hinge on tax abatements, TIFs and job-creation grants, with large industrial packages commonly exceeding $1m and incentive deals routinely running into the mid‑seven figures for sites over 100k sqft. LXP’s site selection benefits from pro‑development councils and streamlined permitting; municipal approvals for major projects typically range from 3–18 months and can extend to 12–24 months after political shifts. Changes in political leadership may tighten incentives or lengthen timelines; proactive engagement with municipalities and negotiated pre‑entitlements reduces entitlement risk and preserves projected IRRs.
Federal and state infrastructure policy
Federal and state infrastructure policy — anchored by the 2021 IIJA (total $1.2 trillion, $550 billion in new spending) — directly shapes location desirability and rent growth for logistics assets, with $110 billion targeted to roads and bridges and major grant awards often ranging from $50–500 million per corridor or port project. New highways, rail investments and intermodal hubs can materially re-rate markets where LXP invests, while delays or budget cuts slow tenant demand and development pipelines. Tracking IIJA and state allocations lets LXP anticipate demand hotspots and time capital deployment.

Trade policy and geopolitical tensions
Tariffs such as the 25% duties on many Chinese goods and Section 232 steel/aluminum tariffs reshape supply chains, driving higher warehouse inventories and nearshoring to Mexico and the US. Federal onshoring incentives — CHIPS Act $52B and IRA tax credits ~ $369B — have accelerated reshoring and demand for manufacturing logistics. Tenants often reconfigure footprints, changing lease-up and renewal probabilities, while diversified tenant exposure cushions volatility.

Zoning, land-use, and local politics
Warehouse siting for LXP draws community scrutiny over traffic and noise, with local hearings often delaying projects. Zoning boards and planning commissions can impose constraints or costly conditions that extend timelines and increase capex; US industrial vacancy was ~5% in 2024 (CBRE). LXP must navigate variances, design standards and truck-route restrictions; early community engagement reduces opposition risk.
- Community hearings often require traffic/noise studies
- Zoning conditions can add months and increase capex
- Truck‑route limits affect operating costs
- Early engagement lowers litigation and rezoning risk
Property tax regimes and fiscal pressure
Municipal budget gaps in 2024–25 prompted many jurisdictions to reassess values and raise mill rates, directly increasing property tax bills and compressing NOI on net‑leased assets where taxes are often passed through to tenants or capitalized into valuations.
Political appetite for commercial tax hikes varies widely by state and county, with swing counties more likely to approve incremental commercial rate increases during tight fiscal cycles; monitoring appeals cycles, levy timelines and reserve budgeting is essential for cash‑flow stress testing.
- Municipal reassessments: increased incidence in 2024–25
- NOI impact: property tax is a material line‑item for net‑leased assets
- Political variability: state/county differences drive tax risk
- Action: track appeals cycles and maintain budgeted reserves
Permitting delays, tax reassessments and federal policy tighten industrial NOI and timelines
Political drivers materially affect LXP: permitting cycles of 3–18 months (12–24 months post‑political shifts) and municipal tax reassessments rising in 2024–25 compress NOI; US industrial vacancy ~5% (2024, CBRE) supports rents but community opposition and zoning add capex and delays. Federal policy (IIJA $1.2T, $550B new; CHIPS $52B; IRA ~369B credits) shifts demand via onshoring and infrastructure.
| Factor | 2024–25 metric | Impact |
|---|---|---|
| Permitting | 3–18m (12–24m after shifts) | Timing risk, entitlements |
| Tax reassessments | ↑ incidence 2024–25 | NOI compression |
| Federal policy | IIJA $1.2T; CHIPS $52B; IRA ~$369B | Demand re‑rating, nearshoring |
What is included in the product
 Detailed Word Document
Explores how external macro-environmental factors uniquely affect the LXP across six dimensions—Political, Economic, Social, Technological, Environmental, and Legal—with each category expanded into detailed sub‑points and business-specific examples. Backed by current data and forward-looking insights, the analysis supports executives, investors, and entrepreneurs in scenario planning, risk mitigation, and opportunity identification.

 Customizable Excel Spreadsheet
The LXP PESTLE Analysis delivers a clean, visually segmented summary that quickly highlights external risks and opportunities, is editable for local context, and produces shareable, presentation-ready outputs to streamline strategic planning.
Economic factors

Interest rates and cap rates
REIT valuations and acquisition yields remain highly rate-sensitive as the 10-year Treasury sits near 4.3% and the federal funds target range is roughly 5.25–5.50%, pressuring cap rates and widening development spreads. Rising rates compress transaction multiples and margin on new builds, while falling rates can unlock accretive growth and M&A optionality. LXP’s debt maturity ladder and hedging approach bolster cash-flow resilience, and disciplined pricing helps protect NAV per share.
Industrial demand from e-commerce and manufacturing
Rising e-commerce penetration (~16% of US retail sales in 2024) and reshoring have boosted absorption of distribution and light-manufacturing space, keeping national logistics vacancy near 3.5% and annual rent growth around 5% in 2024. Strong tenant demand supports low vacancies, though cyclical slowdowns can delay expansions and renewals. Selective markets and longer, inflation‑linked lease terms balance growth with cash‑flow stability.

Construction costs and supply pipeline
Materials and labor inflation rose roughly 5% in 2024, lifting build-to-suit replacement costs and supporting achievable rents while compressing development margins by an estimated 200–400 basis points. Elevated replacement cost can bolster valuation but narrows new‑build returns. Sudden supply spikes—completions in some markets up ~20% in 2024—have softened rents and increased concessions. Phased delivery and strong pre‑leasing materially reduce oversupply exposure.

Tenant credit quality and default risk
Net-lease cash flows hinge on tenant solvency across cycles; CMBS and corporate credit spreads widened after the 2022 rate shock and, per S&P Global Ratings, CMBS delinquency edged near 3.2% in mid‑2025, making tenant credit assessment central to underwriting.
- Diversify by industry and geography to cut concentration risk
- Focus underwriting on retail, 3PLs, manufacturers sector health
- Monitor credit spreads and covenant strength continuously
Labor markets and logistics productivity
Tight labor markets, with US unemployment at 3.7% in Dec 2024, raise tenants’ operating costs and push site preferences toward areas with accessible labor. Markets with deep labor pools improve asset competitiveness. Wage growth near 4% in 2024 reshaped expansion and lease negotiations, while local incentives often offset labor cost pressures.
- Labor tightness: US unemployment 3.7% (Dec 2024)
- Wage trend: ~4% YoY (2024)
- Deep pools boost occupancy
- Incentives can neutralize labor premiums
Permitting delays, tax reassessments and federal policy tighten industrial NOI and timelines
Rates (10y 4.3%, fed funds 5.25–5.50%) pressure cap rates; logistics vacancy ~3.5% with ~5% rent growth (2024); materials/labor inflation ~5% compresses development margins; CMBS delinquency ~3.2% (mid‑2025) raises credit focus; unemployment 3.7% (Dec 2024), wage growth ~4% (2024) shifts site selection.
| Metric | Value |
|---|---|
| 10‑yr Treasury | 4.3% |
| Fed funds | 5.25–5.50% |
| Logistics vacancy | 3.5% |
| Rent growth (2024) | ~5% |
| Materials/labor inflation | ~5% |
| CMBS delinquency | 3.2% (mid‑2025) |
| Unemployment (Dec 2024) | 3.7% |
| Wage growth (2024) | ~4% |
Same Document Delivered
LXP PESTLE Analysis
The LXP PESTLE Analysis preview shown here is the exact document you’ll receive after purchase—fully formatted and ready to use. The content, structure, and layout visible are the final version with no placeholders or teasers. After payment you’ll instantly download this same professionally structured file, ready for immediate application in strategy or reporting.

Skip the Research. Get the Strategy.
Unlock strategic clarity with our PESTLE Analysis of LXP—three to five-sentence insights won’t cut it, so get the full, professionally researched breakdown to see how political, economic, social, technological, legal, and environmental forces will shape LXP’s future. Perfect for investors and strategists, the complete report is ready to download and customize. Buy now for immediate, actionable intelligence.
Political factors
Local/state incentives and permitting
Industrial developments often hinge on tax abatements, TIFs and job-creation grants, with large industrial packages commonly exceeding $1m and incentive deals routinely running into the mid‑seven figures for sites over 100k sqft. LXP’s site selection benefits from pro‑development councils and streamlined permitting; municipal approvals for major projects typically range from 3–18 months and can extend to 12–24 months after political shifts. Changes in political leadership may tighten incentives or lengthen timelines; proactive engagement with municipalities and negotiated pre‑entitlements reduces entitlement risk and preserves projected IRRs.
Federal and state infrastructure policy
Federal and state infrastructure policy — anchored by the 2021 IIJA (total $1.2 trillion, $550 billion in new spending) — directly shapes location desirability and rent growth for logistics assets, with $110 billion targeted to roads and bridges and major grant awards often ranging from $50–500 million per corridor or port project. New highways, rail investments and intermodal hubs can materially re-rate markets where LXP invests, while delays or budget cuts slow tenant demand and development pipelines. Tracking IIJA and state allocations lets LXP anticipate demand hotspots and time capital deployment.
Trade policy and geopolitical tensions
Tariffs such as the 25% duties on many Chinese goods and Section 232 steel/aluminum tariffs reshape supply chains, driving higher warehouse inventories and nearshoring to Mexico and the US. Federal onshoring incentives — CHIPS Act $52B and IRA tax credits ~ $369B — have accelerated reshoring and demand for manufacturing logistics. Tenants often reconfigure footprints, changing lease-up and renewal probabilities, while diversified tenant exposure cushions volatility.
Zoning, land-use, and local politics
Warehouse siting for LXP draws community scrutiny over traffic and noise, with local hearings often delaying projects. Zoning boards and planning commissions can impose constraints or costly conditions that extend timelines and increase capex; US industrial vacancy was ~5% in 2024 (CBRE). LXP must navigate variances, design standards and truck-route restrictions; early community engagement reduces opposition risk.
- Community hearings often require traffic/noise studies
- Zoning conditions can add months and increase capex
- Truck‑route limits affect operating costs
- Early engagement lowers litigation and rezoning risk
Property tax regimes and fiscal pressure
Municipal budget gaps in 2024–25 prompted many jurisdictions to reassess values and raise mill rates, directly increasing property tax bills and compressing NOI on net‑leased assets where taxes are often passed through to tenants or capitalized into valuations.
Political appetite for commercial tax hikes varies widely by state and county, with swing counties more likely to approve incremental commercial rate increases during tight fiscal cycles; monitoring appeals cycles, levy timelines and reserve budgeting is essential for cash‑flow stress testing.
- Municipal reassessments: increased incidence in 2024–25
- NOI impact: property tax is a material line‑item for net‑leased assets
- Political variability: state/county differences drive tax risk
- Action: track appeals cycles and maintain budgeted reserves
Permitting delays, tax reassessments and federal policy tighten industrial NOI and timelines
Political drivers materially affect LXP: permitting cycles of 3–18 months (12–24 months post‑political shifts) and municipal tax reassessments rising in 2024–25 compress NOI; US industrial vacancy ~5% (2024, CBRE) supports rents but community opposition and zoning add capex and delays. Federal policy (IIJA $1.2T, $550B new; CHIPS $52B; IRA ~369B credits) shifts demand via onshoring and infrastructure.
| Factor | 2024–25 metric | Impact |
|---|---|---|
| Permitting | 3–18m (12–24m after shifts) | Timing risk, entitlements |
| Tax reassessments | ↑ incidence 2024–25 | NOI compression |
| Federal policy | IIJA $1.2T; CHIPS $52B; IRA ~$369B | Demand re‑rating, nearshoring |
What is included in the product
Detailed Word Document
Explores how external macro-environmental factors uniquely affect the LXP across six dimensions—Political, Economic, Social, Technological, Environmental, and Legal—with each category expanded into detailed sub‑points and business-specific examples. Backed by current data and forward-looking insights, the analysis supports executives, investors, and entrepreneurs in scenario planning, risk mitigation, and opportunity identification.
Customizable Excel Spreadsheet
The LXP PESTLE Analysis delivers a clean, visually segmented summary that quickly highlights external risks and opportunities, is editable for local context, and produces shareable, presentation-ready outputs to streamline strategic planning.
Economic factors
Interest rates and cap rates
REIT valuations and acquisition yields remain highly rate-sensitive as the 10-year Treasury sits near 4.3% and the federal funds target range is roughly 5.25–5.50%, pressuring cap rates and widening development spreads. Rising rates compress transaction multiples and margin on new builds, while falling rates can unlock accretive growth and M&A optionality. LXP’s debt maturity ladder and hedging approach bolster cash-flow resilience, and disciplined pricing helps protect NAV per share.
Industrial demand from e-commerce and manufacturing
Rising e-commerce penetration (~16% of US retail sales in 2024) and reshoring have boosted absorption of distribution and light-manufacturing space, keeping national logistics vacancy near 3.5% and annual rent growth around 5% in 2024. Strong tenant demand supports low vacancies, though cyclical slowdowns can delay expansions and renewals. Selective markets and longer, inflation‑linked lease terms balance growth with cash‑flow stability.
Construction costs and supply pipeline
Materials and labor inflation rose roughly 5% in 2024, lifting build-to-suit replacement costs and supporting achievable rents while compressing development margins by an estimated 200–400 basis points. Elevated replacement cost can bolster valuation but narrows new‑build returns. Sudden supply spikes—completions in some markets up ~20% in 2024—have softened rents and increased concessions. Phased delivery and strong pre‑leasing materially reduce oversupply exposure.
Tenant credit quality and default risk
Net-lease cash flows hinge on tenant solvency across cycles; CMBS and corporate credit spreads widened after the 2022 rate shock and, per S&P Global Ratings, CMBS delinquency edged near 3.2% in mid‑2025, making tenant credit assessment central to underwriting.
- Diversify by industry and geography to cut concentration risk
- Focus underwriting on retail, 3PLs, manufacturers sector health
- Monitor credit spreads and covenant strength continuously
Labor markets and logistics productivity
Tight labor markets, with US unemployment at 3.7% in Dec 2024, raise tenants’ operating costs and push site preferences toward areas with accessible labor. Markets with deep labor pools improve asset competitiveness. Wage growth near 4% in 2024 reshaped expansion and lease negotiations, while local incentives often offset labor cost pressures.
- Labor tightness: US unemployment 3.7% (Dec 2024)
- Wage trend: ~4% YoY (2024)
- Deep pools boost occupancy
- Incentives can neutralize labor premiums
Permitting delays, tax reassessments and federal policy tighten industrial NOI and timelines
Rates (10y 4.3%, fed funds 5.25–5.50%) pressure cap rates; logistics vacancy ~3.5% with ~5% rent growth (2024); materials/labor inflation ~5% compresses development margins; CMBS delinquency ~3.2% (mid‑2025) raises credit focus; unemployment 3.7% (Dec 2024), wage growth ~4% (2024) shifts site selection.
| Metric | Value |
|---|---|
| 10‑yr Treasury | 4.3% |
| Fed funds | 5.25–5.50% |
| Logistics vacancy | 3.5% |
| Rent growth (2024) | ~5% |
| Materials/labor inflation | ~5% |
| CMBS delinquency | 3.2% (mid‑2025) |
| Unemployment (Dec 2024) | 3.7% |
| Wage growth (2024) | ~4% |
Same Document Delivered
LXP PESTLE Analysis
The LXP PESTLE Analysis preview shown here is the exact document you’ll receive after purchase—fully formatted and ready to use. The content, structure, and layout visible are the final version with no placeholders or teasers. After payment you’ll instantly download this same professionally structured file, ready for immediate application in strategy or reporting.
Original: $10.00
-65%$10.00
$3.50Description
Skip the Research. Get the Strategy.
Unlock strategic clarity with our PESTLE Analysis of LXP—three to five-sentence insights won’t cut it, so get the full, professionally researched breakdown to see how political, economic, social, technological, legal, and environmental forces will shape LXP’s future. Perfect for investors and strategists, the complete report is ready to download and customize. Buy now for immediate, actionable intelligence.
Political factors
Local/state incentives and permitting
Industrial developments often hinge on tax abatements, TIFs and job-creation grants, with large industrial packages commonly exceeding $1m and incentive deals routinely running into the mid‑seven figures for sites over 100k sqft. LXP’s site selection benefits from pro‑development councils and streamlined permitting; municipal approvals for major projects typically range from 3–18 months and can extend to 12–24 months after political shifts. Changes in political leadership may tighten incentives or lengthen timelines; proactive engagement with municipalities and negotiated pre‑entitlements reduces entitlement risk and preserves projected IRRs.
Federal and state infrastructure policy
Federal and state infrastructure policy — anchored by the 2021 IIJA (total $1.2 trillion, $550 billion in new spending) — directly shapes location desirability and rent growth for logistics assets, with $110 billion targeted to roads and bridges and major grant awards often ranging from $50–500 million per corridor or port project. New highways, rail investments and intermodal hubs can materially re-rate markets where LXP invests, while delays or budget cuts slow tenant demand and development pipelines. Tracking IIJA and state allocations lets LXP anticipate demand hotspots and time capital deployment.
Trade policy and geopolitical tensions
Tariffs such as the 25% duties on many Chinese goods and Section 232 steel/aluminum tariffs reshape supply chains, driving higher warehouse inventories and nearshoring to Mexico and the US. Federal onshoring incentives — CHIPS Act $52B and IRA tax credits ~ $369B — have accelerated reshoring and demand for manufacturing logistics. Tenants often reconfigure footprints, changing lease-up and renewal probabilities, while diversified tenant exposure cushions volatility.
Zoning, land-use, and local politics
Warehouse siting for LXP draws community scrutiny over traffic and noise, with local hearings often delaying projects. Zoning boards and planning commissions can impose constraints or costly conditions that extend timelines and increase capex; US industrial vacancy was ~5% in 2024 (CBRE). LXP must navigate variances, design standards and truck-route restrictions; early community engagement reduces opposition risk.
- Community hearings often require traffic/noise studies
- Zoning conditions can add months and increase capex
- Truck‑route limits affect operating costs
- Early engagement lowers litigation and rezoning risk
Property tax regimes and fiscal pressure
Municipal budget gaps in 2024–25 prompted many jurisdictions to reassess values and raise mill rates, directly increasing property tax bills and compressing NOI on net‑leased assets where taxes are often passed through to tenants or capitalized into valuations.
Political appetite for commercial tax hikes varies widely by state and county, with swing counties more likely to approve incremental commercial rate increases during tight fiscal cycles; monitoring appeals cycles, levy timelines and reserve budgeting is essential for cash‑flow stress testing.
- Municipal reassessments: increased incidence in 2024–25
- NOI impact: property tax is a material line‑item for net‑leased assets
- Political variability: state/county differences drive tax risk
- Action: track appeals cycles and maintain budgeted reserves
Permitting delays, tax reassessments and federal policy tighten industrial NOI and timelines
Political drivers materially affect LXP: permitting cycles of 3–18 months (12–24 months post‑political shifts) and municipal tax reassessments rising in 2024–25 compress NOI; US industrial vacancy ~5% (2024, CBRE) supports rents but community opposition and zoning add capex and delays. Federal policy (IIJA $1.2T, $550B new; CHIPS $52B; IRA ~369B credits) shifts demand via onshoring and infrastructure.
| Factor | 2024–25 metric | Impact |
|---|---|---|
| Permitting | 3–18m (12–24m after shifts) | Timing risk, entitlements |
| Tax reassessments | ↑ incidence 2024–25 | NOI compression |
| Federal policy | IIJA $1.2T; CHIPS $52B; IRA ~$369B | Demand re‑rating, nearshoring |
What is included in the product
Detailed Word Document
Explores how external macro-environmental factors uniquely affect the LXP across six dimensions—Political, Economic, Social, Technological, Environmental, and Legal—with each category expanded into detailed sub‑points and business-specific examples. Backed by current data and forward-looking insights, the analysis supports executives, investors, and entrepreneurs in scenario planning, risk mitigation, and opportunity identification.
Customizable Excel Spreadsheet
The LXP PESTLE Analysis delivers a clean, visually segmented summary that quickly highlights external risks and opportunities, is editable for local context, and produces shareable, presentation-ready outputs to streamline strategic planning.
Economic factors
Interest rates and cap rates
REIT valuations and acquisition yields remain highly rate-sensitive as the 10-year Treasury sits near 4.3% and the federal funds target range is roughly 5.25–5.50%, pressuring cap rates and widening development spreads. Rising rates compress transaction multiples and margin on new builds, while falling rates can unlock accretive growth and M&A optionality. LXP’s debt maturity ladder and hedging approach bolster cash-flow resilience, and disciplined pricing helps protect NAV per share.
Industrial demand from e-commerce and manufacturing
Rising e-commerce penetration (~16% of US retail sales in 2024) and reshoring have boosted absorption of distribution and light-manufacturing space, keeping national logistics vacancy near 3.5% and annual rent growth around 5% in 2024. Strong tenant demand supports low vacancies, though cyclical slowdowns can delay expansions and renewals. Selective markets and longer, inflation‑linked lease terms balance growth with cash‑flow stability.
Construction costs and supply pipeline
Materials and labor inflation rose roughly 5% in 2024, lifting build-to-suit replacement costs and supporting achievable rents while compressing development margins by an estimated 200–400 basis points. Elevated replacement cost can bolster valuation but narrows new‑build returns. Sudden supply spikes—completions in some markets up ~20% in 2024—have softened rents and increased concessions. Phased delivery and strong pre‑leasing materially reduce oversupply exposure.
Tenant credit quality and default risk
Net-lease cash flows hinge on tenant solvency across cycles; CMBS and corporate credit spreads widened after the 2022 rate shock and, per S&P Global Ratings, CMBS delinquency edged near 3.2% in mid‑2025, making tenant credit assessment central to underwriting.
- Diversify by industry and geography to cut concentration risk
- Focus underwriting on retail, 3PLs, manufacturers sector health
- Monitor credit spreads and covenant strength continuously
Labor markets and logistics productivity
Tight labor markets, with US unemployment at 3.7% in Dec 2024, raise tenants’ operating costs and push site preferences toward areas with accessible labor. Markets with deep labor pools improve asset competitiveness. Wage growth near 4% in 2024 reshaped expansion and lease negotiations, while local incentives often offset labor cost pressures.
- Labor tightness: US unemployment 3.7% (Dec 2024)
- Wage trend: ~4% YoY (2024)
- Deep pools boost occupancy
- Incentives can neutralize labor premiums
Permitting delays, tax reassessments and federal policy tighten industrial NOI and timelines
Rates (10y 4.3%, fed funds 5.25–5.50%) pressure cap rates; logistics vacancy ~3.5% with ~5% rent growth (2024); materials/labor inflation ~5% compresses development margins; CMBS delinquency ~3.2% (mid‑2025) raises credit focus; unemployment 3.7% (Dec 2024), wage growth ~4% (2024) shifts site selection.
| Metric | Value |
|---|---|
| 10‑yr Treasury | 4.3% |
| Fed funds | 5.25–5.50% |
| Logistics vacancy | 3.5% |
| Rent growth (2024) | ~5% |
| Materials/labor inflation | ~5% |
| CMBS delinquency | 3.2% (mid‑2025) |
| Unemployment (Dec 2024) | 3.7% |
| Wage growth (2024) | ~4% |
Same Document Delivered
LXP PESTLE Analysis
The LXP PESTLE Analysis preview shown here is the exact document you’ll receive after purchase—fully formatted and ready to use. The content, structure, and layout visible are the final version with no placeholders or teasers. After payment you’ll instantly download this same professionally structured file, ready for immediate application in strategy or reporting.











