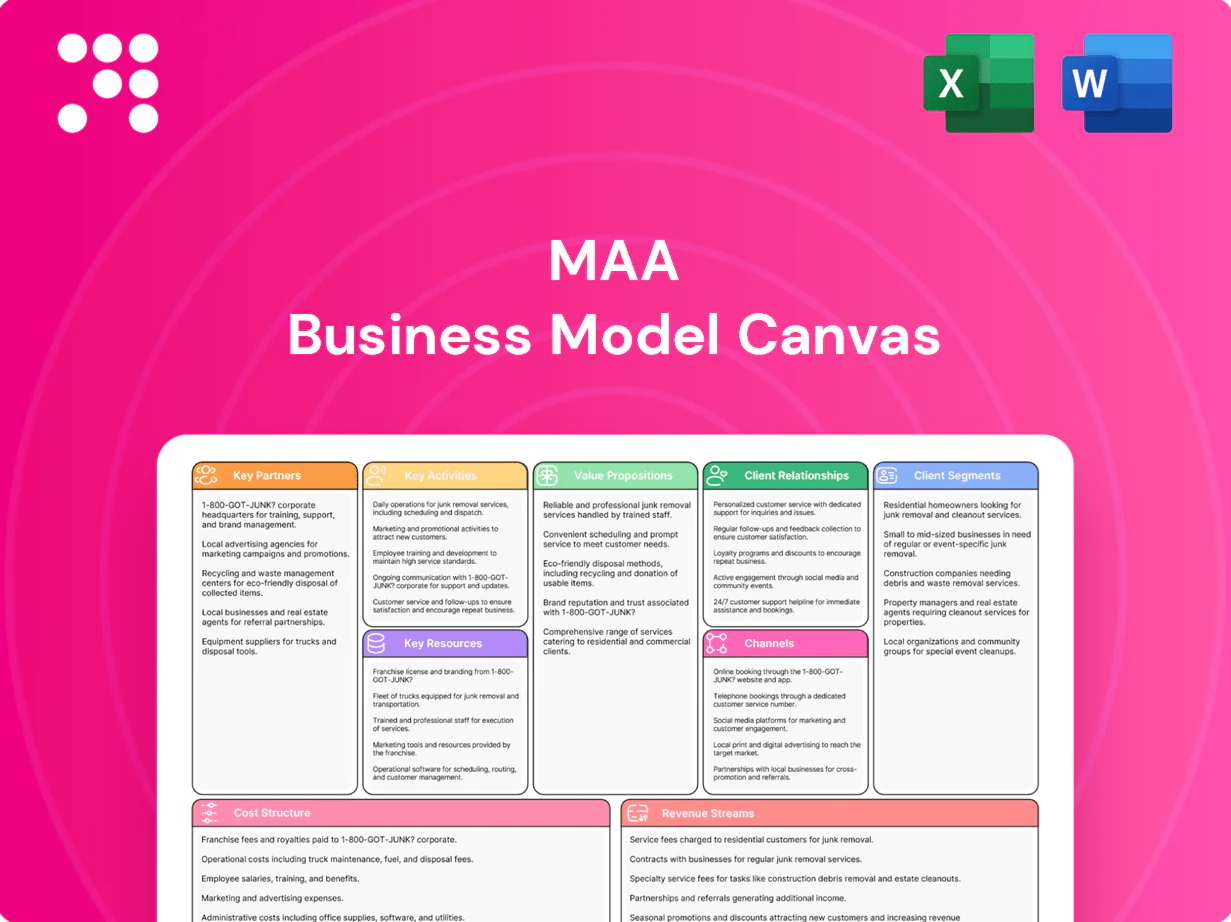
MAA Business Model Canvas

Unlock the strategic blueprint: Business Model Canvas to scale and capture market share
Unlock the full strategic blueprint behind MAA’s business model with our in-depth Business Model Canvas. This concise, actionable snapshot shows how MAA creates value, scales operations, and captures market share across key segments. Perfect for investors, advisors, and founders—download the complete Word & Excel canvases to benchmark, plan, and execute with confidence.
Partnerships

Sun Belt developers
MAA partners with Sun Belt developers to source, entitle, and co-develop multifamily in high-growth nodes where the South accounted for about 45% of U.S. population growth in 2023, accelerating rent and demand. Structured JVs align risk-sharing and expand pipeline optionality while preferred partners standardize quality and control delivery timelines. Local partners provide market intelligence and speed-to-market advantages, supporting roughly 65% of multifamily completions concentrated in Sun Belt metros in 2023.
General contractors
National and local general contractors execute MAA’s ground-up and redevelopment programs at scale, enabling rollout across multiple metros. MAA leverages competitive bidding and framework agreements to control cost and maintain quality. Safety, schedule adherence, and warranty performance are tracked with rigorous KPIs and third-party audits. Long-term GC relationships reduce execution risk and improve repeatable delivery across portfolio assets.

Lenders and capital markets
Banks, life companies, agency lenders and bond investors supply construction loans and permanent financing, leveraging a global bond market that exceeded $130 trillion in 2024 to absorb long-duration paper. Access to unsecured revolvers and term debt preserves acquisition agility and liquidity. Interest-rate hedging counterparties smooth cash flows. Capital partners enable balance-sheet flexibility across cycles.

Technology and proptech vendors
MAA partners with leasing platforms, IoT providers, and building-systems vendors to enable online leasing, dynamic pricing, smart access, and energy management. In 2024, 68% of MAA lease starts were digital and dynamic pricing contributed a 4–6% revenue uplift in comparable communities. Data partnerships improved underwriting signals and resident experience while vendor ecosystems cut operating friction and reduced costs by ~8–10%.
- Leasing platforms: 68% digital lease starts (2024)
- Dynamic pricing: +4–6% revenue per unit (2024)
- IoT & access: smart access & energy control
- Data partners: ~12% better underwriting signals
Local governments and utilities
Local governments and utilities are critical partners for MAA, supporting zoning, permitting, and incentive capture to shorten approval timelines and access the 30% federal clean-energy tax credit (ITC) available in 2024. Utility coordination funds infrastructure upgrades and efficiency programs to reduce operational costs and service interruptions. Ongoing engagement ensures code compliance, fair housing adherence, and faster project starts.
- Municipal approvals: faster permitting, incentive access
- Utilities: infrastructure upgrades, efficiency programs
- Compliance: building codes, fair housing, reduced disruptions
Sun Belt: 65% completions, 68% digital leases
MAA's key partnerships—Sun Belt developers, national/local GCs, lenders, tech vendors, and municipalities—drive sourcing, scalable execution, financing, digital leasing, and faster approvals. 2024 metrics: South = ~45% of US population growth (2023); 65% multifamily completions in Sun Belt (2023); 68% digital lease starts (2024); dynamic pricing +4–6% revenue; bond market $130T (2024); ITC 30% (2024).
| Partner | Role | 2024 Impact |
|---|---|---|
| Developers | Sourcing/entitlement | 65% Sun Belt completions |
| GCs | Execution | Repeatable delivery/KPIs |
| Lenders | Construction/permanent debt | $130T bond market |
| Tech Vendors | Leasing/ops | 68% digital leases; +4–6% rev |
| Municipalities | Permitting/incentives | 30% ITC access |
What is included in the product
 Detailed Word Document
A focused, pre-built Business Model Canvas for MAA that maps customer segments, channels, value propositions, revenue streams and key activities with real-world operational detail. Designed for investor presentations and strategic planning, it includes competitive advantage analysis, SWOT-linked insights, and clear narratives across the nine BMC blocks to support decision-making and validation.

 Customizable Excel Spreadsheet
High-level one-page MAA Business Model Canvas that saves hours of structuring and formatting while condensing strategy into a clean, editable snapshot for fast team alignment and decision-making.
Activities

Acquisition underwriting
Target assets in Sun Belt submarkets showing strong population and job inflows—the region captured roughly 60% of net domestic migration 2021–2023—prioritizing locations with outsized demand drivers. Conduct rigorous financial, physical, and legal diligence to validate value-creation levers and stress-test returns. Negotiate terms that meet return hurdles and risk controls, then close efficiently to secure pipeline opportunities.
Development and redevelopment
Develop and redevelop to deliver new communities and reposition existing assets to current standards across MAA's portfolio of about 111,000 apartment homes. Manage design, permitting, construction and lease-up phases with centralized project teams to shorten timelines and control cost. Prioritize amenities and unit finishes that drive rents and retention. Optimize capex to maximize portfolio-level ROI.

Property operations
Run leasing, maintenance, and resident services to MAA brand standards, targeting 2024 portfolio occupancy ~95% and stabilizing turnover near 40% annualized; apply revenue management, expense control, and preventative maintenance to protect same-store NOI. Monitor KPIs—occupancy, NOI margin, turnover—and ensure compliance, safety, and fair housing practices across 2024 operations.

Asset and portfolio management
Allocate capital across markets and life-cycle stages, shifting between development, stabilized and exit opportunities while adapting to the 2024 interest-rate backdrop (US federal funds ~5.25–5.50% in 2024). Recycle capital via selective dispositions and refinancings, conduct market-by-market strategy reviews and scenario planning, and optimize leverage, liquidity and dividend sustainability.
- Allocate: market & life-cycle
- Recycle: disposals & refinances
- Review: market-by-market scenarios
- Optimize: leverage, liquidity, dividends
ESG and risk management
Implement energy efficiency, water conservation and resilience upgrades across the portfolio—targeting ~20% site energy reduction and ~30% water savings per asset by 2028; govern vendor ethics, data privacy and resident safety via third-party audits and SLAs; insure assets and hedge financial exposures as commercial property insurance rose ~15% in 2023–24; report scope 1–3, water and safety metrics to stakeholders quarterly.
- Energy: target 20% reduction
- Water: target 30% savings
- Insurance: +15% premiums (2023–24)
- Reporting: quarterly scope 1–3 & safety
Sun Belt multifamily push: acquire 111k units, 95% occupancy, -20% energy by 2028
Target Sun Belt assets (MAA ~111,000 homes) via disciplined acquisition, diligence and efficient closings; prioritize markets with strong 2021–23 net domestic inflows (~60% to Sun Belt). Execute redevelopment and controlled capex to hit ~95% occupancy and ~40% turnover; manage leasing, maintenance and revenue management. Allocate and recycle capital amid 2024 fed funds ~5.25–5.50%, hedge exposures; pursue 20% site energy and 30% water savings by 2028.
| Metric | 2024/Target |
|---|---|
| Units | ~111,000 |
| Occupancy | ~95% |
| Turnover | ~40% annual |
| Fed funds | 5.25–5.50% |
| Energy target | −20% by 2028 |
| Water target | −30% by 2028 |
| Insurance trend | +15% (2023–24) |
What You See Is What You Get
Business Model Canvas
The MAA Business Model Canvas previewed here is the exact document you’ll receive after purchase, not a mockup or sample. Upon completing your order you’ll immediately get the full, ready-to-edit file with all sections and pages included. No surprises—what you see is what you’ll download and use.

Unlock the strategic blueprint: Business Model Canvas to scale and capture market share
Unlock the full strategic blueprint behind MAA’s business model with our in-depth Business Model Canvas. This concise, actionable snapshot shows how MAA creates value, scales operations, and captures market share across key segments. Perfect for investors, advisors, and founders—download the complete Word & Excel canvases to benchmark, plan, and execute with confidence.
Partnerships
Sun Belt developers
MAA partners with Sun Belt developers to source, entitle, and co-develop multifamily in high-growth nodes where the South accounted for about 45% of U.S. population growth in 2023, accelerating rent and demand. Structured JVs align risk-sharing and expand pipeline optionality while preferred partners standardize quality and control delivery timelines. Local partners provide market intelligence and speed-to-market advantages, supporting roughly 65% of multifamily completions concentrated in Sun Belt metros in 2023.
General contractors
National and local general contractors execute MAA’s ground-up and redevelopment programs at scale, enabling rollout across multiple metros. MAA leverages competitive bidding and framework agreements to control cost and maintain quality. Safety, schedule adherence, and warranty performance are tracked with rigorous KPIs and third-party audits. Long-term GC relationships reduce execution risk and improve repeatable delivery across portfolio assets.
Lenders and capital markets
Banks, life companies, agency lenders and bond investors supply construction loans and permanent financing, leveraging a global bond market that exceeded $130 trillion in 2024 to absorb long-duration paper. Access to unsecured revolvers and term debt preserves acquisition agility and liquidity. Interest-rate hedging counterparties smooth cash flows. Capital partners enable balance-sheet flexibility across cycles.
Technology and proptech vendors
MAA partners with leasing platforms, IoT providers, and building-systems vendors to enable online leasing, dynamic pricing, smart access, and energy management. In 2024, 68% of MAA lease starts were digital and dynamic pricing contributed a 4–6% revenue uplift in comparable communities. Data partnerships improved underwriting signals and resident experience while vendor ecosystems cut operating friction and reduced costs by ~8–10%.
- Leasing platforms: 68% digital lease starts (2024)
- Dynamic pricing: +4–6% revenue per unit (2024)
- IoT & access: smart access & energy control
- Data partners: ~12% better underwriting signals
Local governments and utilities
Local governments and utilities are critical partners for MAA, supporting zoning, permitting, and incentive capture to shorten approval timelines and access the 30% federal clean-energy tax credit (ITC) available in 2024. Utility coordination funds infrastructure upgrades and efficiency programs to reduce operational costs and service interruptions. Ongoing engagement ensures code compliance, fair housing adherence, and faster project starts.
- Municipal approvals: faster permitting, incentive access
- Utilities: infrastructure upgrades, efficiency programs
- Compliance: building codes, fair housing, reduced disruptions
Sun Belt: 65% completions, 68% digital leases
MAA's key partnerships—Sun Belt developers, national/local GCs, lenders, tech vendors, and municipalities—drive sourcing, scalable execution, financing, digital leasing, and faster approvals. 2024 metrics: South = ~45% of US population growth (2023); 65% multifamily completions in Sun Belt (2023); 68% digital lease starts (2024); dynamic pricing +4–6% revenue; bond market $130T (2024); ITC 30% (2024).
| Partner | Role | 2024 Impact |
|---|---|---|
| Developers | Sourcing/entitlement | 65% Sun Belt completions |
| GCs | Execution | Repeatable delivery/KPIs |
| Lenders | Construction/permanent debt | $130T bond market |
| Tech Vendors | Leasing/ops | 68% digital leases; +4–6% rev |
| Municipalities | Permitting/incentives | 30% ITC access |
What is included in the product
Detailed Word Document
A focused, pre-built Business Model Canvas for MAA that maps customer segments, channels, value propositions, revenue streams and key activities with real-world operational detail. Designed for investor presentations and strategic planning, it includes competitive advantage analysis, SWOT-linked insights, and clear narratives across the nine BMC blocks to support decision-making and validation.
Customizable Excel Spreadsheet
High-level one-page MAA Business Model Canvas that saves hours of structuring and formatting while condensing strategy into a clean, editable snapshot for fast team alignment and decision-making.
Activities
Acquisition underwriting
Target assets in Sun Belt submarkets showing strong population and job inflows—the region captured roughly 60% of net domestic migration 2021–2023—prioritizing locations with outsized demand drivers. Conduct rigorous financial, physical, and legal diligence to validate value-creation levers and stress-test returns. Negotiate terms that meet return hurdles and risk controls, then close efficiently to secure pipeline opportunities.
Development and redevelopment
Develop and redevelop to deliver new communities and reposition existing assets to current standards across MAA's portfolio of about 111,000 apartment homes. Manage design, permitting, construction and lease-up phases with centralized project teams to shorten timelines and control cost. Prioritize amenities and unit finishes that drive rents and retention. Optimize capex to maximize portfolio-level ROI.
Property operations
Run leasing, maintenance, and resident services to MAA brand standards, targeting 2024 portfolio occupancy ~95% and stabilizing turnover near 40% annualized; apply revenue management, expense control, and preventative maintenance to protect same-store NOI. Monitor KPIs—occupancy, NOI margin, turnover—and ensure compliance, safety, and fair housing practices across 2024 operations.
Asset and portfolio management
Allocate capital across markets and life-cycle stages, shifting between development, stabilized and exit opportunities while adapting to the 2024 interest-rate backdrop (US federal funds ~5.25–5.50% in 2024). Recycle capital via selective dispositions and refinancings, conduct market-by-market strategy reviews and scenario planning, and optimize leverage, liquidity and dividend sustainability.
- Allocate: market & life-cycle
- Recycle: disposals & refinances
- Review: market-by-market scenarios
- Optimize: leverage, liquidity, dividends
ESG and risk management
Implement energy efficiency, water conservation and resilience upgrades across the portfolio—targeting ~20% site energy reduction and ~30% water savings per asset by 2028; govern vendor ethics, data privacy and resident safety via third-party audits and SLAs; insure assets and hedge financial exposures as commercial property insurance rose ~15% in 2023–24; report scope 1–3, water and safety metrics to stakeholders quarterly.
- Energy: target 20% reduction
- Water: target 30% savings
- Insurance: +15% premiums (2023–24)
- Reporting: quarterly scope 1–3 & safety
Sun Belt multifamily push: acquire 111k units, 95% occupancy, -20% energy by 2028
Target Sun Belt assets (MAA ~111,000 homes) via disciplined acquisition, diligence and efficient closings; prioritize markets with strong 2021–23 net domestic inflows (~60% to Sun Belt). Execute redevelopment and controlled capex to hit ~95% occupancy and ~40% turnover; manage leasing, maintenance and revenue management. Allocate and recycle capital amid 2024 fed funds ~5.25–5.50%, hedge exposures; pursue 20% site energy and 30% water savings by 2028.
| Metric | 2024/Target |
|---|---|
| Units | ~111,000 |
| Occupancy | ~95% |
| Turnover | ~40% annual |
| Fed funds | 5.25–5.50% |
| Energy target | −20% by 2028 |
| Water target | −30% by 2028 |
| Insurance trend | +15% (2023–24) |
What You See Is What You Get
Business Model Canvas
The MAA Business Model Canvas previewed here is the exact document you’ll receive after purchase, not a mockup or sample. Upon completing your order you’ll immediately get the full, ready-to-edit file with all sections and pages included. No surprises—what you see is what you’ll download and use.
Original: $10.00
-65%$10.00
$3.50Description
Unlock the strategic blueprint: Business Model Canvas to scale and capture market share
Unlock the full strategic blueprint behind MAA’s business model with our in-depth Business Model Canvas. This concise, actionable snapshot shows how MAA creates value, scales operations, and captures market share across key segments. Perfect for investors, advisors, and founders—download the complete Word & Excel canvases to benchmark, plan, and execute with confidence.
Partnerships
Sun Belt developers
MAA partners with Sun Belt developers to source, entitle, and co-develop multifamily in high-growth nodes where the South accounted for about 45% of U.S. population growth in 2023, accelerating rent and demand. Structured JVs align risk-sharing and expand pipeline optionality while preferred partners standardize quality and control delivery timelines. Local partners provide market intelligence and speed-to-market advantages, supporting roughly 65% of multifamily completions concentrated in Sun Belt metros in 2023.
General contractors
National and local general contractors execute MAA’s ground-up and redevelopment programs at scale, enabling rollout across multiple metros. MAA leverages competitive bidding and framework agreements to control cost and maintain quality. Safety, schedule adherence, and warranty performance are tracked with rigorous KPIs and third-party audits. Long-term GC relationships reduce execution risk and improve repeatable delivery across portfolio assets.
Lenders and capital markets
Banks, life companies, agency lenders and bond investors supply construction loans and permanent financing, leveraging a global bond market that exceeded $130 trillion in 2024 to absorb long-duration paper. Access to unsecured revolvers and term debt preserves acquisition agility and liquidity. Interest-rate hedging counterparties smooth cash flows. Capital partners enable balance-sheet flexibility across cycles.
Technology and proptech vendors
MAA partners with leasing platforms, IoT providers, and building-systems vendors to enable online leasing, dynamic pricing, smart access, and energy management. In 2024, 68% of MAA lease starts were digital and dynamic pricing contributed a 4–6% revenue uplift in comparable communities. Data partnerships improved underwriting signals and resident experience while vendor ecosystems cut operating friction and reduced costs by ~8–10%.
- Leasing platforms: 68% digital lease starts (2024)
- Dynamic pricing: +4–6% revenue per unit (2024)
- IoT & access: smart access & energy control
- Data partners: ~12% better underwriting signals
Local governments and utilities
Local governments and utilities are critical partners for MAA, supporting zoning, permitting, and incentive capture to shorten approval timelines and access the 30% federal clean-energy tax credit (ITC) available in 2024. Utility coordination funds infrastructure upgrades and efficiency programs to reduce operational costs and service interruptions. Ongoing engagement ensures code compliance, fair housing adherence, and faster project starts.
- Municipal approvals: faster permitting, incentive access
- Utilities: infrastructure upgrades, efficiency programs
- Compliance: building codes, fair housing, reduced disruptions
Sun Belt: 65% completions, 68% digital leases
MAA's key partnerships—Sun Belt developers, national/local GCs, lenders, tech vendors, and municipalities—drive sourcing, scalable execution, financing, digital leasing, and faster approvals. 2024 metrics: South = ~45% of US population growth (2023); 65% multifamily completions in Sun Belt (2023); 68% digital lease starts (2024); dynamic pricing +4–6% revenue; bond market $130T (2024); ITC 30% (2024).
| Partner | Role | 2024 Impact |
|---|---|---|
| Developers | Sourcing/entitlement | 65% Sun Belt completions |
| GCs | Execution | Repeatable delivery/KPIs |
| Lenders | Construction/permanent debt | $130T bond market |
| Tech Vendors | Leasing/ops | 68% digital leases; +4–6% rev |
| Municipalities | Permitting/incentives | 30% ITC access |
What is included in the product
Detailed Word Document
A focused, pre-built Business Model Canvas for MAA that maps customer segments, channels, value propositions, revenue streams and key activities with real-world operational detail. Designed for investor presentations and strategic planning, it includes competitive advantage analysis, SWOT-linked insights, and clear narratives across the nine BMC blocks to support decision-making and validation.
Customizable Excel Spreadsheet
High-level one-page MAA Business Model Canvas that saves hours of structuring and formatting while condensing strategy into a clean, editable snapshot for fast team alignment and decision-making.
Activities
Acquisition underwriting
Target assets in Sun Belt submarkets showing strong population and job inflows—the region captured roughly 60% of net domestic migration 2021–2023—prioritizing locations with outsized demand drivers. Conduct rigorous financial, physical, and legal diligence to validate value-creation levers and stress-test returns. Negotiate terms that meet return hurdles and risk controls, then close efficiently to secure pipeline opportunities.
Development and redevelopment
Develop and redevelop to deliver new communities and reposition existing assets to current standards across MAA's portfolio of about 111,000 apartment homes. Manage design, permitting, construction and lease-up phases with centralized project teams to shorten timelines and control cost. Prioritize amenities and unit finishes that drive rents and retention. Optimize capex to maximize portfolio-level ROI.
Property operations
Run leasing, maintenance, and resident services to MAA brand standards, targeting 2024 portfolio occupancy ~95% and stabilizing turnover near 40% annualized; apply revenue management, expense control, and preventative maintenance to protect same-store NOI. Monitor KPIs—occupancy, NOI margin, turnover—and ensure compliance, safety, and fair housing practices across 2024 operations.
Asset and portfolio management
Allocate capital across markets and life-cycle stages, shifting between development, stabilized and exit opportunities while adapting to the 2024 interest-rate backdrop (US federal funds ~5.25–5.50% in 2024). Recycle capital via selective dispositions and refinancings, conduct market-by-market strategy reviews and scenario planning, and optimize leverage, liquidity and dividend sustainability.
- Allocate: market & life-cycle
- Recycle: disposals & refinances
- Review: market-by-market scenarios
- Optimize: leverage, liquidity, dividends
ESG and risk management
Implement energy efficiency, water conservation and resilience upgrades across the portfolio—targeting ~20% site energy reduction and ~30% water savings per asset by 2028; govern vendor ethics, data privacy and resident safety via third-party audits and SLAs; insure assets and hedge financial exposures as commercial property insurance rose ~15% in 2023–24; report scope 1–3, water and safety metrics to stakeholders quarterly.
- Energy: target 20% reduction
- Water: target 30% savings
- Insurance: +15% premiums (2023–24)
- Reporting: quarterly scope 1–3 & safety
Sun Belt multifamily push: acquire 111k units, 95% occupancy, -20% energy by 2028
Target Sun Belt assets (MAA ~111,000 homes) via disciplined acquisition, diligence and efficient closings; prioritize markets with strong 2021–23 net domestic inflows (~60% to Sun Belt). Execute redevelopment and controlled capex to hit ~95% occupancy and ~40% turnover; manage leasing, maintenance and revenue management. Allocate and recycle capital amid 2024 fed funds ~5.25–5.50%, hedge exposures; pursue 20% site energy and 30% water savings by 2028.
| Metric | 2024/Target |
|---|---|
| Units | ~111,000 |
| Occupancy | ~95% |
| Turnover | ~40% annual |
| Fed funds | 5.25–5.50% |
| Energy target | −20% by 2028 |
| Water target | −30% by 2028 |
| Insurance trend | +15% (2023–24) |
What You See Is What You Get
Business Model Canvas
The MAA Business Model Canvas previewed here is the exact document you’ll receive after purchase, not a mockup or sample. Upon completing your order you’ll immediately get the full, ready-to-edit file with all sections and pages included. No surprises—what you see is what you’ll download and use.











