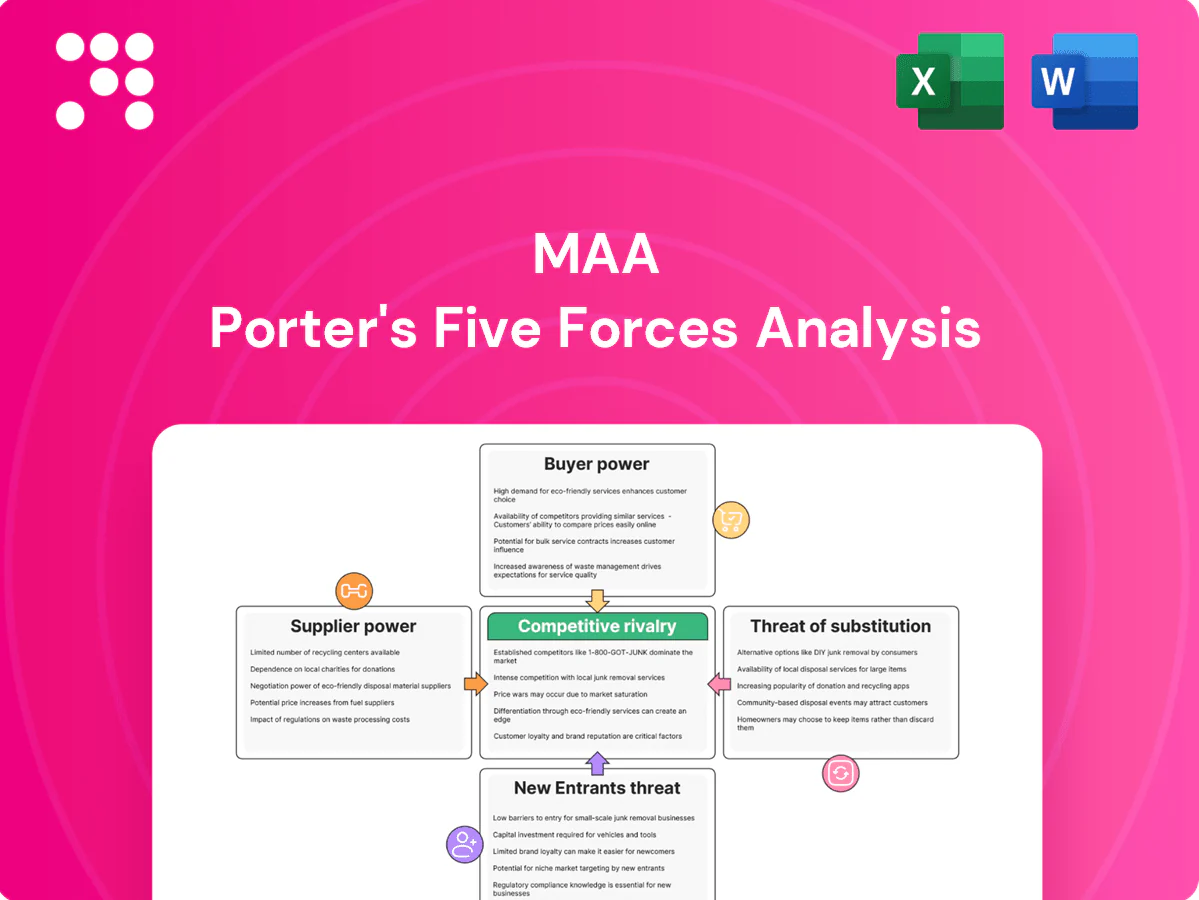
MAA Porter's Five Forces Analysis

From Overview to Strategy Blueprint
MAA's Porter’s Five Forces snapshot highlights tenant bargaining, supplier constraints, and competitive pressure from REIT peers while noting moderate threat from new entrants and substitutes. It outlines how macro trends shape rent growth and operational margins. Strategic levers and risks are summarized to inform quick decisions. This brief snapshot only scratches the surface—unlock the full Porter’s Five Forces Analysis for detailed ratings, visuals, and actionable insights.
Suppliers Bargaining Power

Fragmented contractor and materials base
MAA sources from numerous general contractors and material suppliers across the Sun Belt, limiting individual vendor leverage; with a Sun Belt footprint of over 100,000 apartment homes as of 2024, competitive bidding and alternative suppliers keep input pricing in check. Local market tightness can spike costs during building booms, though MAA’s scale purchasing partially offsets volatility.
Utilities and insurance exert leverage
Monopoly utilities and regional insurers can pass through rate increases, constraining MAA margins; in 2024 utilities continued to push higher delivery charges while commercial insurance pricing remained elevated after 2023 hard-market increases. Insurance premiums and property taxes are difficult to negotiate down; some costs can be partially recovered through rent but with timing lags of several quarters. Geographic diversification across MAA markets softens localized supplier shocks.

Skilled labor availability is cyclical
Labor for maintenance, renovations, and development tightens in high-growth markets; BLS data showed construction employment near 7.6 million in 2024, keeping crews scarce. Wage inflation and subcontractor shortages pushed project costs and timelines higher, with some markets seeing bid premiums above pre-pandemic levels. MAA’s scale and steady pipeline help secure crews, but peaks in activity still pressure schedules and budgets.

Proptech and software switching costs moderate
Proptech platforms for property management, leasing, and IoT create integration and training frictions that increase vendor stickiness, yet intense competition keeps pricing pressure; global proptech investment in 2024 topped $10B, accelerating modular offerings. MAA can renegotiate contracts or swap modules over time as APIs and data portability reduce long-term lock-in.
- stickiness: integration + training
- competition: downward pricing pressure
- swap-modules: contract flexibility
- APIs/data-portability: lower vendor lock-in
Capital providers influence development pace
Capital providers—debt markets and JV equity partners—directly shape MAA development pace by setting cost of capital and feasibility; rising rates (US federal funds target ended 2024 at 5.25–5.50%) tightened underwriting and loan terms, slowing new starts. Large REIT access to unsecured debt and public equity (US REIT market cap ~1.1 trillion in 2024) reduces dependence on any single lender and increases negotiating leverage.
- Debt market tightening: higher rates, stricter covenants
- JV equity: affects feasibility and sponsor dilution
- REIT access: lowers single-lender risk
- Capital depth: strengthens pricing and timing leverage
Moderate supplier power: scale (100,000+ units) vs tight labor (7.6M)
MAA's supplier power is moderate: scale across 100,000+ Sun Belt homes (2024) and competitive bidding limit vendor leverage, but local construction booms and monopoly utilities/insurers raise input costs. Labor tightness (construction employment ~7.6M in 2024) and elevated insurance prices compress margins. Deep capital access and REIT scale bolster negotiating leverage.
| Factor | 2024 metric |
|---|---|
| Portfolio scale | 100,000+ units |
| Construction employment | ~7.6M |
| Fed funds | 5.25–5.50% |
| REIT market cap | ~$1.1T |
What is included in the product
 Detailed Word Document
Comprehensive Porter's Five Forces analysis tailored exclusively for MAA, uncovering the key competitive drivers, buyer and supplier power, threat of substitutes and new entrants, and disruptive forces that shape pricing and profitability; fully editable for integration into investor decks, strategy reports, or academic work.

 Customizable Excel Spreadsheet
One-sheet MAA Porter’s Five Forces that visualizes competitive pressure with a customizable spider chart, no macros, copy-ready layouts and easy data swaps—perfect for rapid strategic decisions and boardroom decks.
Customers Bargaining Power

Many renters, moderate switching costs
Individual residents number over 40 million renter households in the US (Census Bureau 2023), limiting collective bargaining power. Moving frictions—security deposits often equal one month’s rent and Moving.com (2023) reports average moving costs of ~1,300 local / ~4,900 long-distance—create moderate switching costs. Industry lease renewal rates near 55% (2023 NMHC) show renewal incentives can effectively retain tenants despite competitive nearby listings.
Price sensitivity varies by submarket
Sun Belt affordability drives strong demand with rent growth roughly 4–6% in many metros in 2024, but renters show sensitivity when landlords raise rents beyond local wage gains. Class A units are less price‑elastic than Class B, which face higher churn and vacancy risk. Concessions and amenity bundles—often reducing effective rents by 3–5%—help retain tenants, while a 2024 unemployment rate near 3.7% underpins overall willingness to pay.

Information transparency heightens leverage
Listing platforms and reviews make price and quality comparisons immediate; industry data in 2024 shows over 80% of renters begin their search online. Prospects leverage competing offers during negotiations, pressuring concessions and fees. Reputation and service scores materially affect leasing velocity, with listings featuring rich digital content and high ratings leasing significantly faster. Digital leasing cuts search frictions and shortens time-to-lease.

Amenity and location differentiation
Proximity to jobs, schools and transit drives perceived value: properties near major transit nodes typically command 5–10% rent premiums in 2024, and access to employment centers correlates with higher occupancy. Robust amenity sets (co‑working, fitness, EV charging) justify 5–15% premiums and reduce tenant bargaining. Older assets without upgrades face rent discounts and higher turnover; targeted capex in 2024 raised retention and mix by ~8–12% in industry surveys.
- Transit premium: 5–10% (2024)
- Amenity uplift: 5–15% (2024)
- Capex retention lift: ~8–12% (2024)
- Older asset risk: rent discounts, higher turnover
Lease terms and flexibility requests
- Shorter terms: higher turnover, flexible pricing
- Pet-friendly: 70% US pet ownership (APPA 2023–24)
- Furnished: premium vs. vacancy trade-off
- Corporate leases: stability, lower yield volatility
Renter leverage moderate: over 40M, renewals ~55%, rents 4–6%
Customer bargaining is moderate: >40M renter households dilute coordination, while ~55% lease renewals (NMHC 2023) and moving frictions raise switching costs. Strong Sun Belt demand (rent growth 4–6% in 2024) and amenity/locational premiums (5–15%) reduce price sensitivity for higher‑quality units. Digital listings (>80% search online in 2024) and reputation increase negotiating leverage for informed renters.
| Metric | Value (source) |
|---|---|
| Renter households | >40M (Census 2023) |
| Lease renewals | ~55% (NMHC 2023) |
| Rent growth | 4–6% (2024) |
| Online search | >80% (2024) |
| Pet ownership | ~70% (APPA 2023–24) |
Full Version Awaits
MAA Porter's Five Forces Analysis
This preview shows the exact MAA Porter's Five Forces Analysis you'll receive immediately after purchase—no placeholders or samples. The file is fully formatted, professionally written, and ready for download and use the moment you buy. You're viewing the complete deliverable, identical to the document provided after payment.

From Overview to Strategy Blueprint
MAA's Porter’s Five Forces snapshot highlights tenant bargaining, supplier constraints, and competitive pressure from REIT peers while noting moderate threat from new entrants and substitutes. It outlines how macro trends shape rent growth and operational margins. Strategic levers and risks are summarized to inform quick decisions. This brief snapshot only scratches the surface—unlock the full Porter’s Five Forces Analysis for detailed ratings, visuals, and actionable insights.
Suppliers Bargaining Power
Fragmented contractor and materials base
MAA sources from numerous general contractors and material suppliers across the Sun Belt, limiting individual vendor leverage; with a Sun Belt footprint of over 100,000 apartment homes as of 2024, competitive bidding and alternative suppliers keep input pricing in check. Local market tightness can spike costs during building booms, though MAA’s scale purchasing partially offsets volatility.
Utilities and insurance exert leverage
Monopoly utilities and regional insurers can pass through rate increases, constraining MAA margins; in 2024 utilities continued to push higher delivery charges while commercial insurance pricing remained elevated after 2023 hard-market increases. Insurance premiums and property taxes are difficult to negotiate down; some costs can be partially recovered through rent but with timing lags of several quarters. Geographic diversification across MAA markets softens localized supplier shocks.
Skilled labor availability is cyclical
Labor for maintenance, renovations, and development tightens in high-growth markets; BLS data showed construction employment near 7.6 million in 2024, keeping crews scarce. Wage inflation and subcontractor shortages pushed project costs and timelines higher, with some markets seeing bid premiums above pre-pandemic levels. MAA’s scale and steady pipeline help secure crews, but peaks in activity still pressure schedules and budgets.
Proptech and software switching costs moderate
Proptech platforms for property management, leasing, and IoT create integration and training frictions that increase vendor stickiness, yet intense competition keeps pricing pressure; global proptech investment in 2024 topped $10B, accelerating modular offerings. MAA can renegotiate contracts or swap modules over time as APIs and data portability reduce long-term lock-in.
- stickiness: integration + training
- competition: downward pricing pressure
- swap-modules: contract flexibility
- APIs/data-portability: lower vendor lock-in
Capital providers influence development pace
Capital providers—debt markets and JV equity partners—directly shape MAA development pace by setting cost of capital and feasibility; rising rates (US federal funds target ended 2024 at 5.25–5.50%) tightened underwriting and loan terms, slowing new starts. Large REIT access to unsecured debt and public equity (US REIT market cap ~1.1 trillion in 2024) reduces dependence on any single lender and increases negotiating leverage.
- Debt market tightening: higher rates, stricter covenants
- JV equity: affects feasibility and sponsor dilution
- REIT access: lowers single-lender risk
- Capital depth: strengthens pricing and timing leverage
Moderate supplier power: scale (100,000+ units) vs tight labor (7.6M)
MAA's supplier power is moderate: scale across 100,000+ Sun Belt homes (2024) and competitive bidding limit vendor leverage, but local construction booms and monopoly utilities/insurers raise input costs. Labor tightness (construction employment ~7.6M in 2024) and elevated insurance prices compress margins. Deep capital access and REIT scale bolster negotiating leverage.
| Factor | 2024 metric |
|---|---|
| Portfolio scale | 100,000+ units |
| Construction employment | ~7.6M |
| Fed funds | 5.25–5.50% |
| REIT market cap | ~$1.1T |
What is included in the product
Detailed Word Document
Comprehensive Porter's Five Forces analysis tailored exclusively for MAA, uncovering the key competitive drivers, buyer and supplier power, threat of substitutes and new entrants, and disruptive forces that shape pricing and profitability; fully editable for integration into investor decks, strategy reports, or academic work.
Customizable Excel Spreadsheet
One-sheet MAA Porter’s Five Forces that visualizes competitive pressure with a customizable spider chart, no macros, copy-ready layouts and easy data swaps—perfect for rapid strategic decisions and boardroom decks.
Customers Bargaining Power
Many renters, moderate switching costs
Individual residents number over 40 million renter households in the US (Census Bureau 2023), limiting collective bargaining power. Moving frictions—security deposits often equal one month’s rent and Moving.com (2023) reports average moving costs of ~1,300 local / ~4,900 long-distance—create moderate switching costs. Industry lease renewal rates near 55% (2023 NMHC) show renewal incentives can effectively retain tenants despite competitive nearby listings.
Price sensitivity varies by submarket
Sun Belt affordability drives strong demand with rent growth roughly 4–6% in many metros in 2024, but renters show sensitivity when landlords raise rents beyond local wage gains. Class A units are less price‑elastic than Class B, which face higher churn and vacancy risk. Concessions and amenity bundles—often reducing effective rents by 3–5%—help retain tenants, while a 2024 unemployment rate near 3.7% underpins overall willingness to pay.
Information transparency heightens leverage
Listing platforms and reviews make price and quality comparisons immediate; industry data in 2024 shows over 80% of renters begin their search online. Prospects leverage competing offers during negotiations, pressuring concessions and fees. Reputation and service scores materially affect leasing velocity, with listings featuring rich digital content and high ratings leasing significantly faster. Digital leasing cuts search frictions and shortens time-to-lease.
Amenity and location differentiation
Proximity to jobs, schools and transit drives perceived value: properties near major transit nodes typically command 5–10% rent premiums in 2024, and access to employment centers correlates with higher occupancy. Robust amenity sets (co‑working, fitness, EV charging) justify 5–15% premiums and reduce tenant bargaining. Older assets without upgrades face rent discounts and higher turnover; targeted capex in 2024 raised retention and mix by ~8–12% in industry surveys.
- Transit premium: 5–10% (2024)
- Amenity uplift: 5–15% (2024)
- Capex retention lift: ~8–12% (2024)
- Older asset risk: rent discounts, higher turnover
Lease terms and flexibility requests
- Shorter terms: higher turnover, flexible pricing
- Pet-friendly: 70% US pet ownership (APPA 2023–24)
- Furnished: premium vs. vacancy trade-off
- Corporate leases: stability, lower yield volatility
Renter leverage moderate: over 40M, renewals ~55%, rents 4–6%
Customer bargaining is moderate: >40M renter households dilute coordination, while ~55% lease renewals (NMHC 2023) and moving frictions raise switching costs. Strong Sun Belt demand (rent growth 4–6% in 2024) and amenity/locational premiums (5–15%) reduce price sensitivity for higher‑quality units. Digital listings (>80% search online in 2024) and reputation increase negotiating leverage for informed renters.
| Metric | Value (source) |
|---|---|
| Renter households | >40M (Census 2023) |
| Lease renewals | ~55% (NMHC 2023) |
| Rent growth | 4–6% (2024) |
| Online search | >80% (2024) |
| Pet ownership | ~70% (APPA 2023–24) |
Full Version Awaits
MAA Porter's Five Forces Analysis
This preview shows the exact MAA Porter's Five Forces Analysis you'll receive immediately after purchase—no placeholders or samples. The file is fully formatted, professionally written, and ready for download and use the moment you buy. You're viewing the complete deliverable, identical to the document provided after payment.
Description
From Overview to Strategy Blueprint
MAA's Porter’s Five Forces snapshot highlights tenant bargaining, supplier constraints, and competitive pressure from REIT peers while noting moderate threat from new entrants and substitutes. It outlines how macro trends shape rent growth and operational margins. Strategic levers and risks are summarized to inform quick decisions. This brief snapshot only scratches the surface—unlock the full Porter’s Five Forces Analysis for detailed ratings, visuals, and actionable insights.
Suppliers Bargaining Power
Fragmented contractor and materials base
MAA sources from numerous general contractors and material suppliers across the Sun Belt, limiting individual vendor leverage; with a Sun Belt footprint of over 100,000 apartment homes as of 2024, competitive bidding and alternative suppliers keep input pricing in check. Local market tightness can spike costs during building booms, though MAA’s scale purchasing partially offsets volatility.
Utilities and insurance exert leverage
Monopoly utilities and regional insurers can pass through rate increases, constraining MAA margins; in 2024 utilities continued to push higher delivery charges while commercial insurance pricing remained elevated after 2023 hard-market increases. Insurance premiums and property taxes are difficult to negotiate down; some costs can be partially recovered through rent but with timing lags of several quarters. Geographic diversification across MAA markets softens localized supplier shocks.
Skilled labor availability is cyclical
Labor for maintenance, renovations, and development tightens in high-growth markets; BLS data showed construction employment near 7.6 million in 2024, keeping crews scarce. Wage inflation and subcontractor shortages pushed project costs and timelines higher, with some markets seeing bid premiums above pre-pandemic levels. MAA’s scale and steady pipeline help secure crews, but peaks in activity still pressure schedules and budgets.
Proptech and software switching costs moderate
Proptech platforms for property management, leasing, and IoT create integration and training frictions that increase vendor stickiness, yet intense competition keeps pricing pressure; global proptech investment in 2024 topped $10B, accelerating modular offerings. MAA can renegotiate contracts or swap modules over time as APIs and data portability reduce long-term lock-in.
- stickiness: integration + training
- competition: downward pricing pressure
- swap-modules: contract flexibility
- APIs/data-portability: lower vendor lock-in
Capital providers influence development pace
Capital providers—debt markets and JV equity partners—directly shape MAA development pace by setting cost of capital and feasibility; rising rates (US federal funds target ended 2024 at 5.25–5.50%) tightened underwriting and loan terms, slowing new starts. Large REIT access to unsecured debt and public equity (US REIT market cap ~1.1 trillion in 2024) reduces dependence on any single lender and increases negotiating leverage.
- Debt market tightening: higher rates, stricter covenants
- JV equity: affects feasibility and sponsor dilution
- REIT access: lowers single-lender risk
- Capital depth: strengthens pricing and timing leverage
Moderate supplier power: scale (100,000+ units) vs tight labor (7.6M)
MAA's supplier power is moderate: scale across 100,000+ Sun Belt homes (2024) and competitive bidding limit vendor leverage, but local construction booms and monopoly utilities/insurers raise input costs. Labor tightness (construction employment ~7.6M in 2024) and elevated insurance prices compress margins. Deep capital access and REIT scale bolster negotiating leverage.
| Factor | 2024 metric |
|---|---|
| Portfolio scale | 100,000+ units |
| Construction employment | ~7.6M |
| Fed funds | 5.25–5.50% |
| REIT market cap | ~$1.1T |
What is included in the product
Detailed Word Document
Comprehensive Porter's Five Forces analysis tailored exclusively for MAA, uncovering the key competitive drivers, buyer and supplier power, threat of substitutes and new entrants, and disruptive forces that shape pricing and profitability; fully editable for integration into investor decks, strategy reports, or academic work.
Customizable Excel Spreadsheet
One-sheet MAA Porter’s Five Forces that visualizes competitive pressure with a customizable spider chart, no macros, copy-ready layouts and easy data swaps—perfect for rapid strategic decisions and boardroom decks.
Customers Bargaining Power
Many renters, moderate switching costs
Individual residents number over 40 million renter households in the US (Census Bureau 2023), limiting collective bargaining power. Moving frictions—security deposits often equal one month’s rent and Moving.com (2023) reports average moving costs of ~1,300 local / ~4,900 long-distance—create moderate switching costs. Industry lease renewal rates near 55% (2023 NMHC) show renewal incentives can effectively retain tenants despite competitive nearby listings.
Price sensitivity varies by submarket
Sun Belt affordability drives strong demand with rent growth roughly 4–6% in many metros in 2024, but renters show sensitivity when landlords raise rents beyond local wage gains. Class A units are less price‑elastic than Class B, which face higher churn and vacancy risk. Concessions and amenity bundles—often reducing effective rents by 3–5%—help retain tenants, while a 2024 unemployment rate near 3.7% underpins overall willingness to pay.
Information transparency heightens leverage
Listing platforms and reviews make price and quality comparisons immediate; industry data in 2024 shows over 80% of renters begin their search online. Prospects leverage competing offers during negotiations, pressuring concessions and fees. Reputation and service scores materially affect leasing velocity, with listings featuring rich digital content and high ratings leasing significantly faster. Digital leasing cuts search frictions and shortens time-to-lease.
Amenity and location differentiation
Proximity to jobs, schools and transit drives perceived value: properties near major transit nodes typically command 5–10% rent premiums in 2024, and access to employment centers correlates with higher occupancy. Robust amenity sets (co‑working, fitness, EV charging) justify 5–15% premiums and reduce tenant bargaining. Older assets without upgrades face rent discounts and higher turnover; targeted capex in 2024 raised retention and mix by ~8–12% in industry surveys.
- Transit premium: 5–10% (2024)
- Amenity uplift: 5–15% (2024)
- Capex retention lift: ~8–12% (2024)
- Older asset risk: rent discounts, higher turnover
Lease terms and flexibility requests
- Shorter terms: higher turnover, flexible pricing
- Pet-friendly: 70% US pet ownership (APPA 2023–24)
- Furnished: premium vs. vacancy trade-off
- Corporate leases: stability, lower yield volatility
Renter leverage moderate: over 40M, renewals ~55%, rents 4–6%
Customer bargaining is moderate: >40M renter households dilute coordination, while ~55% lease renewals (NMHC 2023) and moving frictions raise switching costs. Strong Sun Belt demand (rent growth 4–6% in 2024) and amenity/locational premiums (5–15%) reduce price sensitivity for higher‑quality units. Digital listings (>80% search online in 2024) and reputation increase negotiating leverage for informed renters.
| Metric | Value (source) |
|---|---|
| Renter households | >40M (Census 2023) |
| Lease renewals | ~55% (NMHC 2023) |
| Rent growth | 4–6% (2024) |
| Online search | >80% (2024) |
| Pet ownership | ~70% (APPA 2023–24) |
Full Version Awaits
MAA Porter's Five Forces Analysis
This preview shows the exact MAA Porter's Five Forces Analysis you'll receive immediately after purchase—no placeholders or samples. The file is fully formatted, professionally written, and ready for download and use the moment you buy. You're viewing the complete deliverable, identical to the document provided after payment.











