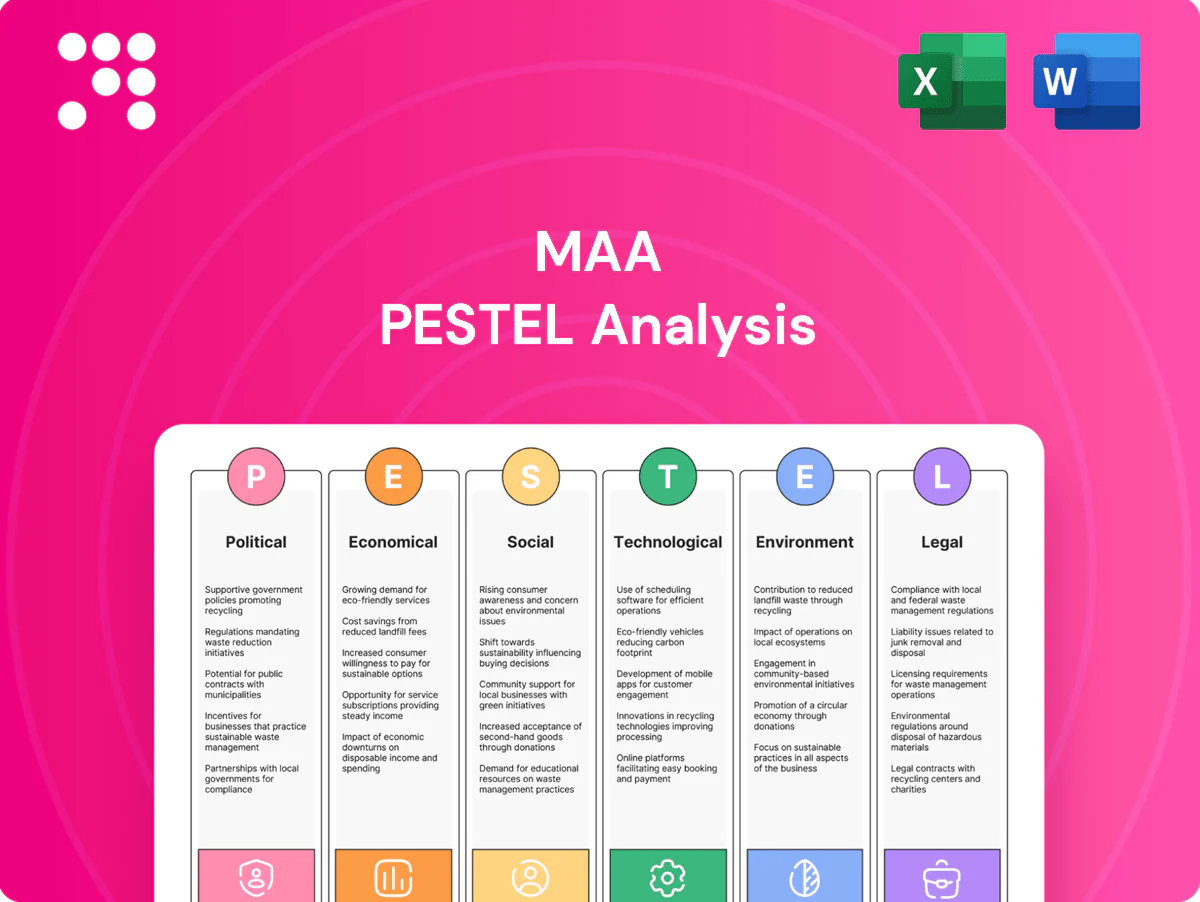
MAA PESTLE Analysis

Your Competitive Advantage Starts with This Report
Discover how political shifts, economic cycles, social trends, technological advances, legal changes, and environmental pressures are shaping MAA’s strategic outlook. This concise PESTLE snapshot highlights risks and opportunities you can act on today. Ideal for investors and strategists seeking clarity. Purchase the full PESTLE analysis to access detailed, actionable insights instantly.
Political factors

Sun Belt policy shifts
MAA’s Sun Belt-heavy footprint—about 135,000 apartment homes concentrated in Southern states—means divergent state and municipal priorities materially affect returns. Incentives for housing supply, infrastructure, and workforce attraction (tax credits, expedited permitting) can cut lease-up times and boost NOI. Political turnover, however, can tighten zoning or reduce development incentives, raising project risk. Monitoring state capital agendas and city council dynamics is critical.
Zoning and land-use approvals
Local planning boards control density, height, parking and mixed-use permissions, and faster approvals—reducing carrying costs often estimated at 5–10% annually—enable timely deliveries and higher IRRs. Restrictive rules delay projects and cut ROI; pro-housing reforms such as upzoning transit corridors have expanded pipelines in multiple markets. Community opposition and ballot initiatives add execution uncertainty and timeline risk.

Property tax policy
Sun Belt municipalities rely heavily on property taxes to fund growth, and reassessments during expansion cycles have driven operating expense pressure for owners like MAA; nationally municipal property tax collections exceeded 600 billion in 2024, concentrating strain in fast-growing counties. Caps, abatements and PILOTs—which can cut effective tax bills for projects by as much as half—mitigate volatility and improve feasibility. Policy shifts can reallocate cost burdens across jurisdictions where MAA operates, altering project returns and valuation assumptions.

Federal housing priorities
Federal support for housing supply, vouchers, and LIHTC shifts demand and rent collections at the margin; about 2.3 million households used Housing Choice Vouchers in 2024 (HUD). Infrastructure spending that improves submarket access boosts occupancy and pricing power, while federal austerity or program cuts would soften demand among cost-sensitive renters. GSE multifamily lending stances materially affect market liquidity and cap rates.
- Vouchers: ≈2.3M households (HUD, 2024)
- LIHTC: tens of thousands of units annually
- Infrastructure: improves submarket access → occupancy/pricing
- GSE multifamily policy → liquidity/cap-rate impact
Disaster preparedness funding
Political commitment to resiliency funding dictates Sun Belt asset protection and insurance availability; NOAA reported 28 US billion-dollar weather/climate disasters in 2023, underscoring exposure. Grants and matching funds subsidize flood, wind and heat mitigation, while weak funding raises uninsured tail risks for physical assets and communities. Coordination with state emergency agencies shortens recovery timelines.
- Grants/matches: lower retrofit costs, raise resilience
- Weak funding: higher uninsured tail risk, fiscal strain
- State coordination: faster post-event recovery and claims processing
Sun Belt ~135k makes tax, voucher & climate shifts material to NOI
MAA’s Sun Belt footprint (~135,000 homes) makes state/local policy shifts (tax, zoning, permitting) directly material to NOI and development risk. Property-tax pressure—US municipal collections >$600B in 2024—raises operating costs; abatements/PILOTs can halve bills. Federal support (≈2.3M voucher households, 2024) and GSE multifamily stances influence demand and liquidity. Climate funding and 28 B‑$ disasters in 2023 affect insurance and capex.
| Metric | 2023–2024 |
|---|---|
| MAA units | ≈135,000 |
| Vouchers (HUD) | ≈2.3M households (2024) |
| Municipal property tax | >$600B (2024) |
| US climate disasters | 28 events, 2023 |
What is included in the product
 Detailed Word Document
Explores how external macro-environmental factors uniquely affect the MAA across six dimensions—Political, Economic, Social, Technological, Environmental, and Legal—backed by data and current trends to identify threats and opportunities. Designed for executives and investors, it offers forward-looking insights, detailed sub-points, and clean formatting ready for business plans, pitch decks, or reports.

 Customizable Excel Spreadsheet
A concise, visually segmented MAA PESTLE summary that relieves meeting-prep friction by being presentation-ready, easily shareable across teams, and editable with region- or business-specific notes to streamline planning and external-risk discussions.
Economic factors

Interest rate environment
REIT valuations and development yields remain highly rate sensitive: with the Fed funds target near 5.25–5.50% (mid‑2025) and 10‑yr Treasury around 4.0%, cap rates have risen ~150–200 bps vs 2021, pressuring NAVs and raising financing costs; conversely lower rates would widen acquisition/development spreads. Debt laddering and >75% fixed‑rate coverage help stabilize AFFO, while Fed trajectory dictates capital allocation pacing.
Sun Belt migration and job growth
Population inflows and employment expansion across Sun Belt metros underpin rent growth and occupancy—7 of the top 10 fastest-growing U.S. metros were in the Sun Belt (Census 2023), while Dallas-Fort Worth and Phoenix posted roughly 3% annual job gains in 2024 (BLS). Corporate relocations and diversified industry bases strengthen fundamentals, but hiring or migration slowdowns would temper pricing power. Market selection within metros becomes a key alpha driver.

Housing affordability gap
Limited for-sale affordability (median existing-home price ~$392k in 2024, 30-yr mortgage ~6.8%) pushes households into rentals, sustaining demand as rents rose ~3% y/y in 2024 while wages grew ~4.5%; renewal capture and turnover hinge on that spread. Sharp affordability declines raise delinquency and political pressure; balanced pricing and amenity tiers improve retention.

Construction costs and supply
Rising materials (+6% in 2024), labor (+4%) and insurance (+10%) tightened development IRRs, forcing higher hurdle rates on new multifamily projects; elevated new deliveries (~250,000 units in 2024) softened rent growth in some Sunbelt submarkets. As pipelines peak and taper, absorption typically normalizes over 12–18 months and pricing recovers; phasing and selective starts mitigate cycle risk.
- Materials +6% (2024)
- Labor +4% (2024)
- Insurance +10% (2024)
- Multifamily deliveries ~250k (2024)
- Absorption normalizes 12–18 months
Capital markets liquidity
Access to unsecured bonds, bank lines, and equity capital drives strategic flexibility; 10-year Treasury ~4.3% (mid-2025) and investment-grade spreads ~110–140 bps support issuance. Tight spreads and active CMBS/GSE markets—CMBS issuance ~60B in 2024—enable accretive transactions, while periodic dislocations force asset recycling and slower growth. Maintaining investment-grade metrics preserves optionality for lower-cost funding.
- Access: unsecured bonds, bank lines, equity
- Market: 10y ~4.3%, IG spreads 110–140 bps
- CMBS/GSE: ~60B issuance in 2024
- Strategy: preserve IG metrics to retain optionality
Sun Belt ~135k makes tax, voucher & climate shifts material to NOI
Fed funds ~5.25–5.50% (mid‑2025) and 10y ~4.3% lift cap rates ~+150–200bps vs 2021, pressuring NAVs and raising financing costs; debt laddering and >75% fixed coverage stabilize AFFO. Sun Belt job/population gains drive rent/occupancy while for‑sale unaffordability (median home ~$392k, 30y ~6.8%) sustains rental demand. Development margins squeezed by materials +6%, labor +4%, insurance +10% (2024); deliveries ~250k and CMBS issuance ~60B (2024).
| Metric | Value |
|---|---|
| Fed funds | 5.25–5.50% |
| 10‑yr Treasury | ~4.3% |
| Cap rate shift vs 2021 | +150–200bps |
| Multifamily deliveries (2024) | ~250k |
| CMBS issuance (2024) | ~60B |
Preview Before You Purchase
MAA PESTLE Analysis
The preview of the MAA PESTLE Analysis is the exact, fully formatted document you’ll receive after purchase—professionally structured and ready to use. No placeholders or teasers: the content, layout and insights shown here are the final file available for immediate download upon payment.

Your Competitive Advantage Starts with This Report
Discover how political shifts, economic cycles, social trends, technological advances, legal changes, and environmental pressures are shaping MAA’s strategic outlook. This concise PESTLE snapshot highlights risks and opportunities you can act on today. Ideal for investors and strategists seeking clarity. Purchase the full PESTLE analysis to access detailed, actionable insights instantly.
Political factors
Sun Belt policy shifts
MAA’s Sun Belt-heavy footprint—about 135,000 apartment homes concentrated in Southern states—means divergent state and municipal priorities materially affect returns. Incentives for housing supply, infrastructure, and workforce attraction (tax credits, expedited permitting) can cut lease-up times and boost NOI. Political turnover, however, can tighten zoning or reduce development incentives, raising project risk. Monitoring state capital agendas and city council dynamics is critical.
Zoning and land-use approvals
Local planning boards control density, height, parking and mixed-use permissions, and faster approvals—reducing carrying costs often estimated at 5–10% annually—enable timely deliveries and higher IRRs. Restrictive rules delay projects and cut ROI; pro-housing reforms such as upzoning transit corridors have expanded pipelines in multiple markets. Community opposition and ballot initiatives add execution uncertainty and timeline risk.
Property tax policy
Sun Belt municipalities rely heavily on property taxes to fund growth, and reassessments during expansion cycles have driven operating expense pressure for owners like MAA; nationally municipal property tax collections exceeded 600 billion in 2024, concentrating strain in fast-growing counties. Caps, abatements and PILOTs—which can cut effective tax bills for projects by as much as half—mitigate volatility and improve feasibility. Policy shifts can reallocate cost burdens across jurisdictions where MAA operates, altering project returns and valuation assumptions.
Federal housing priorities
Federal support for housing supply, vouchers, and LIHTC shifts demand and rent collections at the margin; about 2.3 million households used Housing Choice Vouchers in 2024 (HUD). Infrastructure spending that improves submarket access boosts occupancy and pricing power, while federal austerity or program cuts would soften demand among cost-sensitive renters. GSE multifamily lending stances materially affect market liquidity and cap rates.
- Vouchers: ≈2.3M households (HUD, 2024)
- LIHTC: tens of thousands of units annually
- Infrastructure: improves submarket access → occupancy/pricing
- GSE multifamily policy → liquidity/cap-rate impact
Disaster preparedness funding
Political commitment to resiliency funding dictates Sun Belt asset protection and insurance availability; NOAA reported 28 US billion-dollar weather/climate disasters in 2023, underscoring exposure. Grants and matching funds subsidize flood, wind and heat mitigation, while weak funding raises uninsured tail risks for physical assets and communities. Coordination with state emergency agencies shortens recovery timelines.
- Grants/matches: lower retrofit costs, raise resilience
- Weak funding: higher uninsured tail risk, fiscal strain
- State coordination: faster post-event recovery and claims processing
Sun Belt ~135k makes tax, voucher & climate shifts material to NOI
MAA’s Sun Belt footprint (~135,000 homes) makes state/local policy shifts (tax, zoning, permitting) directly material to NOI and development risk. Property-tax pressure—US municipal collections >$600B in 2024—raises operating costs; abatements/PILOTs can halve bills. Federal support (≈2.3M voucher households, 2024) and GSE multifamily stances influence demand and liquidity. Climate funding and 28 B‑$ disasters in 2023 affect insurance and capex.
| Metric | 2023–2024 |
|---|---|
| MAA units | ≈135,000 |
| Vouchers (HUD) | ≈2.3M households (2024) |
| Municipal property tax | >$600B (2024) |
| US climate disasters | 28 events, 2023 |
What is included in the product
Detailed Word Document
Explores how external macro-environmental factors uniquely affect the MAA across six dimensions—Political, Economic, Social, Technological, Environmental, and Legal—backed by data and current trends to identify threats and opportunities. Designed for executives and investors, it offers forward-looking insights, detailed sub-points, and clean formatting ready for business plans, pitch decks, or reports.
Customizable Excel Spreadsheet
A concise, visually segmented MAA PESTLE summary that relieves meeting-prep friction by being presentation-ready, easily shareable across teams, and editable with region- or business-specific notes to streamline planning and external-risk discussions.
Economic factors
Interest rate environment
REIT valuations and development yields remain highly rate sensitive: with the Fed funds target near 5.25–5.50% (mid‑2025) and 10‑yr Treasury around 4.0%, cap rates have risen ~150–200 bps vs 2021, pressuring NAVs and raising financing costs; conversely lower rates would widen acquisition/development spreads. Debt laddering and >75% fixed‑rate coverage help stabilize AFFO, while Fed trajectory dictates capital allocation pacing.
Sun Belt migration and job growth
Population inflows and employment expansion across Sun Belt metros underpin rent growth and occupancy—7 of the top 10 fastest-growing U.S. metros were in the Sun Belt (Census 2023), while Dallas-Fort Worth and Phoenix posted roughly 3% annual job gains in 2024 (BLS). Corporate relocations and diversified industry bases strengthen fundamentals, but hiring or migration slowdowns would temper pricing power. Market selection within metros becomes a key alpha driver.
Housing affordability gap
Limited for-sale affordability (median existing-home price ~$392k in 2024, 30-yr mortgage ~6.8%) pushes households into rentals, sustaining demand as rents rose ~3% y/y in 2024 while wages grew ~4.5%; renewal capture and turnover hinge on that spread. Sharp affordability declines raise delinquency and political pressure; balanced pricing and amenity tiers improve retention.
Construction costs and supply
Rising materials (+6% in 2024), labor (+4%) and insurance (+10%) tightened development IRRs, forcing higher hurdle rates on new multifamily projects; elevated new deliveries (~250,000 units in 2024) softened rent growth in some Sunbelt submarkets. As pipelines peak and taper, absorption typically normalizes over 12–18 months and pricing recovers; phasing and selective starts mitigate cycle risk.
- Materials +6% (2024)
- Labor +4% (2024)
- Insurance +10% (2024)
- Multifamily deliveries ~250k (2024)
- Absorption normalizes 12–18 months
Capital markets liquidity
Access to unsecured bonds, bank lines, and equity capital drives strategic flexibility; 10-year Treasury ~4.3% (mid-2025) and investment-grade spreads ~110–140 bps support issuance. Tight spreads and active CMBS/GSE markets—CMBS issuance ~60B in 2024—enable accretive transactions, while periodic dislocations force asset recycling and slower growth. Maintaining investment-grade metrics preserves optionality for lower-cost funding.
- Access: unsecured bonds, bank lines, equity
- Market: 10y ~4.3%, IG spreads 110–140 bps
- CMBS/GSE: ~60B issuance in 2024
- Strategy: preserve IG metrics to retain optionality
Sun Belt ~135k makes tax, voucher & climate shifts material to NOI
Fed funds ~5.25–5.50% (mid‑2025) and 10y ~4.3% lift cap rates ~+150–200bps vs 2021, pressuring NAVs and raising financing costs; debt laddering and >75% fixed coverage stabilize AFFO. Sun Belt job/population gains drive rent/occupancy while for‑sale unaffordability (median home ~$392k, 30y ~6.8%) sustains rental demand. Development margins squeezed by materials +6%, labor +4%, insurance +10% (2024); deliveries ~250k and CMBS issuance ~60B (2024).
| Metric | Value |
|---|---|
| Fed funds | 5.25–5.50% |
| 10‑yr Treasury | ~4.3% |
| Cap rate shift vs 2021 | +150–200bps |
| Multifamily deliveries (2024) | ~250k |
| CMBS issuance (2024) | ~60B |
Preview Before You Purchase
MAA PESTLE Analysis
The preview of the MAA PESTLE Analysis is the exact, fully formatted document you’ll receive after purchase—professionally structured and ready to use. No placeholders or teasers: the content, layout and insights shown here are the final file available for immediate download upon payment.
Description
Your Competitive Advantage Starts with This Report
Discover how political shifts, economic cycles, social trends, technological advances, legal changes, and environmental pressures are shaping MAA’s strategic outlook. This concise PESTLE snapshot highlights risks and opportunities you can act on today. Ideal for investors and strategists seeking clarity. Purchase the full PESTLE analysis to access detailed, actionable insights instantly.
Political factors
Sun Belt policy shifts
MAA’s Sun Belt-heavy footprint—about 135,000 apartment homes concentrated in Southern states—means divergent state and municipal priorities materially affect returns. Incentives for housing supply, infrastructure, and workforce attraction (tax credits, expedited permitting) can cut lease-up times and boost NOI. Political turnover, however, can tighten zoning or reduce development incentives, raising project risk. Monitoring state capital agendas and city council dynamics is critical.
Zoning and land-use approvals
Local planning boards control density, height, parking and mixed-use permissions, and faster approvals—reducing carrying costs often estimated at 5–10% annually—enable timely deliveries and higher IRRs. Restrictive rules delay projects and cut ROI; pro-housing reforms such as upzoning transit corridors have expanded pipelines in multiple markets. Community opposition and ballot initiatives add execution uncertainty and timeline risk.
Property tax policy
Sun Belt municipalities rely heavily on property taxes to fund growth, and reassessments during expansion cycles have driven operating expense pressure for owners like MAA; nationally municipal property tax collections exceeded 600 billion in 2024, concentrating strain in fast-growing counties. Caps, abatements and PILOTs—which can cut effective tax bills for projects by as much as half—mitigate volatility and improve feasibility. Policy shifts can reallocate cost burdens across jurisdictions where MAA operates, altering project returns and valuation assumptions.
Federal housing priorities
Federal support for housing supply, vouchers, and LIHTC shifts demand and rent collections at the margin; about 2.3 million households used Housing Choice Vouchers in 2024 (HUD). Infrastructure spending that improves submarket access boosts occupancy and pricing power, while federal austerity or program cuts would soften demand among cost-sensitive renters. GSE multifamily lending stances materially affect market liquidity and cap rates.
- Vouchers: ≈2.3M households (HUD, 2024)
- LIHTC: tens of thousands of units annually
- Infrastructure: improves submarket access → occupancy/pricing
- GSE multifamily policy → liquidity/cap-rate impact
Disaster preparedness funding
Political commitment to resiliency funding dictates Sun Belt asset protection and insurance availability; NOAA reported 28 US billion-dollar weather/climate disasters in 2023, underscoring exposure. Grants and matching funds subsidize flood, wind and heat mitigation, while weak funding raises uninsured tail risks for physical assets and communities. Coordination with state emergency agencies shortens recovery timelines.
- Grants/matches: lower retrofit costs, raise resilience
- Weak funding: higher uninsured tail risk, fiscal strain
- State coordination: faster post-event recovery and claims processing
Sun Belt ~135k makes tax, voucher & climate shifts material to NOI
MAA’s Sun Belt footprint (~135,000 homes) makes state/local policy shifts (tax, zoning, permitting) directly material to NOI and development risk. Property-tax pressure—US municipal collections >$600B in 2024—raises operating costs; abatements/PILOTs can halve bills. Federal support (≈2.3M voucher households, 2024) and GSE multifamily stances influence demand and liquidity. Climate funding and 28 B‑$ disasters in 2023 affect insurance and capex.
| Metric | 2023–2024 |
|---|---|
| MAA units | ≈135,000 |
| Vouchers (HUD) | ≈2.3M households (2024) |
| Municipal property tax | >$600B (2024) |
| US climate disasters | 28 events, 2023 |
What is included in the product
Detailed Word Document
Explores how external macro-environmental factors uniquely affect the MAA across six dimensions—Political, Economic, Social, Technological, Environmental, and Legal—backed by data and current trends to identify threats and opportunities. Designed for executives and investors, it offers forward-looking insights, detailed sub-points, and clean formatting ready for business plans, pitch decks, or reports.
Customizable Excel Spreadsheet
A concise, visually segmented MAA PESTLE summary that relieves meeting-prep friction by being presentation-ready, easily shareable across teams, and editable with region- or business-specific notes to streamline planning and external-risk discussions.
Economic factors
Interest rate environment
REIT valuations and development yields remain highly rate sensitive: with the Fed funds target near 5.25–5.50% (mid‑2025) and 10‑yr Treasury around 4.0%, cap rates have risen ~150–200 bps vs 2021, pressuring NAVs and raising financing costs; conversely lower rates would widen acquisition/development spreads. Debt laddering and >75% fixed‑rate coverage help stabilize AFFO, while Fed trajectory dictates capital allocation pacing.
Sun Belt migration and job growth
Population inflows and employment expansion across Sun Belt metros underpin rent growth and occupancy—7 of the top 10 fastest-growing U.S. metros were in the Sun Belt (Census 2023), while Dallas-Fort Worth and Phoenix posted roughly 3% annual job gains in 2024 (BLS). Corporate relocations and diversified industry bases strengthen fundamentals, but hiring or migration slowdowns would temper pricing power. Market selection within metros becomes a key alpha driver.
Housing affordability gap
Limited for-sale affordability (median existing-home price ~$392k in 2024, 30-yr mortgage ~6.8%) pushes households into rentals, sustaining demand as rents rose ~3% y/y in 2024 while wages grew ~4.5%; renewal capture and turnover hinge on that spread. Sharp affordability declines raise delinquency and political pressure; balanced pricing and amenity tiers improve retention.
Construction costs and supply
Rising materials (+6% in 2024), labor (+4%) and insurance (+10%) tightened development IRRs, forcing higher hurdle rates on new multifamily projects; elevated new deliveries (~250,000 units in 2024) softened rent growth in some Sunbelt submarkets. As pipelines peak and taper, absorption typically normalizes over 12–18 months and pricing recovers; phasing and selective starts mitigate cycle risk.
- Materials +6% (2024)
- Labor +4% (2024)
- Insurance +10% (2024)
- Multifamily deliveries ~250k (2024)
- Absorption normalizes 12–18 months
Capital markets liquidity
Access to unsecured bonds, bank lines, and equity capital drives strategic flexibility; 10-year Treasury ~4.3% (mid-2025) and investment-grade spreads ~110–140 bps support issuance. Tight spreads and active CMBS/GSE markets—CMBS issuance ~60B in 2024—enable accretive transactions, while periodic dislocations force asset recycling and slower growth. Maintaining investment-grade metrics preserves optionality for lower-cost funding.
- Access: unsecured bonds, bank lines, equity
- Market: 10y ~4.3%, IG spreads 110–140 bps
- CMBS/GSE: ~60B issuance in 2024
- Strategy: preserve IG metrics to retain optionality
Sun Belt ~135k makes tax, voucher & climate shifts material to NOI
Fed funds ~5.25–5.50% (mid‑2025) and 10y ~4.3% lift cap rates ~+150–200bps vs 2021, pressuring NAVs and raising financing costs; debt laddering and >75% fixed coverage stabilize AFFO. Sun Belt job/population gains drive rent/occupancy while for‑sale unaffordability (median home ~$392k, 30y ~6.8%) sustains rental demand. Development margins squeezed by materials +6%, labor +4%, insurance +10% (2024); deliveries ~250k and CMBS issuance ~60B (2024).
| Metric | Value |
|---|---|
| Fed funds | 5.25–5.50% |
| 10‑yr Treasury | ~4.3% |
| Cap rate shift vs 2021 | +150–200bps |
| Multifamily deliveries (2024) | ~250k |
| CMBS issuance (2024) | ~60B |
Preview Before You Purchase
MAA PESTLE Analysis
The preview of the MAA PESTLE Analysis is the exact, fully formatted document you’ll receive after purchase—professionally structured and ready to use. No placeholders or teasers: the content, layout and insights shown here are the final file available for immediate download upon payment.











