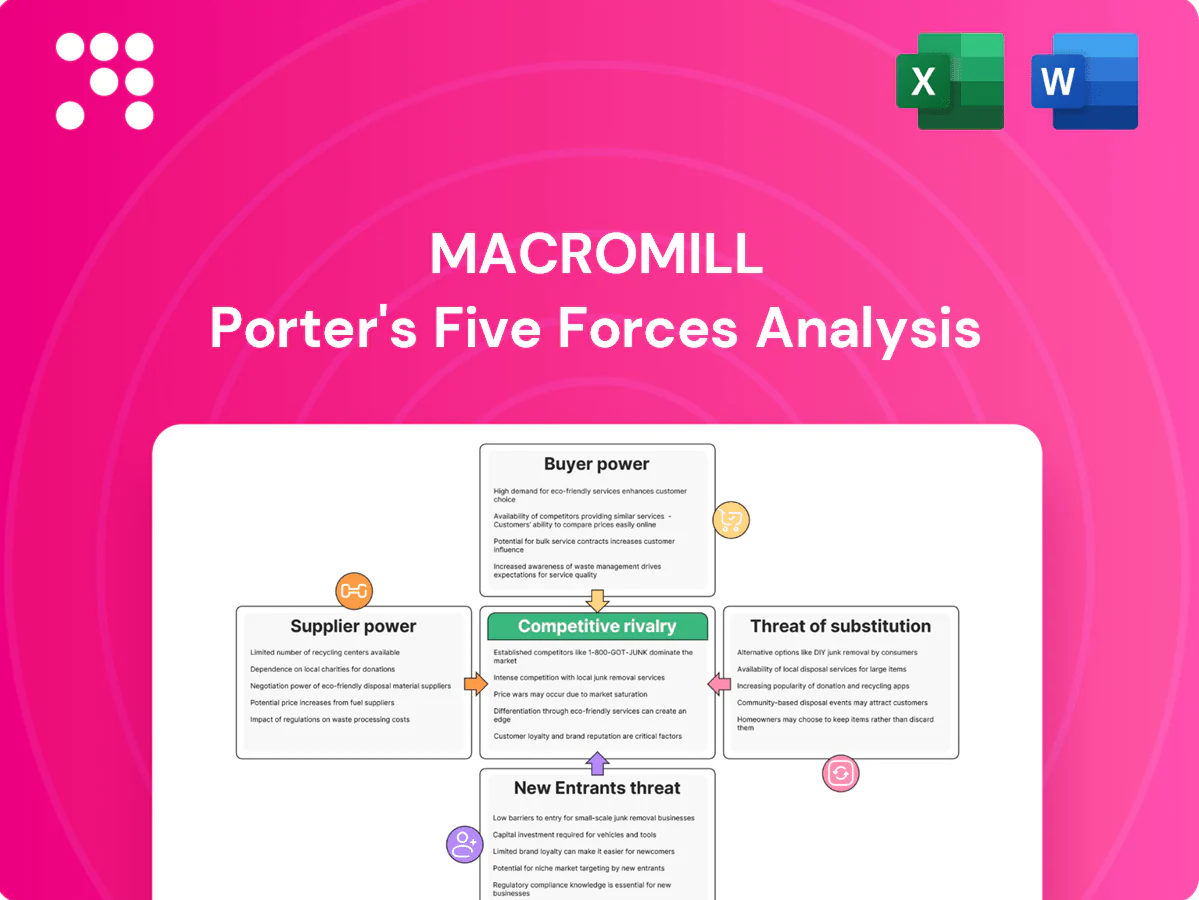
Macromill Porter's Five Forces Analysis

Don't Miss the Bigger Picture
Macromill's leading digital market research platform faces strong buyer bargaining and growing substitute threats from low-cost DIY analytics. Supplier power and regulatory shifts moderately pressure margins, while barriers from data scale and client relationships limit new entrants. This brief snapshot only scratches the surface. Unlock the full Porter's Five Forces Analysis to explore Macromill’s competitive dynamics, market pressures, and strategic advantages in detail.
Suppliers Bargaining Power

Dependence on online panels
Macromill’s dependence on large, high-quality respondent pools gives panel providers and aggregators pricing leverage; top global panel networks exceed 10 million respondents, and niche B2B/HNW/healthcare samples remain scarce, raising supplier power. Incentive inflation and 2024 fraud-prevention spend growth (industry up ~12% year-on-year) further shift bargaining power to panel sources. Building proprietary panels and multi-sourcing reduces this risk.
Cloud and data infrastructure
Reliance on hyperscalers concentrates supplier power: in 2024 AWS held ~32% share, Azure ~23% and Google Cloud ~11% (Synergy Research), making compute, storage and AI services supplier-driven. Egress fees (commonly $0.05–0.12/GB) and committed-spend contracts plus proprietary managed services create high switching frictions. Major hyperscaler outages in 2023–24 caused multi-hour SLA hits, risking margins when cloud is 15–25% of IT spend. Hybrid/multi-cloud architectures and FinOps discipline (typical savings 20–30%) help rebalance negotiations.

Third‑party data and identity
APIs from ad platforms, data brokers and ID‑graph providers are critical for targeting and validation, and 2024 estimates show Google and Meta control roughly 60% of global digital ad spend, concentrating supplier power. Policy shifts — privacy reforms, signal loss and tightened API access in 2024 — have raised integration costs and supplier leverage. Few alternatives exist for walled‑garden data, constraining Macromill’s options. Investing in first‑party linkages and model‑based enrichment reduces this dependency and mitigates risk.

Specialized software tools
- Switching costs: high
- License impact: material on TCO
- Interoperability: lock-in risk
- Mitigation: open standards, internal dev
Compliance and legal services
Compliance and legal services (GDPR/CCPA, data residency, consent management) force Macromill to rely on specialized vendors and counsel, boosting supplier pricing power as regulatory complexity rises; IBM’s 2023 Cost of a Data Breach Report puts average breach costs at $4.45M, underscoring audit and breach‑readiness value. Certification audits and recurring readiness programs create steady outsourced spend, while building in‑house privacy ops and automation can reduce vendor dependence over time.
- Regulation drivers: GDPR/CCPA, data residency, consent
- Cost signal: $4.45M average breach cost (IBM 2023)
- Recurring suppliers: audits, breach readiness, legal counsel
- Mitigation: invest in privacy ops + automation to cut supplier reliance
Supplier power up: panels scarce, hyperscalers concentrated, ads at 60%
Macromill faces elevated supplier power: panel providers and niche samples are scarce while incentive costs and fraud‑prevention spend rose ~12% y/y in 2024. Hyperscalers concentrate infrastructure risk (AWS 32%, Azure 23%, Google 11% share, 2024) with egress fees $0.05–0.12/GB and cloud at 15–25% of IT spend. Data walled gardens control ~60% of ad spend, raising integration costs; panels, multi‑cloud and first‑party links mitigate leverage.
| Supplier | Key metric | 2024 figure | Mitigation |
|---|---|---|---|
| Panel providers | Sample scarcity | Top nets >10M respondents | Proprietary panels |
| Hyperscalers | Market share | AWS 32% Azure 23% GCP 11% | Multi‑cloud, FinOps |
| Ad platforms | Ad spend control | ~60% Google+Meta | First‑party data |
| Compliance vendors | Breach cost signal | $4.45M avg (IBM 2023) | Privacy ops |
What is included in the product
 Detailed Word Document
Tailored Porter’s Five Forces analysis for Macromill, uncovering competitive rivalry, buyer and supplier power, threat of new entrants and substitutes, and regulatory drivers; highlights disruptive trends, pricing pressures, and barriers that protect or expose the company’s market position.

 Customizable Excel Spreadsheet
A one-sheet Macromill Porter's Five Forces summary that visualizes strategic pressure with an editable radar chart and customizable scores for quick decision-making. Duplicate scenario tabs, swap in your own data without macros, and drop the clean layout straight into pitch decks or reports.
Customers Bargaining Power

Enterprise procurement leverage
In 2024 large multinationals ran centralized RFPs, enforced rate cards and demanded volume discounts, often bundling multi-country scope to push unit prices down. Preferred vendor lists concentrated spend and heightened competition for suppliers. Articulating multi-year value and outcome-based narratives became essential to defend pricing and secure longer-term agreements.
Moderate switching costs
Buyers can shift projects to rivals with modest transition pain, increasing their bargaining power, yet Macromill’s longitudinal trackers, benchmarks and embedded dashboards create stickiness that moderates churn. Data continuity and consistent methodology become clear negotiation levers when clients demand comparable time-series results. Deeper integration into client workflows and APIs raises effective switching costs by tying insights into decision processes.

Price sensitivity in discretionary spend
Insights budgets fluctuate with macro cycles, and buyers become highly price-conscious—client RFPs often demand fixed-bid and performance SLAs, with procurement driving 20–30% of contracts toward fixed-price or outcome-based models in 2024. Pressure intensifies on commoditized surveys, compressing margins by roughly 10–15% as buyers shop on price. Packaging advisory and analytics with fieldwork lets Macromill capture premium fees and protect revenue per project.

Demand for speed and quality
Clients demand rapid turnaround and high data integrity; in the $90B market research industry (2024 ESOMAR estimate) failure on either front triggers vendor shifts and contract penalties or re-bids. Buyers use SLA clauses and competitive tendering to enforce standards, increasing customer bargaining power. Investing in automation and stricter QC preserves negotiating leverage and reduces churn.
- Speed-driven switching: SLA enforcement
- Quality risk: re-bids/penalties
- Defense: automation + QC
Alternative data familiarity
Many clients in 2024 now run first‑party analytics, CDPs and experimentation platforms, boosting buyer leverage as they understand alternative data sources and measurement tradeoffs. Buyers split budgets across vendors to A/B test value, increasing negotiation clout. Showing triangulation and clear ROI attribution is essential to retain share.
- 2024: ~61% firms report CDP use
- ~68% run experimentation or testing programs
- ROI attribution reduces churn
2024: 20–30% fixed contracts compress margins 10–15% in $90B market
In 2024 buyers centralized RFPs and procurement pushed 20–30% of contracts to fixed/outcome models, compressing margins ~10–15% within the $90B market research sector. Macromill’s trackers, dashboards and APIs raise switching costs, but 61% CDP and 68% experimentation adoption boost buyer leverage. Bundled analytics+fieldwork defends premium pricing and reduces churn.
| Metric | 2024 |
|---|---|
| Market size (ESOMAR) | $90B |
| Fixed/outcome contracts | 20–30% |
| Margin compression on commoditized work | 10–15% |
| CDP adoption | 61% |
| Experimentation programs | 68% |
Preview the Actual Deliverable
Macromill Porter's Five Forces Analysis
This preview shows the exact Macromill Porter’s Five Forces analysis you'll receive immediately after purchase—no surprises or placeholders. The document displayed is fully formatted and ready for download and use the moment you buy. You're viewing the complete, professionally written file and will have instant access to this identical deliverable after payment.

Don't Miss the Bigger Picture
Macromill's leading digital market research platform faces strong buyer bargaining and growing substitute threats from low-cost DIY analytics. Supplier power and regulatory shifts moderately pressure margins, while barriers from data scale and client relationships limit new entrants. This brief snapshot only scratches the surface. Unlock the full Porter's Five Forces Analysis to explore Macromill’s competitive dynamics, market pressures, and strategic advantages in detail.
Suppliers Bargaining Power
Dependence on online panels
Macromill’s dependence on large, high-quality respondent pools gives panel providers and aggregators pricing leverage; top global panel networks exceed 10 million respondents, and niche B2B/HNW/healthcare samples remain scarce, raising supplier power. Incentive inflation and 2024 fraud-prevention spend growth (industry up ~12% year-on-year) further shift bargaining power to panel sources. Building proprietary panels and multi-sourcing reduces this risk.
Cloud and data infrastructure
Reliance on hyperscalers concentrates supplier power: in 2024 AWS held ~32% share, Azure ~23% and Google Cloud ~11% (Synergy Research), making compute, storage and AI services supplier-driven. Egress fees (commonly $0.05–0.12/GB) and committed-spend contracts plus proprietary managed services create high switching frictions. Major hyperscaler outages in 2023–24 caused multi-hour SLA hits, risking margins when cloud is 15–25% of IT spend. Hybrid/multi-cloud architectures and FinOps discipline (typical savings 20–30%) help rebalance negotiations.
Third‑party data and identity
APIs from ad platforms, data brokers and ID‑graph providers are critical for targeting and validation, and 2024 estimates show Google and Meta control roughly 60% of global digital ad spend, concentrating supplier power. Policy shifts — privacy reforms, signal loss and tightened API access in 2024 — have raised integration costs and supplier leverage. Few alternatives exist for walled‑garden data, constraining Macromill’s options. Investing in first‑party linkages and model‑based enrichment reduces this dependency and mitigates risk.
Specialized software tools
- Switching costs: high
- License impact: material on TCO
- Interoperability: lock-in risk
- Mitigation: open standards, internal dev
Compliance and legal services
Compliance and legal services (GDPR/CCPA, data residency, consent management) force Macromill to rely on specialized vendors and counsel, boosting supplier pricing power as regulatory complexity rises; IBM’s 2023 Cost of a Data Breach Report puts average breach costs at $4.45M, underscoring audit and breach‑readiness value. Certification audits and recurring readiness programs create steady outsourced spend, while building in‑house privacy ops and automation can reduce vendor dependence over time.
- Regulation drivers: GDPR/CCPA, data residency, consent
- Cost signal: $4.45M average breach cost (IBM 2023)
- Recurring suppliers: audits, breach readiness, legal counsel
- Mitigation: invest in privacy ops + automation to cut supplier reliance
Supplier power up: panels scarce, hyperscalers concentrated, ads at 60%
Macromill faces elevated supplier power: panel providers and niche samples are scarce while incentive costs and fraud‑prevention spend rose ~12% y/y in 2024. Hyperscalers concentrate infrastructure risk (AWS 32%, Azure 23%, Google 11% share, 2024) with egress fees $0.05–0.12/GB and cloud at 15–25% of IT spend. Data walled gardens control ~60% of ad spend, raising integration costs; panels, multi‑cloud and first‑party links mitigate leverage.
| Supplier | Key metric | 2024 figure | Mitigation |
|---|---|---|---|
| Panel providers | Sample scarcity | Top nets >10M respondents | Proprietary panels |
| Hyperscalers | Market share | AWS 32% Azure 23% GCP 11% | Multi‑cloud, FinOps |
| Ad platforms | Ad spend control | ~60% Google+Meta | First‑party data |
| Compliance vendors | Breach cost signal | $4.45M avg (IBM 2023) | Privacy ops |
What is included in the product
Detailed Word Document
Tailored Porter’s Five Forces analysis for Macromill, uncovering competitive rivalry, buyer and supplier power, threat of new entrants and substitutes, and regulatory drivers; highlights disruptive trends, pricing pressures, and barriers that protect or expose the company’s market position.
Customizable Excel Spreadsheet
A one-sheet Macromill Porter's Five Forces summary that visualizes strategic pressure with an editable radar chart and customizable scores for quick decision-making. Duplicate scenario tabs, swap in your own data without macros, and drop the clean layout straight into pitch decks or reports.
Customers Bargaining Power
Enterprise procurement leverage
In 2024 large multinationals ran centralized RFPs, enforced rate cards and demanded volume discounts, often bundling multi-country scope to push unit prices down. Preferred vendor lists concentrated spend and heightened competition for suppliers. Articulating multi-year value and outcome-based narratives became essential to defend pricing and secure longer-term agreements.
Moderate switching costs
Buyers can shift projects to rivals with modest transition pain, increasing their bargaining power, yet Macromill’s longitudinal trackers, benchmarks and embedded dashboards create stickiness that moderates churn. Data continuity and consistent methodology become clear negotiation levers when clients demand comparable time-series results. Deeper integration into client workflows and APIs raises effective switching costs by tying insights into decision processes.
Price sensitivity in discretionary spend
Insights budgets fluctuate with macro cycles, and buyers become highly price-conscious—client RFPs often demand fixed-bid and performance SLAs, with procurement driving 20–30% of contracts toward fixed-price or outcome-based models in 2024. Pressure intensifies on commoditized surveys, compressing margins by roughly 10–15% as buyers shop on price. Packaging advisory and analytics with fieldwork lets Macromill capture premium fees and protect revenue per project.
Demand for speed and quality
Clients demand rapid turnaround and high data integrity; in the $90B market research industry (2024 ESOMAR estimate) failure on either front triggers vendor shifts and contract penalties or re-bids. Buyers use SLA clauses and competitive tendering to enforce standards, increasing customer bargaining power. Investing in automation and stricter QC preserves negotiating leverage and reduces churn.
- Speed-driven switching: SLA enforcement
- Quality risk: re-bids/penalties
- Defense: automation + QC
Alternative data familiarity
Many clients in 2024 now run first‑party analytics, CDPs and experimentation platforms, boosting buyer leverage as they understand alternative data sources and measurement tradeoffs. Buyers split budgets across vendors to A/B test value, increasing negotiation clout. Showing triangulation and clear ROI attribution is essential to retain share.
- 2024: ~61% firms report CDP use
- ~68% run experimentation or testing programs
- ROI attribution reduces churn
2024: 20–30% fixed contracts compress margins 10–15% in $90B market
In 2024 buyers centralized RFPs and procurement pushed 20–30% of contracts to fixed/outcome models, compressing margins ~10–15% within the $90B market research sector. Macromill’s trackers, dashboards and APIs raise switching costs, but 61% CDP and 68% experimentation adoption boost buyer leverage. Bundled analytics+fieldwork defends premium pricing and reduces churn.
| Metric | 2024 |
|---|---|
| Market size (ESOMAR) | $90B |
| Fixed/outcome contracts | 20–30% |
| Margin compression on commoditized work | 10–15% |
| CDP adoption | 61% |
| Experimentation programs | 68% |
Preview the Actual Deliverable
Macromill Porter's Five Forces Analysis
This preview shows the exact Macromill Porter’s Five Forces analysis you'll receive immediately after purchase—no surprises or placeholders. The document displayed is fully formatted and ready for download and use the moment you buy. You're viewing the complete, professionally written file and will have instant access to this identical deliverable after payment.
Original: $10.00
-65%$10.00
$3.50Description
Don't Miss the Bigger Picture
Macromill's leading digital market research platform faces strong buyer bargaining and growing substitute threats from low-cost DIY analytics. Supplier power and regulatory shifts moderately pressure margins, while barriers from data scale and client relationships limit new entrants. This brief snapshot only scratches the surface. Unlock the full Porter's Five Forces Analysis to explore Macromill’s competitive dynamics, market pressures, and strategic advantages in detail.
Suppliers Bargaining Power
Dependence on online panels
Macromill’s dependence on large, high-quality respondent pools gives panel providers and aggregators pricing leverage; top global panel networks exceed 10 million respondents, and niche B2B/HNW/healthcare samples remain scarce, raising supplier power. Incentive inflation and 2024 fraud-prevention spend growth (industry up ~12% year-on-year) further shift bargaining power to panel sources. Building proprietary panels and multi-sourcing reduces this risk.
Cloud and data infrastructure
Reliance on hyperscalers concentrates supplier power: in 2024 AWS held ~32% share, Azure ~23% and Google Cloud ~11% (Synergy Research), making compute, storage and AI services supplier-driven. Egress fees (commonly $0.05–0.12/GB) and committed-spend contracts plus proprietary managed services create high switching frictions. Major hyperscaler outages in 2023–24 caused multi-hour SLA hits, risking margins when cloud is 15–25% of IT spend. Hybrid/multi-cloud architectures and FinOps discipline (typical savings 20–30%) help rebalance negotiations.
Third‑party data and identity
APIs from ad platforms, data brokers and ID‑graph providers are critical for targeting and validation, and 2024 estimates show Google and Meta control roughly 60% of global digital ad spend, concentrating supplier power. Policy shifts — privacy reforms, signal loss and tightened API access in 2024 — have raised integration costs and supplier leverage. Few alternatives exist for walled‑garden data, constraining Macromill’s options. Investing in first‑party linkages and model‑based enrichment reduces this dependency and mitigates risk.
Specialized software tools
- Switching costs: high
- License impact: material on TCO
- Interoperability: lock-in risk
- Mitigation: open standards, internal dev
Compliance and legal services
Compliance and legal services (GDPR/CCPA, data residency, consent management) force Macromill to rely on specialized vendors and counsel, boosting supplier pricing power as regulatory complexity rises; IBM’s 2023 Cost of a Data Breach Report puts average breach costs at $4.45M, underscoring audit and breach‑readiness value. Certification audits and recurring readiness programs create steady outsourced spend, while building in‑house privacy ops and automation can reduce vendor dependence over time.
- Regulation drivers: GDPR/CCPA, data residency, consent
- Cost signal: $4.45M average breach cost (IBM 2023)
- Recurring suppliers: audits, breach readiness, legal counsel
- Mitigation: invest in privacy ops + automation to cut supplier reliance
Supplier power up: panels scarce, hyperscalers concentrated, ads at 60%
Macromill faces elevated supplier power: panel providers and niche samples are scarce while incentive costs and fraud‑prevention spend rose ~12% y/y in 2024. Hyperscalers concentrate infrastructure risk (AWS 32%, Azure 23%, Google 11% share, 2024) with egress fees $0.05–0.12/GB and cloud at 15–25% of IT spend. Data walled gardens control ~60% of ad spend, raising integration costs; panels, multi‑cloud and first‑party links mitigate leverage.
| Supplier | Key metric | 2024 figure | Mitigation |
|---|---|---|---|
| Panel providers | Sample scarcity | Top nets >10M respondents | Proprietary panels |
| Hyperscalers | Market share | AWS 32% Azure 23% GCP 11% | Multi‑cloud, FinOps |
| Ad platforms | Ad spend control | ~60% Google+Meta | First‑party data |
| Compliance vendors | Breach cost signal | $4.45M avg (IBM 2023) | Privacy ops |
What is included in the product
Detailed Word Document
Tailored Porter’s Five Forces analysis for Macromill, uncovering competitive rivalry, buyer and supplier power, threat of new entrants and substitutes, and regulatory drivers; highlights disruptive trends, pricing pressures, and barriers that protect or expose the company’s market position.
Customizable Excel Spreadsheet
A one-sheet Macromill Porter's Five Forces summary that visualizes strategic pressure with an editable radar chart and customizable scores for quick decision-making. Duplicate scenario tabs, swap in your own data without macros, and drop the clean layout straight into pitch decks or reports.
Customers Bargaining Power
Enterprise procurement leverage
In 2024 large multinationals ran centralized RFPs, enforced rate cards and demanded volume discounts, often bundling multi-country scope to push unit prices down. Preferred vendor lists concentrated spend and heightened competition for suppliers. Articulating multi-year value and outcome-based narratives became essential to defend pricing and secure longer-term agreements.
Moderate switching costs
Buyers can shift projects to rivals with modest transition pain, increasing their bargaining power, yet Macromill’s longitudinal trackers, benchmarks and embedded dashboards create stickiness that moderates churn. Data continuity and consistent methodology become clear negotiation levers when clients demand comparable time-series results. Deeper integration into client workflows and APIs raises effective switching costs by tying insights into decision processes.
Price sensitivity in discretionary spend
Insights budgets fluctuate with macro cycles, and buyers become highly price-conscious—client RFPs often demand fixed-bid and performance SLAs, with procurement driving 20–30% of contracts toward fixed-price or outcome-based models in 2024. Pressure intensifies on commoditized surveys, compressing margins by roughly 10–15% as buyers shop on price. Packaging advisory and analytics with fieldwork lets Macromill capture premium fees and protect revenue per project.
Demand for speed and quality
Clients demand rapid turnaround and high data integrity; in the $90B market research industry (2024 ESOMAR estimate) failure on either front triggers vendor shifts and contract penalties or re-bids. Buyers use SLA clauses and competitive tendering to enforce standards, increasing customer bargaining power. Investing in automation and stricter QC preserves negotiating leverage and reduces churn.
- Speed-driven switching: SLA enforcement
- Quality risk: re-bids/penalties
- Defense: automation + QC
Alternative data familiarity
Many clients in 2024 now run first‑party analytics, CDPs and experimentation platforms, boosting buyer leverage as they understand alternative data sources and measurement tradeoffs. Buyers split budgets across vendors to A/B test value, increasing negotiation clout. Showing triangulation and clear ROI attribution is essential to retain share.
- 2024: ~61% firms report CDP use
- ~68% run experimentation or testing programs
- ROI attribution reduces churn
2024: 20–30% fixed contracts compress margins 10–15% in $90B market
In 2024 buyers centralized RFPs and procurement pushed 20–30% of contracts to fixed/outcome models, compressing margins ~10–15% within the $90B market research sector. Macromill’s trackers, dashboards and APIs raise switching costs, but 61% CDP and 68% experimentation adoption boost buyer leverage. Bundled analytics+fieldwork defends premium pricing and reduces churn.
| Metric | 2024 |
|---|---|
| Market size (ESOMAR) | $90B |
| Fixed/outcome contracts | 20–30% |
| Margin compression on commoditized work | 10–15% |
| CDP adoption | 61% |
| Experimentation programs | 68% |
Preview the Actual Deliverable
Macromill Porter's Five Forces Analysis
This preview shows the exact Macromill Porter’s Five Forces analysis you'll receive immediately after purchase—no surprises or placeholders. The document displayed is fully formatted and ready for download and use the moment you buy. You're viewing the complete, professionally written file and will have instant access to this identical deliverable after payment.











