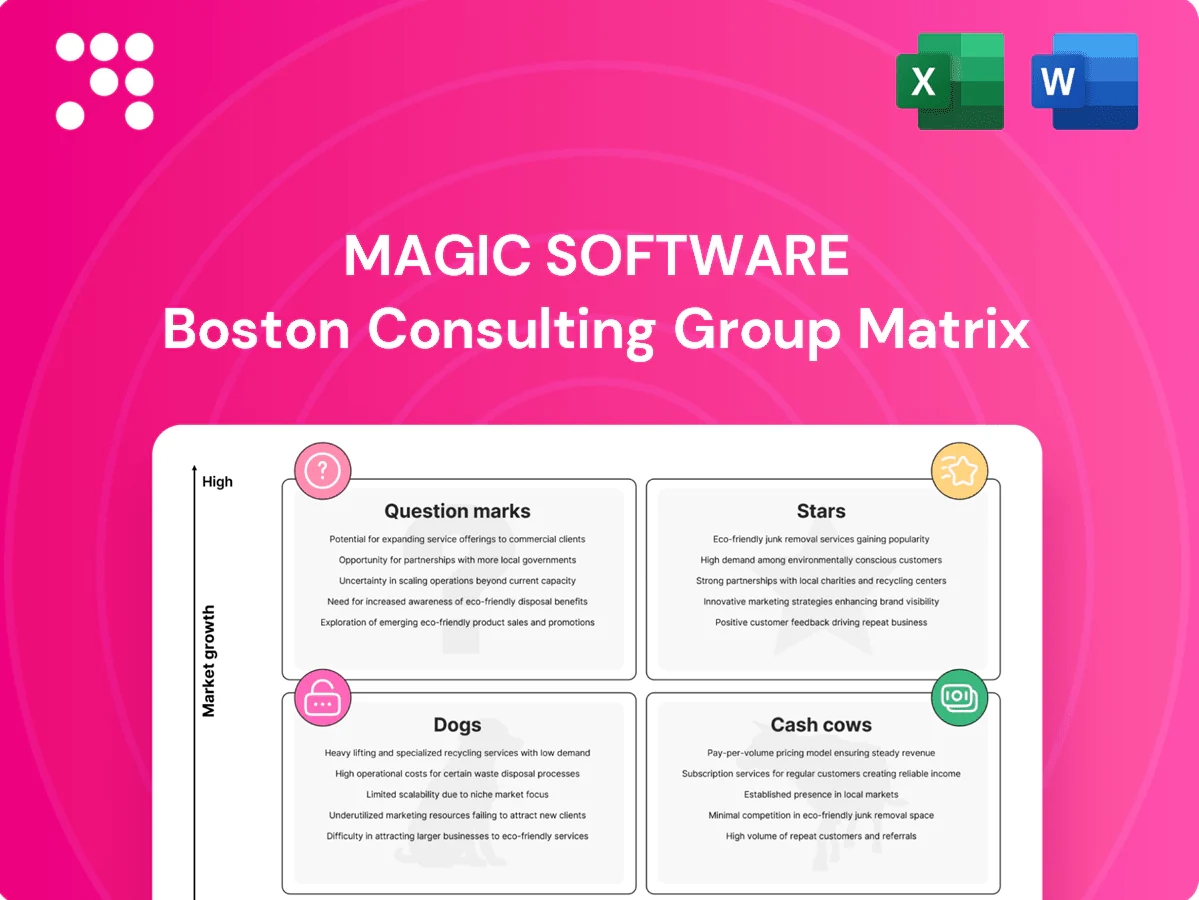
Magic Software Boston Consulting Group Matrix

See the Bigger Picture
Curious where Magic Software’s products land—Stars, Cash Cows, Dogs, or Question Marks? This preview scratches the surface; buy the full BCG Matrix for quadrant-by-quadrant placement, data-backed recommendations, and a clear roadmap for resource allocation. Get instant access to a polished Word report plus an Excel summary so you can present, decide, and act—fast.
Stars

Low-code application platform
Low-code application platforms sit in a high-growth market—Gartner forecasted that by 2024 low-code will account for roughly 65% of application development—and Magic holds a credible enterprise share backed by multi-year deployments. The business still consumes cash for roadmap, developer advocacy, and partner enablement to sustain momentum. Push wins in regulated industries where speed plus governance drives procurement; hold share now as the segment matures into a cash cow later.
Integration platform (iPaaS + hybrid)
Connectivity spend rose roughly 15% year-over-year in 2024 as stacks fragment across cloud and on-prem, expanding the global iPaaS market to an estimated $5.6B in 2024. Magic excels at low-friction stitching between SAP, Salesforce and legacy systems, driving faster time-to-value for customers. To defend its Stars position it must invest heavily in connectors and runtime performance and scale partner-led implementations to lock in share.

Data integration & orchestration
Pipeline sprawl is real and buyers demand reliable, governed data movement; Magic’s tooling is battle-tested for mid‑enterprise workloads, keeping it competitive in RFPs. Double down on automation, lineage, and monitoring to widen the moat. The global data integration market was roughly $11B in 2024 with ~12% year‑over‑year growth, while Magic shows strong growth and elevated cash burn — a classic Star profile.

Cloud deployment & managed runtime
Cloud-first buyers demand speed, SLAs, and predictable pricing; public cloud services exceeded $600B in 2024, reinforcing urgency. Managed runtimes boost stickiness and can raise renewal/LTV by ~15% in industry benchmarks, but require upfront investment in reliability, security, and FinOps tooling. Maintain momentum or Stars can flip to Cows as adoption plateaus.
- Buyer needs: speed, SLAs, predictable cost (2024)
- Value: managed = higher stickiness, ~15% LTV lift
- Invest: reliability, security, FinOps tooling
- Risk: can become Cow if growth plateaus
Prebuilt enterprise connectors
Prebuilt enterprise connectors for SAP, Oracle, Microsoft and major SaaS accelerate deal velocity and cut deployment time; market data shows enterprise integration demand rose about 18% YoY in 2024, driving platform selection toward catalog-rich vendors. Continuous upkeep and certification cycles raise OPEX, but maintaining certification is required for compliance and customer retention; prioritize shipping net-new connectors where 2024 adoption surges.
- Ready-to-use adapters boost sales velocity
- Catalog shortens time-to-value
- Certification inflates OPEX
- Focus new connectors on high-demand targets
iPaaS growth play: protect share with managed runtimes, certs & automation to lift LTV
Magic’s low-code/iPaaS is a Star: high growth (market ~5.6B iPaaS, $11B integration in 2024) and strong enterprise traction but elevated cash burn for roadmap and connectors. Invest in managed runtimes, certifications, automation to protect share and lift LTV ~15%. Failure to scale ops and partners risks transition to Cash Cow as adoption plateaus.
| Metric | 2024 |
|---|---|
| iPaaS market | $5.6B |
| Integration market | $11B |
| LTV uplift (managed) | ~15% |
What is included in the product
 Detailed Word Document
Concise BCG Matrix review of Magic Software’s products with strategic moves—invest, hold, or divest—plus trend-driven risks and opportunities.

 Customizable Excel Spreadsheet
One-page Magic Software BCG Matrix highlights underperformers and quick wins, export-ready for slides.
Cash Cows

Maintenance and support renewals
Maintenance and support renewals serve as Magic Software’s cash cow, supported by a mature customer base and historically high renewal rates (industry peers report ~85–90% in 2024), delivering high-margin recurring cash flow. Incremental spend is low—primarily staffing and patch cycles—keeping gross margins in the 65–75% band for maintenance lines. Proceeds are routinely redeployed to fund Star bets without stressing operating P&L, covering a meaningful share of incremental R&D. Protecting NPS and response times is critical, since churn in this segment both reduces revenue and raises acquisition costs.
Professional services packages
Implementation, upgrades, and health checks should be structured to fund themselves and drive license cross-sell, leveraging a services-to-license attach motion; with global IT spending at about $5.3 trillion in 2024 (Gartner), demand remains strong. Delivery playbooks keep margins predictable and lower delivery variance. Avoid overbuilding bespoke work — enforce accelerators and templates. Scale capacity through partners to keep utilization healthy and variable cost controllable.

On‑prem license base
On‑prem license base is Magic Software Enterprises (NASDAQ: MGIC) cash cow: a large installed footprint that continually buys add‑ons and maintenance, delivering modest top‑line growth but strong cash conversion. Optimize tooling and automation to cut support cost per tenant and protect margins. Offer gentle cloud migration paths to extend revenue runway while preserving recurring on‑prem cash flows.

Training and certification
Training and certification at Magic Software is a cash cow: it generates recurring, high-margin revenue that deepens the ecosystem, increases product adoption and lowers support load; LinkedIn Workplace Learning 2024 shows 59% of learners prefer employer-provided training, supporting uplift in usage and retention. Mostly marketing-led with low CAC once content is built, it is routinely bundled with enterprise deals to raise average deal size and upgrade velocity.
- Recurring revenue
- High margin
- Reduces support burden
- Low CAC post-content
- Bundle to increase deal size
Industry templates and accelerators
Battle-tested blueprints shorten delivery 30–50% and lift win rates ~15–25% in 2024 deals; refresh costs are <5% of build yet drive outsized value. Price as premium add-ons or embed in tiers to raise ASP ~10–20%; maintain a light refresh cadence of 1–2 major updates/year to milk recurring margin.
- delivery 30–50%
- win rate +15–25%
- refresh cost <5%
- ASP +10–20%
- cadence 1–2/yr
Maintenance renewals: high-margin recurring cash flow that funds R&D
Maintenance renewals, on‑prem licenses, training and services are Magic Software cash cows, yielding high-margin recurring cash flow (maintenance margins 65–75%; renewal rates ~85–90% in 2024) and funding R&D and Star investments while keeping CAC low.
| Metric | 2024 |
|---|---|
| Renewal rate | 85–90% |
| Maintenance margin | 65–75% |
| IT spend (market) | $5.3T |
Full Transparency, Always
Magic Software BCG Matrix
The file you're previewing here is the exact Magic Software BCG Matrix you'll receive after purchase — no watermarks, no demo text, just the finished, fully formatted report. It’s ready to edit, print, or present to your team immediately. Delivered directly to your inbox, the document is crafted by strategy pros for clarity and action. What you see is what you get — no surprises, no extra steps.

See the Bigger Picture
Curious where Magic Software’s products land—Stars, Cash Cows, Dogs, or Question Marks? This preview scratches the surface; buy the full BCG Matrix for quadrant-by-quadrant placement, data-backed recommendations, and a clear roadmap for resource allocation. Get instant access to a polished Word report plus an Excel summary so you can present, decide, and act—fast.
Stars
Low-code application platform
Low-code application platforms sit in a high-growth market—Gartner forecasted that by 2024 low-code will account for roughly 65% of application development—and Magic holds a credible enterprise share backed by multi-year deployments. The business still consumes cash for roadmap, developer advocacy, and partner enablement to sustain momentum. Push wins in regulated industries where speed plus governance drives procurement; hold share now as the segment matures into a cash cow later.
Integration platform (iPaaS + hybrid)
Connectivity spend rose roughly 15% year-over-year in 2024 as stacks fragment across cloud and on-prem, expanding the global iPaaS market to an estimated $5.6B in 2024. Magic excels at low-friction stitching between SAP, Salesforce and legacy systems, driving faster time-to-value for customers. To defend its Stars position it must invest heavily in connectors and runtime performance and scale partner-led implementations to lock in share.
Data integration & orchestration
Pipeline sprawl is real and buyers demand reliable, governed data movement; Magic’s tooling is battle-tested for mid‑enterprise workloads, keeping it competitive in RFPs. Double down on automation, lineage, and monitoring to widen the moat. The global data integration market was roughly $11B in 2024 with ~12% year‑over‑year growth, while Magic shows strong growth and elevated cash burn — a classic Star profile.
Cloud deployment & managed runtime
Cloud-first buyers demand speed, SLAs, and predictable pricing; public cloud services exceeded $600B in 2024, reinforcing urgency. Managed runtimes boost stickiness and can raise renewal/LTV by ~15% in industry benchmarks, but require upfront investment in reliability, security, and FinOps tooling. Maintain momentum or Stars can flip to Cows as adoption plateaus.
- Buyer needs: speed, SLAs, predictable cost (2024)
- Value: managed = higher stickiness, ~15% LTV lift
- Invest: reliability, security, FinOps tooling
- Risk: can become Cow if growth plateaus
Prebuilt enterprise connectors
Prebuilt enterprise connectors for SAP, Oracle, Microsoft and major SaaS accelerate deal velocity and cut deployment time; market data shows enterprise integration demand rose about 18% YoY in 2024, driving platform selection toward catalog-rich vendors. Continuous upkeep and certification cycles raise OPEX, but maintaining certification is required for compliance and customer retention; prioritize shipping net-new connectors where 2024 adoption surges.
- Ready-to-use adapters boost sales velocity
- Catalog shortens time-to-value
- Certification inflates OPEX
- Focus new connectors on high-demand targets
iPaaS growth play: protect share with managed runtimes, certs & automation to lift LTV
Magic’s low-code/iPaaS is a Star: high growth (market ~5.6B iPaaS, $11B integration in 2024) and strong enterprise traction but elevated cash burn for roadmap and connectors. Invest in managed runtimes, certifications, automation to protect share and lift LTV ~15%. Failure to scale ops and partners risks transition to Cash Cow as adoption plateaus.
| Metric | 2024 |
|---|---|
| iPaaS market | $5.6B |
| Integration market | $11B |
| LTV uplift (managed) | ~15% |
What is included in the product
Detailed Word Document
Concise BCG Matrix review of Magic Software’s products with strategic moves—invest, hold, or divest—plus trend-driven risks and opportunities.
Customizable Excel Spreadsheet
One-page Magic Software BCG Matrix highlights underperformers and quick wins, export-ready for slides.
Cash Cows
Maintenance and support renewals
Maintenance and support renewals serve as Magic Software’s cash cow, supported by a mature customer base and historically high renewal rates (industry peers report ~85–90% in 2024), delivering high-margin recurring cash flow. Incremental spend is low—primarily staffing and patch cycles—keeping gross margins in the 65–75% band for maintenance lines. Proceeds are routinely redeployed to fund Star bets without stressing operating P&L, covering a meaningful share of incremental R&D. Protecting NPS and response times is critical, since churn in this segment both reduces revenue and raises acquisition costs.
Professional services packages
Implementation, upgrades, and health checks should be structured to fund themselves and drive license cross-sell, leveraging a services-to-license attach motion; with global IT spending at about $5.3 trillion in 2024 (Gartner), demand remains strong. Delivery playbooks keep margins predictable and lower delivery variance. Avoid overbuilding bespoke work — enforce accelerators and templates. Scale capacity through partners to keep utilization healthy and variable cost controllable.
On‑prem license base
On‑prem license base is Magic Software Enterprises (NASDAQ: MGIC) cash cow: a large installed footprint that continually buys add‑ons and maintenance, delivering modest top‑line growth but strong cash conversion. Optimize tooling and automation to cut support cost per tenant and protect margins. Offer gentle cloud migration paths to extend revenue runway while preserving recurring on‑prem cash flows.
Training and certification
Training and certification at Magic Software is a cash cow: it generates recurring, high-margin revenue that deepens the ecosystem, increases product adoption and lowers support load; LinkedIn Workplace Learning 2024 shows 59% of learners prefer employer-provided training, supporting uplift in usage and retention. Mostly marketing-led with low CAC once content is built, it is routinely bundled with enterprise deals to raise average deal size and upgrade velocity.
- Recurring revenue
- High margin
- Reduces support burden
- Low CAC post-content
- Bundle to increase deal size
Industry templates and accelerators
Battle-tested blueprints shorten delivery 30–50% and lift win rates ~15–25% in 2024 deals; refresh costs are <5% of build yet drive outsized value. Price as premium add-ons or embed in tiers to raise ASP ~10–20%; maintain a light refresh cadence of 1–2 major updates/year to milk recurring margin.
- delivery 30–50%
- win rate +15–25%
- refresh cost <5%
- ASP +10–20%
- cadence 1–2/yr
Maintenance renewals: high-margin recurring cash flow that funds R&D
Maintenance renewals, on‑prem licenses, training and services are Magic Software cash cows, yielding high-margin recurring cash flow (maintenance margins 65–75%; renewal rates ~85–90% in 2024) and funding R&D and Star investments while keeping CAC low.
| Metric | 2024 |
|---|---|
| Renewal rate | 85–90% |
| Maintenance margin | 65–75% |
| IT spend (market) | $5.3T |
Full Transparency, Always
Magic Software BCG Matrix
The file you're previewing here is the exact Magic Software BCG Matrix you'll receive after purchase — no watermarks, no demo text, just the finished, fully formatted report. It’s ready to edit, print, or present to your team immediately. Delivered directly to your inbox, the document is crafted by strategy pros for clarity and action. What you see is what you get — no surprises, no extra steps.
Original: $10.00
-65%$10.00
$3.50Description
See the Bigger Picture
Curious where Magic Software’s products land—Stars, Cash Cows, Dogs, or Question Marks? This preview scratches the surface; buy the full BCG Matrix for quadrant-by-quadrant placement, data-backed recommendations, and a clear roadmap for resource allocation. Get instant access to a polished Word report plus an Excel summary so you can present, decide, and act—fast.
Stars
Low-code application platform
Low-code application platforms sit in a high-growth market—Gartner forecasted that by 2024 low-code will account for roughly 65% of application development—and Magic holds a credible enterprise share backed by multi-year deployments. The business still consumes cash for roadmap, developer advocacy, and partner enablement to sustain momentum. Push wins in regulated industries where speed plus governance drives procurement; hold share now as the segment matures into a cash cow later.
Integration platform (iPaaS + hybrid)
Connectivity spend rose roughly 15% year-over-year in 2024 as stacks fragment across cloud and on-prem, expanding the global iPaaS market to an estimated $5.6B in 2024. Magic excels at low-friction stitching between SAP, Salesforce and legacy systems, driving faster time-to-value for customers. To defend its Stars position it must invest heavily in connectors and runtime performance and scale partner-led implementations to lock in share.
Data integration & orchestration
Pipeline sprawl is real and buyers demand reliable, governed data movement; Magic’s tooling is battle-tested for mid‑enterprise workloads, keeping it competitive in RFPs. Double down on automation, lineage, and monitoring to widen the moat. The global data integration market was roughly $11B in 2024 with ~12% year‑over‑year growth, while Magic shows strong growth and elevated cash burn — a classic Star profile.
Cloud deployment & managed runtime
Cloud-first buyers demand speed, SLAs, and predictable pricing; public cloud services exceeded $600B in 2024, reinforcing urgency. Managed runtimes boost stickiness and can raise renewal/LTV by ~15% in industry benchmarks, but require upfront investment in reliability, security, and FinOps tooling. Maintain momentum or Stars can flip to Cows as adoption plateaus.
- Buyer needs: speed, SLAs, predictable cost (2024)
- Value: managed = higher stickiness, ~15% LTV lift
- Invest: reliability, security, FinOps tooling
- Risk: can become Cow if growth plateaus
Prebuilt enterprise connectors
Prebuilt enterprise connectors for SAP, Oracle, Microsoft and major SaaS accelerate deal velocity and cut deployment time; market data shows enterprise integration demand rose about 18% YoY in 2024, driving platform selection toward catalog-rich vendors. Continuous upkeep and certification cycles raise OPEX, but maintaining certification is required for compliance and customer retention; prioritize shipping net-new connectors where 2024 adoption surges.
- Ready-to-use adapters boost sales velocity
- Catalog shortens time-to-value
- Certification inflates OPEX
- Focus new connectors on high-demand targets
iPaaS growth play: protect share with managed runtimes, certs & automation to lift LTV
Magic’s low-code/iPaaS is a Star: high growth (market ~5.6B iPaaS, $11B integration in 2024) and strong enterprise traction but elevated cash burn for roadmap and connectors. Invest in managed runtimes, certifications, automation to protect share and lift LTV ~15%. Failure to scale ops and partners risks transition to Cash Cow as adoption plateaus.
| Metric | 2024 |
|---|---|
| iPaaS market | $5.6B |
| Integration market | $11B |
| LTV uplift (managed) | ~15% |
What is included in the product
Detailed Word Document
Concise BCG Matrix review of Magic Software’s products with strategic moves—invest, hold, or divest—plus trend-driven risks and opportunities.
Customizable Excel Spreadsheet
One-page Magic Software BCG Matrix highlights underperformers and quick wins, export-ready for slides.
Cash Cows
Maintenance and support renewals
Maintenance and support renewals serve as Magic Software’s cash cow, supported by a mature customer base and historically high renewal rates (industry peers report ~85–90% in 2024), delivering high-margin recurring cash flow. Incremental spend is low—primarily staffing and patch cycles—keeping gross margins in the 65–75% band for maintenance lines. Proceeds are routinely redeployed to fund Star bets without stressing operating P&L, covering a meaningful share of incremental R&D. Protecting NPS and response times is critical, since churn in this segment both reduces revenue and raises acquisition costs.
Professional services packages
Implementation, upgrades, and health checks should be structured to fund themselves and drive license cross-sell, leveraging a services-to-license attach motion; with global IT spending at about $5.3 trillion in 2024 (Gartner), demand remains strong. Delivery playbooks keep margins predictable and lower delivery variance. Avoid overbuilding bespoke work — enforce accelerators and templates. Scale capacity through partners to keep utilization healthy and variable cost controllable.
On‑prem license base
On‑prem license base is Magic Software Enterprises (NASDAQ: MGIC) cash cow: a large installed footprint that continually buys add‑ons and maintenance, delivering modest top‑line growth but strong cash conversion. Optimize tooling and automation to cut support cost per tenant and protect margins. Offer gentle cloud migration paths to extend revenue runway while preserving recurring on‑prem cash flows.
Training and certification
Training and certification at Magic Software is a cash cow: it generates recurring, high-margin revenue that deepens the ecosystem, increases product adoption and lowers support load; LinkedIn Workplace Learning 2024 shows 59% of learners prefer employer-provided training, supporting uplift in usage and retention. Mostly marketing-led with low CAC once content is built, it is routinely bundled with enterprise deals to raise average deal size and upgrade velocity.
- Recurring revenue
- High margin
- Reduces support burden
- Low CAC post-content
- Bundle to increase deal size
Industry templates and accelerators
Battle-tested blueprints shorten delivery 30–50% and lift win rates ~15–25% in 2024 deals; refresh costs are <5% of build yet drive outsized value. Price as premium add-ons or embed in tiers to raise ASP ~10–20%; maintain a light refresh cadence of 1–2 major updates/year to milk recurring margin.
- delivery 30–50%
- win rate +15–25%
- refresh cost <5%
- ASP +10–20%
- cadence 1–2/yr
Maintenance renewals: high-margin recurring cash flow that funds R&D
Maintenance renewals, on‑prem licenses, training and services are Magic Software cash cows, yielding high-margin recurring cash flow (maintenance margins 65–75%; renewal rates ~85–90% in 2024) and funding R&D and Star investments while keeping CAC low.
| Metric | 2024 |
|---|---|
| Renewal rate | 85–90% |
| Maintenance margin | 65–75% |
| IT spend (market) | $5.3T |
Full Transparency, Always
Magic Software BCG Matrix
The file you're previewing here is the exact Magic Software BCG Matrix you'll receive after purchase — no watermarks, no demo text, just the finished, fully formatted report. It’s ready to edit, print, or present to your team immediately. Delivered directly to your inbox, the document is crafted by strategy pros for clarity and action. What you see is what you get — no surprises, no extra steps.











