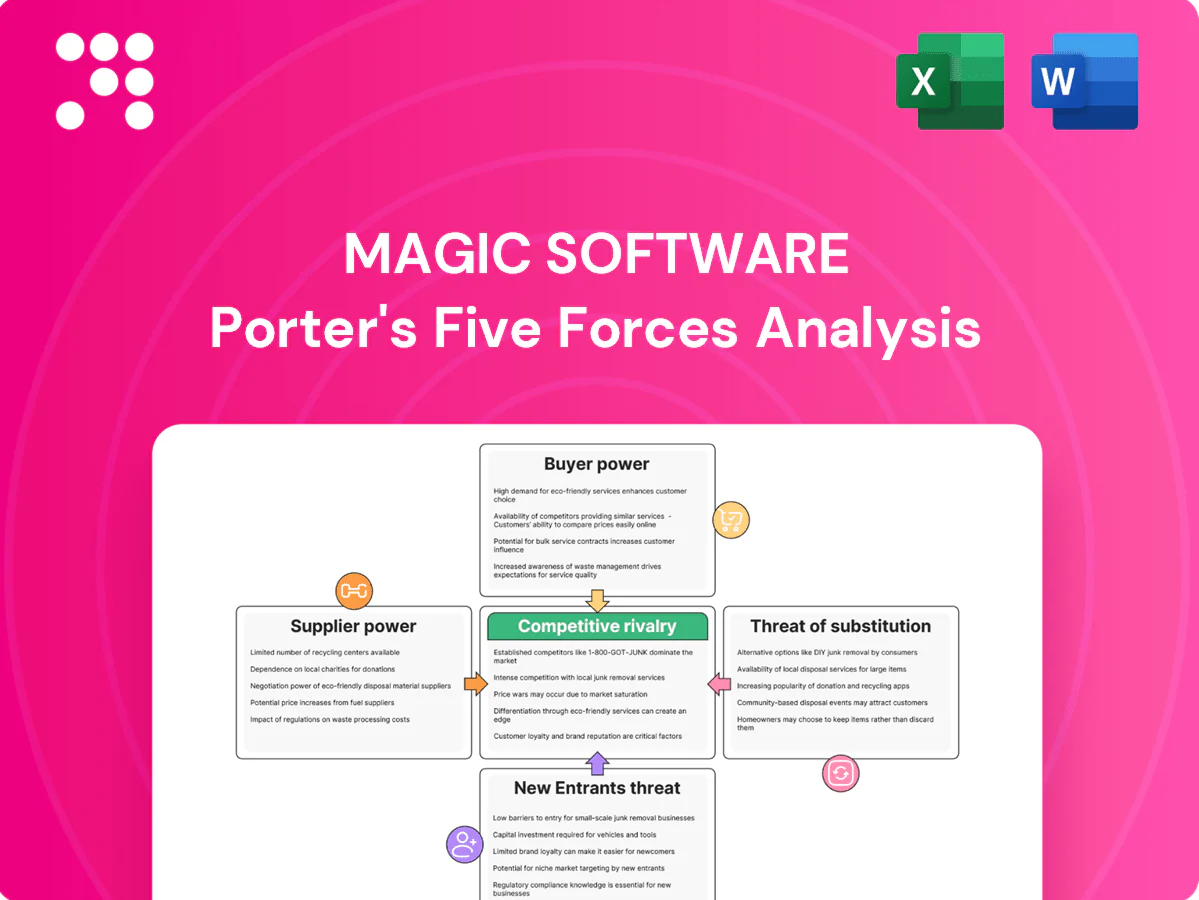
Magic Software Porter's Five Forces Analysis

A Must-Have Tool for Decision-Makers
Magic Software’s Porter’s Five Forces snapshot highlights key competitive pressures—buyer and supplier power, rivalry intensity, threat of substitutes and entrants—and how they shape margins and strategy. This concise view flags strategic risks and opportunity areas for growth and defense. Unlock the full Porter’s Five Forces Analysis for force-by-force ratings, visuals, and actionable recommendations tailored to Magic Software.
Suppliers Bargaining Power

Reliance on hyperscalers
Magic relies on hyperscalers for hosting, scalability and global reach; 2024 IaaS/PaaS share was roughly AWS 32%, Azure 23% and GCP 11%, concentrating supplier power. This oligopoly lets providers influence pricing and roadmap alignment, while reserved commitments can cut list costs but increase vendor lock-in. Hyperscaler outages or service deprecations—seen in high-profile 2024 incidents—can immediately ripple through Magic’s services.
Proprietary tech dependencies
Proprietary licenses for DB, OS and analytics often add 10–25% to software TCO and impose compliance clauses; partner API or pricing shifts can force 15–40% of integration rework and recurring maintenance. Vendor certifications and compatibility testing typically consume 2–4 weeks per release. Mid-cap scale limits negotiation leverage to single-digit discounts versus hyperscalers.

Talent as a supplier
Skilled engineers, solution architects and integration specialists are scarce for Magic Software, driving wage pressure—US median software engineer pay rose about 5% in 2024 to roughly $130,000 and tech retention costs climbed similarly. Tight labor markets increase poaching risk as 57% of developers reported openness to new roles in 2024 surveys, while knowledge concentration in key modules raises individual bargaining power. Remote hiring expanded global candidate pools by an estimated 20% in 2024, but also intensifies competition for top talent.

Connector and data source ecosystems
Access to timely API specs and SDKs is vital for Magic Software; in 2024 many SaaS platforms tightened rate limits (often under 1,000 calls/min on free tiers) and issued breaking API changes roughly twice a year, constraining delivery and raising supplier power. Preferred-partner status cuts integration hurdles (reducing time by ~30%) but can raise costs; gaps force custom builds, elongating timelines and increasing spend.
- Rate limits: common <1,000 calls/min
- API churn: ~2 changes/year
- Preferred partner: ~30% faster integration
- Custom builds: higher TTM and cost
Open-source stack exposure
Reliance on open-source frameworks lowers licensing cost but raises maintenance risk: according to Synopsys OSSRA 2024, 96% of codebases include open source and on average 70% of code is OSS, exposing Magic Software to dependency churn and roadmap disruption if licenses shift or communities fragment. Enterprise trust hinges on fast CVE patching; slow upstream fixes force costly internal forks that increase engineering burden and TCO.
- Exposure: 96% OSS use (Synopsys 2024)
- Code share: ~70% OSS
- Risk: license shifts disrupt roadmaps
- Mitigation: internal forks raise maintenance costs
Hyperscalers set pricing; TCO 10–25%, dev pay $130k
Suppliers exert high power: hyperscalers (AWS 32%, Azure 23%, GCP 11% in 2024) drive pricing and lock‑in; mid‑cap scale limits discounts to low single digits. Software/vendor licenses add 10–25% TCO and API churn (~2/year) plus rate limits (<1,000 calls/min) constrain delivery. Talent scarcity (US median dev pay ~$130,000 in 2024) raises staffing costs and retention risks.
| Metric | 2024 Value |
|---|---|
| Hyperscaler share | AWS 32% / Azure 23% / GCP 11% |
| License TCO uplift | 10–25% |
| API churn | ~2 changes/yr |
| Rate limits | <1,000 calls/min |
| OSS exposure | 96% codebases; ~70% code |
| Median US dev pay | ~$130,000 |
What is included in the product
 Detailed Word Document
Concise Porter’s Five Forces analysis for Magic Software that uncovers competitive drivers, buyer and supplier power, entry barriers, substitutes, and emerging threats to its market position.

 Customizable Excel Spreadsheet
Magic Software Porter's Five Forces delivers a single-sheet, customizable analysis that quickly identifies competitive pressures and strategic gaps, with easy-to-edit inputs and clean visuals ready for decks—no coding required.
Customers Bargaining Power

Enterprise procurement leverage
Large buyers running competitive RFPs pushed average negotiated discounts to 15–25% in 2024, extracting favorable payment and termination terms. Multi-year contracts increasingly hinge on stringent SLAs with 30–50% of fees tied to performance and penalty clauses. Referenceability and security attestations (SOC 2/ISO) were demanded by roughly 60% of enterprise buyers, while bundling and co-termination compressed vendor margins by an estimated 5–10%.
Abundant alternatives
Customers compare Magic with iPaaS, low-code and suite-native tools as the iPaaS and low-code sectors saw strong demand in 2024, with industry estimates showing double-digit growth year-over-year and enterprise low-code adoption above 60% in many surveys, narrowing differentiation and increasing price sensitivity.
Feature parity across platforms compresses margins; vendor benchmarks in 2024 showed buyers negotiating average discounts of 15–25% on subscription deals.
Trials and PoCs, used by roughly two-thirds of enterprise buyers in 2024, lower switching friction early, while incumbent vendor relationships and existing contract value continue to sway final decisions.

Switching costs vs lock-in
Once integrations and workflows are deployed, switching costs rise rapidly, with surveys in 2024 showing 62% of enterprises citing integration complexity as a primary barrier to vendor change. Buyers nonetheless insist on exit plans and data portability, and the growth of standard connectors and containerization (Docker/Kubernetes adoption >70% in 2024) weakens lock-in claims. Renewal cycles remain focal points for renegotiation and price pressure.

Total cost of ownership focus
Customers evaluate licensing, infrastructure and services as a single total cost of ownership, demanding that automation gains exceed training and change-management costs; 2024 surveys indicate over 60% of enterprise buyers rank TCO as the top procurement criterion. Usage-based pricing drives unpredictability under spiky loads, often causing procurement pushback unless clear ROI proofs and benchmarks are provided.
- Tag: TCO-focused
- Tag: ROI-proofs
- Tag: Usage-variability
- Tag: Training-costs
Security and compliance demands
Buyers now mandate SOC 2, ISO 27001 and explicit data‑residency options; vertical buyers layer HIPAA (US ~334 million covered) or GDPR (EU ~447 million citizens) requirements, turning security posture into a primary procurement lever. Audit rights and incident‑response clauses are treated as deal gates; failure to certify or to offer residency options hands decisive bargaining power to buyers.
- Buyers: SOC 2, ISO 27001, data residency
- Verticals: HIPAA (US ~334M), GDPR (EU ~447M)
- Deal gates: audit rights, IR clauses
- Consequence: non‑compliance shifts power to buyers
Buyers demand 15–25% discounts, >60% SOC2/ISO; TCO rules
Enterprise buyers exert strong leverage: negotiated discounts of 15–25% in 2024, 30–50% of fees tied to SLAs, and ~60% demanding SOC 2/ISO. Integration complexity slows switching (62% cite it) yet standard connectors and containerization (>70% adoption) reduce lock‑in. TCO/ROI dominates decisions with >60% ranking TCO top procurement criterion.
| Metric | 2024 Stat |
|---|---|
| Avg discount | 15–25% |
| Fees tied to SLAs | 30–50% |
| SOC2/ISO demand | ~60% |
| Integration barrier | 62% |
| Container/K8s adoption | >70% |
| TCO priority | >60% |
Same Document Delivered
Magic Software Porter's Five Forces Analysis
This Magic Software Porter's Five Forces Analysis preview is the exact, fully formatted document you’ll receive immediately after purchase—no placeholders or mockups. It contains comprehensive evaluation of supplier power, buyer power, competitive rivalry, threats of new entrants and substitutes, plus actionable implications. Ready to download and use upon payment.

A Must-Have Tool for Decision-Makers
Magic Software’s Porter’s Five Forces snapshot highlights key competitive pressures—buyer and supplier power, rivalry intensity, threat of substitutes and entrants—and how they shape margins and strategy. This concise view flags strategic risks and opportunity areas for growth and defense. Unlock the full Porter’s Five Forces Analysis for force-by-force ratings, visuals, and actionable recommendations tailored to Magic Software.
Suppliers Bargaining Power
Reliance on hyperscalers
Magic relies on hyperscalers for hosting, scalability and global reach; 2024 IaaS/PaaS share was roughly AWS 32%, Azure 23% and GCP 11%, concentrating supplier power. This oligopoly lets providers influence pricing and roadmap alignment, while reserved commitments can cut list costs but increase vendor lock-in. Hyperscaler outages or service deprecations—seen in high-profile 2024 incidents—can immediately ripple through Magic’s services.
Proprietary tech dependencies
Proprietary licenses for DB, OS and analytics often add 10–25% to software TCO and impose compliance clauses; partner API or pricing shifts can force 15–40% of integration rework and recurring maintenance. Vendor certifications and compatibility testing typically consume 2–4 weeks per release. Mid-cap scale limits negotiation leverage to single-digit discounts versus hyperscalers.
Talent as a supplier
Skilled engineers, solution architects and integration specialists are scarce for Magic Software, driving wage pressure—US median software engineer pay rose about 5% in 2024 to roughly $130,000 and tech retention costs climbed similarly. Tight labor markets increase poaching risk as 57% of developers reported openness to new roles in 2024 surveys, while knowledge concentration in key modules raises individual bargaining power. Remote hiring expanded global candidate pools by an estimated 20% in 2024, but also intensifies competition for top talent.
Connector and data source ecosystems
Access to timely API specs and SDKs is vital for Magic Software; in 2024 many SaaS platforms tightened rate limits (often under 1,000 calls/min on free tiers) and issued breaking API changes roughly twice a year, constraining delivery and raising supplier power. Preferred-partner status cuts integration hurdles (reducing time by ~30%) but can raise costs; gaps force custom builds, elongating timelines and increasing spend.
- Rate limits: common <1,000 calls/min
- API churn: ~2 changes/year
- Preferred partner: ~30% faster integration
- Custom builds: higher TTM and cost
Open-source stack exposure
Reliance on open-source frameworks lowers licensing cost but raises maintenance risk: according to Synopsys OSSRA 2024, 96% of codebases include open source and on average 70% of code is OSS, exposing Magic Software to dependency churn and roadmap disruption if licenses shift or communities fragment. Enterprise trust hinges on fast CVE patching; slow upstream fixes force costly internal forks that increase engineering burden and TCO.
- Exposure: 96% OSS use (Synopsys 2024)
- Code share: ~70% OSS
- Risk: license shifts disrupt roadmaps
- Mitigation: internal forks raise maintenance costs
Hyperscalers set pricing; TCO 10–25%, dev pay $130k
Suppliers exert high power: hyperscalers (AWS 32%, Azure 23%, GCP 11% in 2024) drive pricing and lock‑in; mid‑cap scale limits discounts to low single digits. Software/vendor licenses add 10–25% TCO and API churn (~2/year) plus rate limits (<1,000 calls/min) constrain delivery. Talent scarcity (US median dev pay ~$130,000 in 2024) raises staffing costs and retention risks.
| Metric | 2024 Value |
|---|---|
| Hyperscaler share | AWS 32% / Azure 23% / GCP 11% |
| License TCO uplift | 10–25% |
| API churn | ~2 changes/yr |
| Rate limits | <1,000 calls/min |
| OSS exposure | 96% codebases; ~70% code |
| Median US dev pay | ~$130,000 |
What is included in the product
Detailed Word Document
Concise Porter’s Five Forces analysis for Magic Software that uncovers competitive drivers, buyer and supplier power, entry barriers, substitutes, and emerging threats to its market position.
Customizable Excel Spreadsheet
Magic Software Porter's Five Forces delivers a single-sheet, customizable analysis that quickly identifies competitive pressures and strategic gaps, with easy-to-edit inputs and clean visuals ready for decks—no coding required.
Customers Bargaining Power
Enterprise procurement leverage
Large buyers running competitive RFPs pushed average negotiated discounts to 15–25% in 2024, extracting favorable payment and termination terms. Multi-year contracts increasingly hinge on stringent SLAs with 30–50% of fees tied to performance and penalty clauses. Referenceability and security attestations (SOC 2/ISO) were demanded by roughly 60% of enterprise buyers, while bundling and co-termination compressed vendor margins by an estimated 5–10%.
Abundant alternatives
Customers compare Magic with iPaaS, low-code and suite-native tools as the iPaaS and low-code sectors saw strong demand in 2024, with industry estimates showing double-digit growth year-over-year and enterprise low-code adoption above 60% in many surveys, narrowing differentiation and increasing price sensitivity.
Feature parity across platforms compresses margins; vendor benchmarks in 2024 showed buyers negotiating average discounts of 15–25% on subscription deals.
Trials and PoCs, used by roughly two-thirds of enterprise buyers in 2024, lower switching friction early, while incumbent vendor relationships and existing contract value continue to sway final decisions.
Switching costs vs lock-in
Once integrations and workflows are deployed, switching costs rise rapidly, with surveys in 2024 showing 62% of enterprises citing integration complexity as a primary barrier to vendor change. Buyers nonetheless insist on exit plans and data portability, and the growth of standard connectors and containerization (Docker/Kubernetes adoption >70% in 2024) weakens lock-in claims. Renewal cycles remain focal points for renegotiation and price pressure.
Total cost of ownership focus
Customers evaluate licensing, infrastructure and services as a single total cost of ownership, demanding that automation gains exceed training and change-management costs; 2024 surveys indicate over 60% of enterprise buyers rank TCO as the top procurement criterion. Usage-based pricing drives unpredictability under spiky loads, often causing procurement pushback unless clear ROI proofs and benchmarks are provided.
- Tag: TCO-focused
- Tag: ROI-proofs
- Tag: Usage-variability
- Tag: Training-costs
Security and compliance demands
Buyers now mandate SOC 2, ISO 27001 and explicit data‑residency options; vertical buyers layer HIPAA (US ~334 million covered) or GDPR (EU ~447 million citizens) requirements, turning security posture into a primary procurement lever. Audit rights and incident‑response clauses are treated as deal gates; failure to certify or to offer residency options hands decisive bargaining power to buyers.
- Buyers: SOC 2, ISO 27001, data residency
- Verticals: HIPAA (US ~334M), GDPR (EU ~447M)
- Deal gates: audit rights, IR clauses
- Consequence: non‑compliance shifts power to buyers
Buyers demand 15–25% discounts, >60% SOC2/ISO; TCO rules
Enterprise buyers exert strong leverage: negotiated discounts of 15–25% in 2024, 30–50% of fees tied to SLAs, and ~60% demanding SOC 2/ISO. Integration complexity slows switching (62% cite it) yet standard connectors and containerization (>70% adoption) reduce lock‑in. TCO/ROI dominates decisions with >60% ranking TCO top procurement criterion.
| Metric | 2024 Stat |
|---|---|
| Avg discount | 15–25% |
| Fees tied to SLAs | 30–50% |
| SOC2/ISO demand | ~60% |
| Integration barrier | 62% |
| Container/K8s adoption | >70% |
| TCO priority | >60% |
Same Document Delivered
Magic Software Porter's Five Forces Analysis
This Magic Software Porter's Five Forces Analysis preview is the exact, fully formatted document you’ll receive immediately after purchase—no placeholders or mockups. It contains comprehensive evaluation of supplier power, buyer power, competitive rivalry, threats of new entrants and substitutes, plus actionable implications. Ready to download and use upon payment.
Original: $10.00
-65%$10.00
$3.50Description
A Must-Have Tool for Decision-Makers
Magic Software’s Porter’s Five Forces snapshot highlights key competitive pressures—buyer and supplier power, rivalry intensity, threat of substitutes and entrants—and how they shape margins and strategy. This concise view flags strategic risks and opportunity areas for growth and defense. Unlock the full Porter’s Five Forces Analysis for force-by-force ratings, visuals, and actionable recommendations tailored to Magic Software.
Suppliers Bargaining Power
Reliance on hyperscalers
Magic relies on hyperscalers for hosting, scalability and global reach; 2024 IaaS/PaaS share was roughly AWS 32%, Azure 23% and GCP 11%, concentrating supplier power. This oligopoly lets providers influence pricing and roadmap alignment, while reserved commitments can cut list costs but increase vendor lock-in. Hyperscaler outages or service deprecations—seen in high-profile 2024 incidents—can immediately ripple through Magic’s services.
Proprietary tech dependencies
Proprietary licenses for DB, OS and analytics often add 10–25% to software TCO and impose compliance clauses; partner API or pricing shifts can force 15–40% of integration rework and recurring maintenance. Vendor certifications and compatibility testing typically consume 2–4 weeks per release. Mid-cap scale limits negotiation leverage to single-digit discounts versus hyperscalers.
Talent as a supplier
Skilled engineers, solution architects and integration specialists are scarce for Magic Software, driving wage pressure—US median software engineer pay rose about 5% in 2024 to roughly $130,000 and tech retention costs climbed similarly. Tight labor markets increase poaching risk as 57% of developers reported openness to new roles in 2024 surveys, while knowledge concentration in key modules raises individual bargaining power. Remote hiring expanded global candidate pools by an estimated 20% in 2024, but also intensifies competition for top talent.
Connector and data source ecosystems
Access to timely API specs and SDKs is vital for Magic Software; in 2024 many SaaS platforms tightened rate limits (often under 1,000 calls/min on free tiers) and issued breaking API changes roughly twice a year, constraining delivery and raising supplier power. Preferred-partner status cuts integration hurdles (reducing time by ~30%) but can raise costs; gaps force custom builds, elongating timelines and increasing spend.
- Rate limits: common <1,000 calls/min
- API churn: ~2 changes/year
- Preferred partner: ~30% faster integration
- Custom builds: higher TTM and cost
Open-source stack exposure
Reliance on open-source frameworks lowers licensing cost but raises maintenance risk: according to Synopsys OSSRA 2024, 96% of codebases include open source and on average 70% of code is OSS, exposing Magic Software to dependency churn and roadmap disruption if licenses shift or communities fragment. Enterprise trust hinges on fast CVE patching; slow upstream fixes force costly internal forks that increase engineering burden and TCO.
- Exposure: 96% OSS use (Synopsys 2024)
- Code share: ~70% OSS
- Risk: license shifts disrupt roadmaps
- Mitigation: internal forks raise maintenance costs
Hyperscalers set pricing; TCO 10–25%, dev pay $130k
Suppliers exert high power: hyperscalers (AWS 32%, Azure 23%, GCP 11% in 2024) drive pricing and lock‑in; mid‑cap scale limits discounts to low single digits. Software/vendor licenses add 10–25% TCO and API churn (~2/year) plus rate limits (<1,000 calls/min) constrain delivery. Talent scarcity (US median dev pay ~$130,000 in 2024) raises staffing costs and retention risks.
| Metric | 2024 Value |
|---|---|
| Hyperscaler share | AWS 32% / Azure 23% / GCP 11% |
| License TCO uplift | 10–25% |
| API churn | ~2 changes/yr |
| Rate limits | <1,000 calls/min |
| OSS exposure | 96% codebases; ~70% code |
| Median US dev pay | ~$130,000 |
What is included in the product
Detailed Word Document
Concise Porter’s Five Forces analysis for Magic Software that uncovers competitive drivers, buyer and supplier power, entry barriers, substitutes, and emerging threats to its market position.
Customizable Excel Spreadsheet
Magic Software Porter's Five Forces delivers a single-sheet, customizable analysis that quickly identifies competitive pressures and strategic gaps, with easy-to-edit inputs and clean visuals ready for decks—no coding required.
Customers Bargaining Power
Enterprise procurement leverage
Large buyers running competitive RFPs pushed average negotiated discounts to 15–25% in 2024, extracting favorable payment and termination terms. Multi-year contracts increasingly hinge on stringent SLAs with 30–50% of fees tied to performance and penalty clauses. Referenceability and security attestations (SOC 2/ISO) were demanded by roughly 60% of enterprise buyers, while bundling and co-termination compressed vendor margins by an estimated 5–10%.
Abundant alternatives
Customers compare Magic with iPaaS, low-code and suite-native tools as the iPaaS and low-code sectors saw strong demand in 2024, with industry estimates showing double-digit growth year-over-year and enterprise low-code adoption above 60% in many surveys, narrowing differentiation and increasing price sensitivity.
Feature parity across platforms compresses margins; vendor benchmarks in 2024 showed buyers negotiating average discounts of 15–25% on subscription deals.
Trials and PoCs, used by roughly two-thirds of enterprise buyers in 2024, lower switching friction early, while incumbent vendor relationships and existing contract value continue to sway final decisions.
Switching costs vs lock-in
Once integrations and workflows are deployed, switching costs rise rapidly, with surveys in 2024 showing 62% of enterprises citing integration complexity as a primary barrier to vendor change. Buyers nonetheless insist on exit plans and data portability, and the growth of standard connectors and containerization (Docker/Kubernetes adoption >70% in 2024) weakens lock-in claims. Renewal cycles remain focal points for renegotiation and price pressure.
Total cost of ownership focus
Customers evaluate licensing, infrastructure and services as a single total cost of ownership, demanding that automation gains exceed training and change-management costs; 2024 surveys indicate over 60% of enterprise buyers rank TCO as the top procurement criterion. Usage-based pricing drives unpredictability under spiky loads, often causing procurement pushback unless clear ROI proofs and benchmarks are provided.
- Tag: TCO-focused
- Tag: ROI-proofs
- Tag: Usage-variability
- Tag: Training-costs
Security and compliance demands
Buyers now mandate SOC 2, ISO 27001 and explicit data‑residency options; vertical buyers layer HIPAA (US ~334 million covered) or GDPR (EU ~447 million citizens) requirements, turning security posture into a primary procurement lever. Audit rights and incident‑response clauses are treated as deal gates; failure to certify or to offer residency options hands decisive bargaining power to buyers.
- Buyers: SOC 2, ISO 27001, data residency
- Verticals: HIPAA (US ~334M), GDPR (EU ~447M)
- Deal gates: audit rights, IR clauses
- Consequence: non‑compliance shifts power to buyers
Buyers demand 15–25% discounts, >60% SOC2/ISO; TCO rules
Enterprise buyers exert strong leverage: negotiated discounts of 15–25% in 2024, 30–50% of fees tied to SLAs, and ~60% demanding SOC 2/ISO. Integration complexity slows switching (62% cite it) yet standard connectors and containerization (>70% adoption) reduce lock‑in. TCO/ROI dominates decisions with >60% ranking TCO top procurement criterion.
| Metric | 2024 Stat |
|---|---|
| Avg discount | 15–25% |
| Fees tied to SLAs | 30–50% |
| SOC2/ISO demand | ~60% |
| Integration barrier | 62% |
| Container/K8s adoption | >70% |
| TCO priority | >60% |
Same Document Delivered
Magic Software Porter's Five Forces Analysis
This Magic Software Porter's Five Forces Analysis preview is the exact, fully formatted document you’ll receive immediately after purchase—no placeholders or mockups. It contains comprehensive evaluation of supplier power, buyer power, competitive rivalry, threats of new entrants and substitutes, plus actionable implications. Ready to download and use upon payment.











