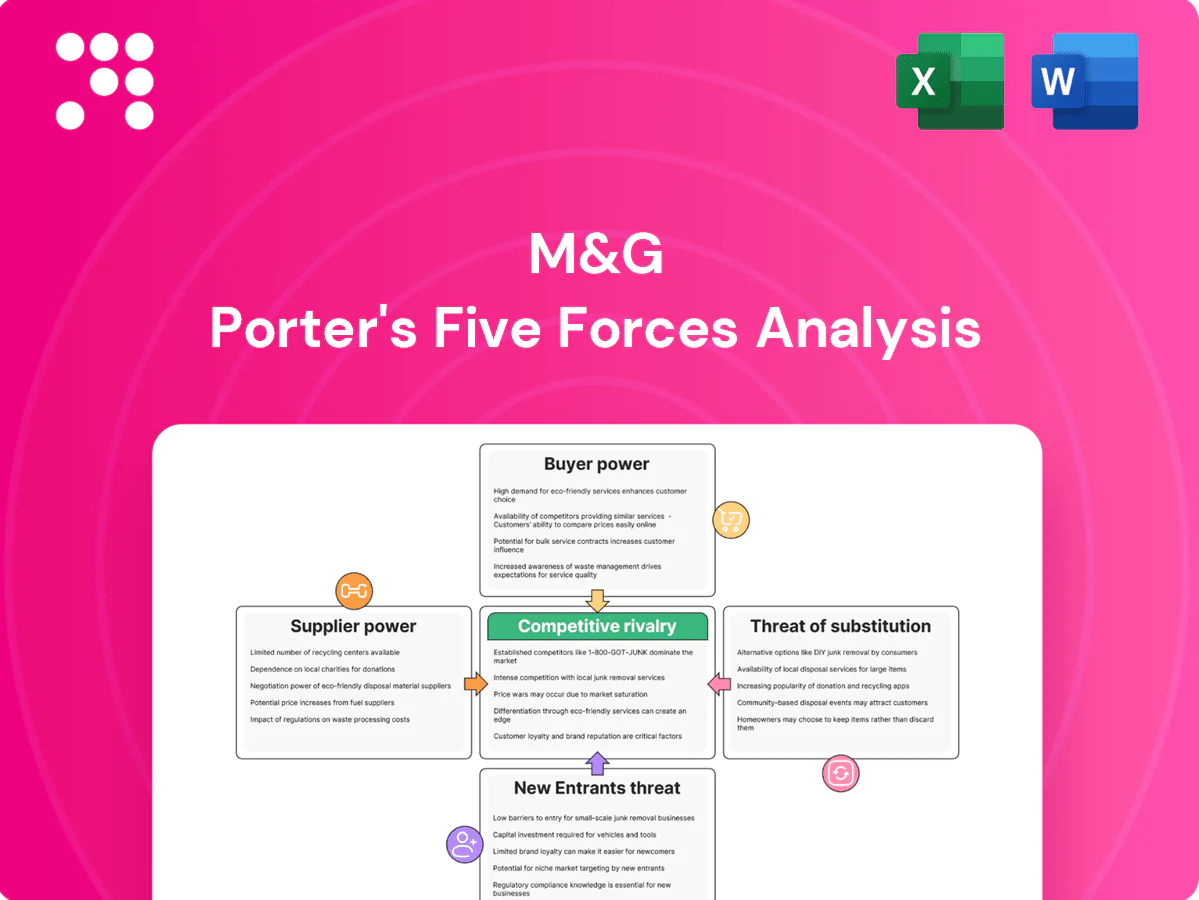
M&G Porter's Five Forces Analysis

A Must-Have Tool for Decision-Makers
M&G operates in a capital-intensive, highly regulated financial services sector where supplier and buyer power, regulatory shifts, and rivalry shape margins and growth prospects. Our snapshot highlights key pressures like fee compression and product substitution but omits detailed ratings and scenario analysis. Unlock the full Porter's Five Forces Analysis for force-by-force scores, visuals, and strategic implications to inform investment or strategy decisions.
Suppliers Bargaining Power

Dependence on star investment talent
Experienced portfolio managers and analysts remain scarce and highly mobile, giving senior talent leverage over pay and resources; in 2024 the asset-management sector continued to prize star managers as retention drivers. The departure of a high-profile manager can trigger material asset outflows and reputational risk, as seen industry-wide in 2024. M&G must invest in culture, targeted incentives and clear succession plans to mitigate supplier power. Multi-team processes and systematized research reduce key-person risk and protect continuity.
Market data and index licensors
Essential inputs like benchmarks and analytics from MSCI (over 1,600 indexes) and Bloomberg (around 325,000 terminals) have limited substitutes, giving licensors pricing power that can squeeze margins on passive and benchmark-aware strategies. Long-term contracts and multi-vendor setups can temper exposure; M&G’s scale (AUM near £300bn in 2024) aids negotiation, but switching costs remain material.

Custody, fund admin, and transfer agents
Global custody and fund administration remain concentrated in 2024, led by BNY Mellon, State Street, Citi, J.P. Morgan and Northern Trust, which together account for roughly two-thirds of the market; this creates moderate supplier power. High service, resiliency and regulatory standards constrain rapid switching. Volume-based pricing and multi-provider setups can rebalance terms, while operational due diligence and automation (RPA/API) steadily lower dependency risks.

Reinsurers and capital partners (life)
Life products depend on reinsurers for risk transfer and capital efficiency; after 2023 losses the 2024 reinsurance hard market tightened capacity and margins—Swiss Re reported global reinsurance premiums ≈ USD 230bn in 2023. Diversifying counterparties and selectively retaining risk when pricing is poor, supported by advanced risk analytics, strengthens negotiating leverage.
- Reinsurance dependence
- 2024 hard market impact
- Diversify counterparties
- Use risk analytics to negotiate
Technology and cloud vendors
Core systems, cloud infrastructure and cybersecurity are mission critical and concentrated among a few suppliers (AWS ~32%, Microsoft Azure ~23%, Google Cloud ~10% in 2024), creating strong supplier bargaining power; 92% of enterprises reported multi‑cloud use in 2024, amplifying integration complexity. M&G can mitigate risk via modular architectures, open APIs, contractual exit rights, scale procurement and shared shared services to improve pricing and support.
- Concentration: AWS 32% / Azure 23% / GCP 10% (2024)
- Multi‑cloud adoption: 92% of enterprises (Flexera 2024)
- Mitigants: modular design, open APIs, exit clauses, pooled procurement
Mixed supplier power: scarce senior talent, index/custody concentration, cloud & reinsurance
Supplier power at M&G is mixed: scarce senior talent drives retention costs (AUM ~£300bn in 2024) and can cause outflows; benchmark/licensor concentration (MSCI ~1,600 indexes; Bloomberg ~325,000 terminals) and custody concentration (~66% market) squeeze margins; cloud (AWS 32%/Azure 23%/GCP 10%) and reinsurance (global premiums ~USD230bn 2023) create negotiating pressure mitigated by diversification and tech investments.
| Supplier | 2023–24 metric |
|---|---|
| Talent | AUM ~£300bn (2024) |
| Indexes/Terminals | MSCI ~1,600 / Bloomberg ~325k |
| Custody | Top 5 ≈66% |
| Cloud | AWS32%/Azure23%/GCP10% |
| Reinsurance | Premiums ≈USD230bn (2023) |
What is included in the product
 Detailed Word Document
Uncovers key drivers of competition, customer influence, and market entry risks tailored exclusively to M&G, identifying disruptive forces and substitutes that threaten market share; evaluates supplier and buyer control and their impact on pricing and profitability.

 Customizable Excel Spreadsheet
M&G Porter's Five Forces delivers a one-sheet, customizable view of competitive pressure with instant spider charts for quick decision-making, easy deck-ready export and no macros—ideal for scenario tweaks (pre/post regulation, new entrants) by non-finance users.
Customers Bargaining Power

Institutional fee negotiation
Pension funds, insurers and sovereigns with mandates often exceeding $1bn push hard on fees and bespoke terms; consultants, advising over 70% of institutional searches, amplify fee and performance scrutiny. M&G must stress demonstrable outcomes, bespoke solutions and private-markets access to retain mandates; performance-linked fees (increasingly common) help align interests and defend value.
Retail platforms and advisers
Retail platforms and advisers concentrate distribution bargaining power, with UK platforms holding c.£1.3tn AUA in 2024 and the top five platforms controlling roughly 60% of flows, amplifying pressure on managers like M&G. Shelf space, rebate structures and due-diligence criteria directly shape product visibility and pricing, often dictating distribution economics. Clear value propositions and high service levels are essential to stay visible, while D2C channels, growing double digits in 2024, can partially rebalance dependence.

Transparency and comparability
Regulations and data tools now make fees, risks and performance directly comparable, raising client switching propensity and compressing margins on undifferentiated products. M&G must foreground net-of-fee outcomes and unique capabilities to preserve pricing power. Consistent communication and standardized reporting reduce perceived switching benefits and help retain clients. Clear, outcome-focused metrics differentiate offerings in a transparent market.

Performance sensitivity and churn
Clients frequently react to short-term underperformance with elevated redemption risk, a pattern noted in Morningstar 2024 investor-behaviour research linking 12-month underperformance to higher outflows. Multi-asset and outcome-oriented mandates smooth returns and have been shown to reduce churn. Clear time-horizon framing supports client discipline. Strong client service and investor education limit procyclical withdrawals.
- redemption-risk: Morningstar 2024 links 12-month underperformance to outflows
- smoothing: multi-asset/outcome mandates reduce churn
- time-horizon: framing preserves discipline
- service/education: curb procyclical withdrawals
Demand for private and sustainable assets
Buyers increasingly demand private credit, infrastructure and credible ESG integration, with global private capital dry powder near $3.5tn in 2024 and private debt fundraising up about 10% year‑on‑year, strengthening buyer selectivity. Access constraints and complexity lower buyer power where M&G provides scarce sourcing, co‑investments and customized vehicles increase client stickiness, while demonstrable impact and robust data are essential to justify fees.
- Demand: private capital dry powder ~$3.5tn (2024)
- Buyer power reduced by scarce capabilities
- Stickiness via co‑investments/custom vehicles
- Fees justified by measurable impact and data
Platforms tighten margins: £1.3tn AUA, $3.5tn dry powder
Institutions push fees and bespoke terms; consultants amplify scrutiny. UK platforms hold c.£1.3tn AUA with top five ~60% of flows, concentrating distribution power. Transparency and comparability compress margins; Morningstar 2024 links 12-month underperformance to higher outflows. Private capital dry powder ~$3.5tn and private debt fundraising +10% y/y (2024) raise buyer selectivity.
| Metric | 2024 |
|---|---|
| UK platforms AUA | £1.3tn |
| Top-5 platform share | ~60% |
| Private capital dry powder | ~$3.5tn |
| Private debt fundraising | +10% y/y |
What You See Is What You Get
M&G Porter's Five Forces Analysis
The M&G Porter's Five Forces Analysis delivers a concise evaluation of competitive rivalry, supplier and buyer power, threat of new entrants and substitutes, and strategic implications for M&G. It highlights key risks and opportunities with actionable recommendations. This preview is the exact, fully formatted document you’ll receive immediately after purchase.

A Must-Have Tool for Decision-Makers
M&G operates in a capital-intensive, highly regulated financial services sector where supplier and buyer power, regulatory shifts, and rivalry shape margins and growth prospects. Our snapshot highlights key pressures like fee compression and product substitution but omits detailed ratings and scenario analysis. Unlock the full Porter's Five Forces Analysis for force-by-force scores, visuals, and strategic implications to inform investment or strategy decisions.
Suppliers Bargaining Power
Dependence on star investment talent
Experienced portfolio managers and analysts remain scarce and highly mobile, giving senior talent leverage over pay and resources; in 2024 the asset-management sector continued to prize star managers as retention drivers. The departure of a high-profile manager can trigger material asset outflows and reputational risk, as seen industry-wide in 2024. M&G must invest in culture, targeted incentives and clear succession plans to mitigate supplier power. Multi-team processes and systematized research reduce key-person risk and protect continuity.
Market data and index licensors
Essential inputs like benchmarks and analytics from MSCI (over 1,600 indexes) and Bloomberg (around 325,000 terminals) have limited substitutes, giving licensors pricing power that can squeeze margins on passive and benchmark-aware strategies. Long-term contracts and multi-vendor setups can temper exposure; M&G’s scale (AUM near £300bn in 2024) aids negotiation, but switching costs remain material.
Custody, fund admin, and transfer agents
Global custody and fund administration remain concentrated in 2024, led by BNY Mellon, State Street, Citi, J.P. Morgan and Northern Trust, which together account for roughly two-thirds of the market; this creates moderate supplier power. High service, resiliency and regulatory standards constrain rapid switching. Volume-based pricing and multi-provider setups can rebalance terms, while operational due diligence and automation (RPA/API) steadily lower dependency risks.
Reinsurers and capital partners (life)
Life products depend on reinsurers for risk transfer and capital efficiency; after 2023 losses the 2024 reinsurance hard market tightened capacity and margins—Swiss Re reported global reinsurance premiums ≈ USD 230bn in 2023. Diversifying counterparties and selectively retaining risk when pricing is poor, supported by advanced risk analytics, strengthens negotiating leverage.
- Reinsurance dependence
- 2024 hard market impact
- Diversify counterparties
- Use risk analytics to negotiate
Technology and cloud vendors
Core systems, cloud infrastructure and cybersecurity are mission critical and concentrated among a few suppliers (AWS ~32%, Microsoft Azure ~23%, Google Cloud ~10% in 2024), creating strong supplier bargaining power; 92% of enterprises reported multi‑cloud use in 2024, amplifying integration complexity. M&G can mitigate risk via modular architectures, open APIs, contractual exit rights, scale procurement and shared shared services to improve pricing and support.
- Concentration: AWS 32% / Azure 23% / GCP 10% (2024)
- Multi‑cloud adoption: 92% of enterprises (Flexera 2024)
- Mitigants: modular design, open APIs, exit clauses, pooled procurement
Mixed supplier power: scarce senior talent, index/custody concentration, cloud & reinsurance
Supplier power at M&G is mixed: scarce senior talent drives retention costs (AUM ~£300bn in 2024) and can cause outflows; benchmark/licensor concentration (MSCI ~1,600 indexes; Bloomberg ~325,000 terminals) and custody concentration (~66% market) squeeze margins; cloud (AWS 32%/Azure 23%/GCP 10%) and reinsurance (global premiums ~USD230bn 2023) create negotiating pressure mitigated by diversification and tech investments.
| Supplier | 2023–24 metric |
|---|---|
| Talent | AUM ~£300bn (2024) |
| Indexes/Terminals | MSCI ~1,600 / Bloomberg ~325k |
| Custody | Top 5 ≈66% |
| Cloud | AWS32%/Azure23%/GCP10% |
| Reinsurance | Premiums ≈USD230bn (2023) |
What is included in the product
Detailed Word Document
Uncovers key drivers of competition, customer influence, and market entry risks tailored exclusively to M&G, identifying disruptive forces and substitutes that threaten market share; evaluates supplier and buyer control and their impact on pricing and profitability.
Customizable Excel Spreadsheet
M&G Porter's Five Forces delivers a one-sheet, customizable view of competitive pressure with instant spider charts for quick decision-making, easy deck-ready export and no macros—ideal for scenario tweaks (pre/post regulation, new entrants) by non-finance users.
Customers Bargaining Power
Institutional fee negotiation
Pension funds, insurers and sovereigns with mandates often exceeding $1bn push hard on fees and bespoke terms; consultants, advising over 70% of institutional searches, amplify fee and performance scrutiny. M&G must stress demonstrable outcomes, bespoke solutions and private-markets access to retain mandates; performance-linked fees (increasingly common) help align interests and defend value.
Retail platforms and advisers
Retail platforms and advisers concentrate distribution bargaining power, with UK platforms holding c.£1.3tn AUA in 2024 and the top five platforms controlling roughly 60% of flows, amplifying pressure on managers like M&G. Shelf space, rebate structures and due-diligence criteria directly shape product visibility and pricing, often dictating distribution economics. Clear value propositions and high service levels are essential to stay visible, while D2C channels, growing double digits in 2024, can partially rebalance dependence.
Transparency and comparability
Regulations and data tools now make fees, risks and performance directly comparable, raising client switching propensity and compressing margins on undifferentiated products. M&G must foreground net-of-fee outcomes and unique capabilities to preserve pricing power. Consistent communication and standardized reporting reduce perceived switching benefits and help retain clients. Clear, outcome-focused metrics differentiate offerings in a transparent market.
Performance sensitivity and churn
Clients frequently react to short-term underperformance with elevated redemption risk, a pattern noted in Morningstar 2024 investor-behaviour research linking 12-month underperformance to higher outflows. Multi-asset and outcome-oriented mandates smooth returns and have been shown to reduce churn. Clear time-horizon framing supports client discipline. Strong client service and investor education limit procyclical withdrawals.
- redemption-risk: Morningstar 2024 links 12-month underperformance to outflows
- smoothing: multi-asset/outcome mandates reduce churn
- time-horizon: framing preserves discipline
- service/education: curb procyclical withdrawals
Demand for private and sustainable assets
Buyers increasingly demand private credit, infrastructure and credible ESG integration, with global private capital dry powder near $3.5tn in 2024 and private debt fundraising up about 10% year‑on‑year, strengthening buyer selectivity. Access constraints and complexity lower buyer power where M&G provides scarce sourcing, co‑investments and customized vehicles increase client stickiness, while demonstrable impact and robust data are essential to justify fees.
- Demand: private capital dry powder ~$3.5tn (2024)
- Buyer power reduced by scarce capabilities
- Stickiness via co‑investments/custom vehicles
- Fees justified by measurable impact and data
Platforms tighten margins: £1.3tn AUA, $3.5tn dry powder
Institutions push fees and bespoke terms; consultants amplify scrutiny. UK platforms hold c.£1.3tn AUA with top five ~60% of flows, concentrating distribution power. Transparency and comparability compress margins; Morningstar 2024 links 12-month underperformance to higher outflows. Private capital dry powder ~$3.5tn and private debt fundraising +10% y/y (2024) raise buyer selectivity.
| Metric | 2024 |
|---|---|
| UK platforms AUA | £1.3tn |
| Top-5 platform share | ~60% |
| Private capital dry powder | ~$3.5tn |
| Private debt fundraising | +10% y/y |
What You See Is What You Get
M&G Porter's Five Forces Analysis
The M&G Porter's Five Forces Analysis delivers a concise evaluation of competitive rivalry, supplier and buyer power, threat of new entrants and substitutes, and strategic implications for M&G. It highlights key risks and opportunities with actionable recommendations. This preview is the exact, fully formatted document you’ll receive immediately after purchase.
Original: $10.00
-65%$10.00
$3.50Description
A Must-Have Tool for Decision-Makers
M&G operates in a capital-intensive, highly regulated financial services sector where supplier and buyer power, regulatory shifts, and rivalry shape margins and growth prospects. Our snapshot highlights key pressures like fee compression and product substitution but omits detailed ratings and scenario analysis. Unlock the full Porter's Five Forces Analysis for force-by-force scores, visuals, and strategic implications to inform investment or strategy decisions.
Suppliers Bargaining Power
Dependence on star investment talent
Experienced portfolio managers and analysts remain scarce and highly mobile, giving senior talent leverage over pay and resources; in 2024 the asset-management sector continued to prize star managers as retention drivers. The departure of a high-profile manager can trigger material asset outflows and reputational risk, as seen industry-wide in 2024. M&G must invest in culture, targeted incentives and clear succession plans to mitigate supplier power. Multi-team processes and systematized research reduce key-person risk and protect continuity.
Market data and index licensors
Essential inputs like benchmarks and analytics from MSCI (over 1,600 indexes) and Bloomberg (around 325,000 terminals) have limited substitutes, giving licensors pricing power that can squeeze margins on passive and benchmark-aware strategies. Long-term contracts and multi-vendor setups can temper exposure; M&G’s scale (AUM near £300bn in 2024) aids negotiation, but switching costs remain material.
Custody, fund admin, and transfer agents
Global custody and fund administration remain concentrated in 2024, led by BNY Mellon, State Street, Citi, J.P. Morgan and Northern Trust, which together account for roughly two-thirds of the market; this creates moderate supplier power. High service, resiliency and regulatory standards constrain rapid switching. Volume-based pricing and multi-provider setups can rebalance terms, while operational due diligence and automation (RPA/API) steadily lower dependency risks.
Reinsurers and capital partners (life)
Life products depend on reinsurers for risk transfer and capital efficiency; after 2023 losses the 2024 reinsurance hard market tightened capacity and margins—Swiss Re reported global reinsurance premiums ≈ USD 230bn in 2023. Diversifying counterparties and selectively retaining risk when pricing is poor, supported by advanced risk analytics, strengthens negotiating leverage.
- Reinsurance dependence
- 2024 hard market impact
- Diversify counterparties
- Use risk analytics to negotiate
Technology and cloud vendors
Core systems, cloud infrastructure and cybersecurity are mission critical and concentrated among a few suppliers (AWS ~32%, Microsoft Azure ~23%, Google Cloud ~10% in 2024), creating strong supplier bargaining power; 92% of enterprises reported multi‑cloud use in 2024, amplifying integration complexity. M&G can mitigate risk via modular architectures, open APIs, contractual exit rights, scale procurement and shared shared services to improve pricing and support.
- Concentration: AWS 32% / Azure 23% / GCP 10% (2024)
- Multi‑cloud adoption: 92% of enterprises (Flexera 2024)
- Mitigants: modular design, open APIs, exit clauses, pooled procurement
Mixed supplier power: scarce senior talent, index/custody concentration, cloud & reinsurance
Supplier power at M&G is mixed: scarce senior talent drives retention costs (AUM ~£300bn in 2024) and can cause outflows; benchmark/licensor concentration (MSCI ~1,600 indexes; Bloomberg ~325,000 terminals) and custody concentration (~66% market) squeeze margins; cloud (AWS 32%/Azure 23%/GCP 10%) and reinsurance (global premiums ~USD230bn 2023) create negotiating pressure mitigated by diversification and tech investments.
| Supplier | 2023–24 metric |
|---|---|
| Talent | AUM ~£300bn (2024) |
| Indexes/Terminals | MSCI ~1,600 / Bloomberg ~325k |
| Custody | Top 5 ≈66% |
| Cloud | AWS32%/Azure23%/GCP10% |
| Reinsurance | Premiums ≈USD230bn (2023) |
What is included in the product
Detailed Word Document
Uncovers key drivers of competition, customer influence, and market entry risks tailored exclusively to M&G, identifying disruptive forces and substitutes that threaten market share; evaluates supplier and buyer control and their impact on pricing and profitability.
Customizable Excel Spreadsheet
M&G Porter's Five Forces delivers a one-sheet, customizable view of competitive pressure with instant spider charts for quick decision-making, easy deck-ready export and no macros—ideal for scenario tweaks (pre/post regulation, new entrants) by non-finance users.
Customers Bargaining Power
Institutional fee negotiation
Pension funds, insurers and sovereigns with mandates often exceeding $1bn push hard on fees and bespoke terms; consultants, advising over 70% of institutional searches, amplify fee and performance scrutiny. M&G must stress demonstrable outcomes, bespoke solutions and private-markets access to retain mandates; performance-linked fees (increasingly common) help align interests and defend value.
Retail platforms and advisers
Retail platforms and advisers concentrate distribution bargaining power, with UK platforms holding c.£1.3tn AUA in 2024 and the top five platforms controlling roughly 60% of flows, amplifying pressure on managers like M&G. Shelf space, rebate structures and due-diligence criteria directly shape product visibility and pricing, often dictating distribution economics. Clear value propositions and high service levels are essential to stay visible, while D2C channels, growing double digits in 2024, can partially rebalance dependence.
Transparency and comparability
Regulations and data tools now make fees, risks and performance directly comparable, raising client switching propensity and compressing margins on undifferentiated products. M&G must foreground net-of-fee outcomes and unique capabilities to preserve pricing power. Consistent communication and standardized reporting reduce perceived switching benefits and help retain clients. Clear, outcome-focused metrics differentiate offerings in a transparent market.
Performance sensitivity and churn
Clients frequently react to short-term underperformance with elevated redemption risk, a pattern noted in Morningstar 2024 investor-behaviour research linking 12-month underperformance to higher outflows. Multi-asset and outcome-oriented mandates smooth returns and have been shown to reduce churn. Clear time-horizon framing supports client discipline. Strong client service and investor education limit procyclical withdrawals.
- redemption-risk: Morningstar 2024 links 12-month underperformance to outflows
- smoothing: multi-asset/outcome mandates reduce churn
- time-horizon: framing preserves discipline
- service/education: curb procyclical withdrawals
Demand for private and sustainable assets
Buyers increasingly demand private credit, infrastructure and credible ESG integration, with global private capital dry powder near $3.5tn in 2024 and private debt fundraising up about 10% year‑on‑year, strengthening buyer selectivity. Access constraints and complexity lower buyer power where M&G provides scarce sourcing, co‑investments and customized vehicles increase client stickiness, while demonstrable impact and robust data are essential to justify fees.
- Demand: private capital dry powder ~$3.5tn (2024)
- Buyer power reduced by scarce capabilities
- Stickiness via co‑investments/custom vehicles
- Fees justified by measurable impact and data
Platforms tighten margins: £1.3tn AUA, $3.5tn dry powder
Institutions push fees and bespoke terms; consultants amplify scrutiny. UK platforms hold c.£1.3tn AUA with top five ~60% of flows, concentrating distribution power. Transparency and comparability compress margins; Morningstar 2024 links 12-month underperformance to higher outflows. Private capital dry powder ~$3.5tn and private debt fundraising +10% y/y (2024) raise buyer selectivity.
| Metric | 2024 |
|---|---|
| UK platforms AUA | £1.3tn |
| Top-5 platform share | ~60% |
| Private capital dry powder | ~$3.5tn |
| Private debt fundraising | +10% y/y |
What You See Is What You Get
M&G Porter's Five Forces Analysis
The M&G Porter's Five Forces Analysis delivers a concise evaluation of competitive rivalry, supplier and buyer power, threat of new entrants and substitutes, and strategic implications for M&G. It highlights key risks and opportunities with actionable recommendations. This preview is the exact, fully formatted document you’ll receive immediately after purchase.











