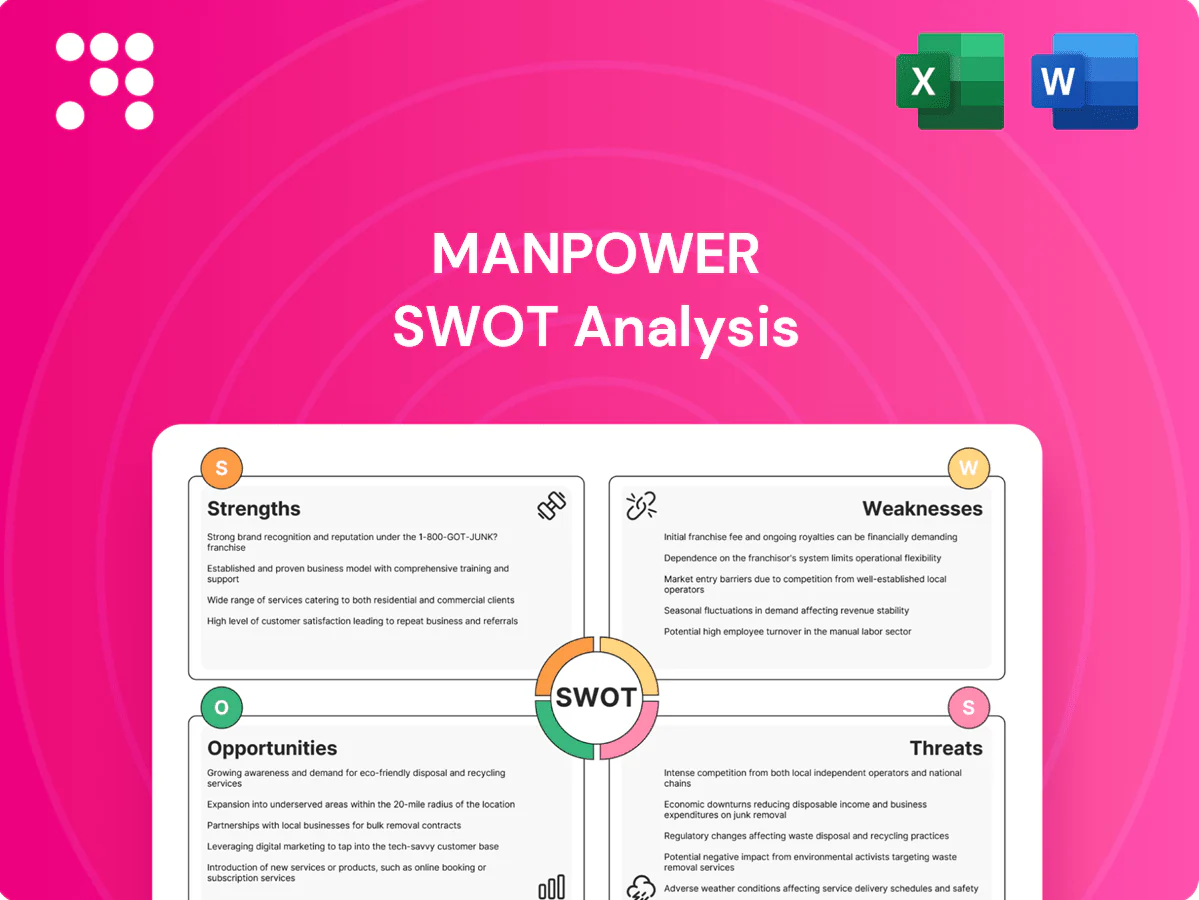
Manpower SWOT Analysis

Elevate Your Analysis with the Complete SWOT Report
Manpower’s SWOT reveals a global footprint and diversified services but highlights challenges from tech disruption and margin pressure in staffing cycles. Our full SWOT unpacks competitive moats, regulatory risks, and growth levers with data-driven insights. Purchase the complete report for a professionally formatted, editable Word and Excel package to support strategic decisions and investments.
Strengths

Global brand reach
ManpowerGroup operates in 75+ countries with well-known brands, giving access to broad client and candidate pools. This scale strengthens credibility for enterprise deals and cross-border programs, reducing client acquisition costs and increasing placement velocity. Global reach also diversifies revenue across cycles, supporting roughly 400,000 client relationships and multibillion-dollar annual revenues.
Diverse service portfolio
ManpowerGroup's diverse portfolio—staffing, RPO, MSP, talent assessment, training and outsourcing—leverages its presence in 75+ countries and 400,000+ clients to smooth revenue cycles and enable cross-sell from temp staffing to higher-margin solutions. Integrated offerings deliver end-to-end workforce solutions, increasing client stickiness and expanding wallet share through bundled services and long-term contracts.

Enterprise client relationships
Long-standing ties with large employers drive recurring volume and multi-year contracts, reinforced by ManpowerGroup serving over 400,000 clients across roughly 75 countries. Deep account knowledge from global client footprints measurably improves fill rates and time-to-hire through tailored sourcing and talent pipeline management. Embedded programs raise switching costs by integrating processes and technology, while strong client referenceability supports new enterprise wins.

Operational scale and delivery
Manpower's operational scale—operating in 75 countries with roughly 2,700 branch offices—enables rapid fulfillment through extensive branch networks and shared delivery centers. Standardized processes and global playbooks improve quality and compliance while the scale supports competitive pricing without sacrificing service levels. This footprint accelerates global rollouts of new solutions and productized services.
- 75 countries, ~2,700 offices
- Standardized playbooks → higher compliance
- Scale enables competitive pricing and faster global rollouts
Talent data and assessment
Robust talent assessments and placement data drive more accurate candidate-job matching, reducing mismatches and improving client satisfaction; ManpowerGroup's 2024 Talent Shortage Survey highlights sustained demand for data-led hiring. Better fit lowers attrition and supports workforce planning by identifying skill gaps and training priorities. Data-driven placement differentiates against commodity staffing rivals and informs targeted reskilling investments.
- Improves match quality
- Reduces attrition
- Enables workforce planning
- Differentiates services
Global talent platform: 75+ countries, ~2,700 offices, 400,000+ clients
ManpowerGroup's 75+ country footprint and ~2,700 offices serve 400,000+ clients, enabling multibillion-dollar diversified revenue and faster enterprise wins. Integrated staffing, RPO, MSP and training drive cross-sell and higher margins. Data-led assessments (2024 Talent Shortage Survey) improve match quality, lower attrition and raise switching costs.
| Metric | Value |
|---|---|
| Countries | 75+ |
| Offices | ~2,700 |
| Clients | 400,000+ |
| Revenue | Multibillion USD |
What is included in the product
 Detailed Word Document
Provides a concise strategic overview of Manpower's internal strengths and weaknesses and external opportunities and threats, highlighting competitive position, growth drivers, operational gaps, and market risks shaping its future.

 Customizable Excel Spreadsheet
Provides a focused Manpower SWOT matrix to quickly identify workforce strengths, gaps and opportunities for staffing optimization; editable format enables fast updates to reflect hiring shifts and supports clear executive presentations.
Weaknesses

Cyclical demand exposure
Staffing volumes closely track macro employment cycles: BLS data showed temporary help accounted for about 1.9% of US nonfarm employment in 2024, highlighting dependence on hiring trends. During downturns, client hiring freezes and lower temp usage compress revenue and margins. Sensitivity to GDP and business confidence amplifies quarter-to-quarter volatility. Rapid cycle turns make demand forecasting and workforce matching materially harder.
Margin pressure
High competition in staffing keeps gross margins thin—industry averages near 15% in 2024—so general staffing is especially exposed. Wage inflation ran around 4% year-over-year in 2024 (BLS), and pricing concessions further compress spreads. Large clients routinely demand volume discounts, eroding unit economics. Shifting mix toward advisory services can lift margins but requires time and upfront investment.

Consultant turnover
Consultant turnover often exceeds 20% annually, disrupting client delivery and relationships as internal recruiter churn delays staffing; replacement costs commonly run ~1.5x a consultant’s annual salary. Lost know-how increases ramp time by roughly 30%, raising project costs and quality variance across offices and regions. In commoditized segments this inconsistency erodes differentiation and client retention.

Complex compliance burden
Operating across ~75 countries and territories raises complex labor-law and co-employment risks; enforcement activity led to hundreds of millions of dollars in fines and recoveries across 2023–24, amplifying reputational exposure. Compliance failures incur direct penalties and remediation costs, contractor classification and pay‑equity adjustments lift operating expense, and compliance overhead slows entry into new niches.
- Jurisdictional scope: ~75 countries
- Enforcement: hundreds of millions in 2023–24
- Higher OPEX for classification & pay equity
- Slower expansion into niche markets
Technology gaps vs. natives
Digital-first platforms iterate matching algorithms and UX weekly to daily, while legacy systems in many enterprises update quarterly, creating a responsiveness gap; Gartner 2024 found 60% of organizations report technical debt slows digital initiatives. Modernization demands sustained capex and intensive change management, and integrating disparate brands and tools is nontrivial operationally and financially.
- Iteration cadence: legacy quarterly vs digital weekly/daily
- Gartner 2024: 60% cite technical debt
- High capex and change mgmt
- Complex cross-brand/tool integration
Temp staffing volatility: 1.9% of jobs; margins ~15%, turnover >20%
Revenue and margins are cyclical: temps were 1.9% of US nonfarm jobs in 2024 and industry gross margins averaged ~15% (2024), amplifying volatility. Consultant turnover >20% p.a. raises replacement cost (~1.5x salary) and ramp time ~30%. Global operations (~75 countries) drove hundreds of millions in enforcement costs in 2023–24; technical debt slows digital parity.
| Metric | 2023–24 |
|---|---|
| Temp share US jobs | 1.9% |
| Industry gross margin | ~15% |
| Consultant turnover | >20% p.a. |
| Enforcement costs | Hundreds of millions |
Preview the Actual Deliverable
Manpower SWOT Analysis
This is the actual Manpower SWOT analysis document you’ll receive upon purchase—no surprises, just professional quality. The preview below is taken directly from the full report and reflects strengths, weaknesses, opportunities and threats analyzed in detail. Buy now to unlock the complete, editable version ready for use.

Elevate Your Analysis with the Complete SWOT Report
Manpower’s SWOT reveals a global footprint and diversified services but highlights challenges from tech disruption and margin pressure in staffing cycles. Our full SWOT unpacks competitive moats, regulatory risks, and growth levers with data-driven insights. Purchase the complete report for a professionally formatted, editable Word and Excel package to support strategic decisions and investments.
Strengths
Global brand reach
ManpowerGroup operates in 75+ countries with well-known brands, giving access to broad client and candidate pools. This scale strengthens credibility for enterprise deals and cross-border programs, reducing client acquisition costs and increasing placement velocity. Global reach also diversifies revenue across cycles, supporting roughly 400,000 client relationships and multibillion-dollar annual revenues.
Diverse service portfolio
ManpowerGroup's diverse portfolio—staffing, RPO, MSP, talent assessment, training and outsourcing—leverages its presence in 75+ countries and 400,000+ clients to smooth revenue cycles and enable cross-sell from temp staffing to higher-margin solutions. Integrated offerings deliver end-to-end workforce solutions, increasing client stickiness and expanding wallet share through bundled services and long-term contracts.
Enterprise client relationships
Long-standing ties with large employers drive recurring volume and multi-year contracts, reinforced by ManpowerGroup serving over 400,000 clients across roughly 75 countries. Deep account knowledge from global client footprints measurably improves fill rates and time-to-hire through tailored sourcing and talent pipeline management. Embedded programs raise switching costs by integrating processes and technology, while strong client referenceability supports new enterprise wins.
Operational scale and delivery
Manpower's operational scale—operating in 75 countries with roughly 2,700 branch offices—enables rapid fulfillment through extensive branch networks and shared delivery centers. Standardized processes and global playbooks improve quality and compliance while the scale supports competitive pricing without sacrificing service levels. This footprint accelerates global rollouts of new solutions and productized services.
- 75 countries, ~2,700 offices
- Standardized playbooks → higher compliance
- Scale enables competitive pricing and faster global rollouts
Talent data and assessment
Robust talent assessments and placement data drive more accurate candidate-job matching, reducing mismatches and improving client satisfaction; ManpowerGroup's 2024 Talent Shortage Survey highlights sustained demand for data-led hiring. Better fit lowers attrition and supports workforce planning by identifying skill gaps and training priorities. Data-driven placement differentiates against commodity staffing rivals and informs targeted reskilling investments.
- Improves match quality
- Reduces attrition
- Enables workforce planning
- Differentiates services
Global talent platform: 75+ countries, ~2,700 offices, 400,000+ clients
ManpowerGroup's 75+ country footprint and ~2,700 offices serve 400,000+ clients, enabling multibillion-dollar diversified revenue and faster enterprise wins. Integrated staffing, RPO, MSP and training drive cross-sell and higher margins. Data-led assessments (2024 Talent Shortage Survey) improve match quality, lower attrition and raise switching costs.
| Metric | Value |
|---|---|
| Countries | 75+ |
| Offices | ~2,700 |
| Clients | 400,000+ |
| Revenue | Multibillion USD |
What is included in the product
Detailed Word Document
Provides a concise strategic overview of Manpower's internal strengths and weaknesses and external opportunities and threats, highlighting competitive position, growth drivers, operational gaps, and market risks shaping its future.
Customizable Excel Spreadsheet
Provides a focused Manpower SWOT matrix to quickly identify workforce strengths, gaps and opportunities for staffing optimization; editable format enables fast updates to reflect hiring shifts and supports clear executive presentations.
Weaknesses
Cyclical demand exposure
Staffing volumes closely track macro employment cycles: BLS data showed temporary help accounted for about 1.9% of US nonfarm employment in 2024, highlighting dependence on hiring trends. During downturns, client hiring freezes and lower temp usage compress revenue and margins. Sensitivity to GDP and business confidence amplifies quarter-to-quarter volatility. Rapid cycle turns make demand forecasting and workforce matching materially harder.
Margin pressure
High competition in staffing keeps gross margins thin—industry averages near 15% in 2024—so general staffing is especially exposed. Wage inflation ran around 4% year-over-year in 2024 (BLS), and pricing concessions further compress spreads. Large clients routinely demand volume discounts, eroding unit economics. Shifting mix toward advisory services can lift margins but requires time and upfront investment.
Consultant turnover
Consultant turnover often exceeds 20% annually, disrupting client delivery and relationships as internal recruiter churn delays staffing; replacement costs commonly run ~1.5x a consultant’s annual salary. Lost know-how increases ramp time by roughly 30%, raising project costs and quality variance across offices and regions. In commoditized segments this inconsistency erodes differentiation and client retention.
Complex compliance burden
Operating across ~75 countries and territories raises complex labor-law and co-employment risks; enforcement activity led to hundreds of millions of dollars in fines and recoveries across 2023–24, amplifying reputational exposure. Compliance failures incur direct penalties and remediation costs, contractor classification and pay‑equity adjustments lift operating expense, and compliance overhead slows entry into new niches.
- Jurisdictional scope: ~75 countries
- Enforcement: hundreds of millions in 2023–24
- Higher OPEX for classification & pay equity
- Slower expansion into niche markets
Technology gaps vs. natives
Digital-first platforms iterate matching algorithms and UX weekly to daily, while legacy systems in many enterprises update quarterly, creating a responsiveness gap; Gartner 2024 found 60% of organizations report technical debt slows digital initiatives. Modernization demands sustained capex and intensive change management, and integrating disparate brands and tools is nontrivial operationally and financially.
- Iteration cadence: legacy quarterly vs digital weekly/daily
- Gartner 2024: 60% cite technical debt
- High capex and change mgmt
- Complex cross-brand/tool integration
Temp staffing volatility: 1.9% of jobs; margins ~15%, turnover >20%
Revenue and margins are cyclical: temps were 1.9% of US nonfarm jobs in 2024 and industry gross margins averaged ~15% (2024), amplifying volatility. Consultant turnover >20% p.a. raises replacement cost (~1.5x salary) and ramp time ~30%. Global operations (~75 countries) drove hundreds of millions in enforcement costs in 2023–24; technical debt slows digital parity.
| Metric | 2023–24 |
|---|---|
| Temp share US jobs | 1.9% |
| Industry gross margin | ~15% |
| Consultant turnover | >20% p.a. |
| Enforcement costs | Hundreds of millions |
Preview the Actual Deliverable
Manpower SWOT Analysis
This is the actual Manpower SWOT analysis document you’ll receive upon purchase—no surprises, just professional quality. The preview below is taken directly from the full report and reflects strengths, weaknesses, opportunities and threats analyzed in detail. Buy now to unlock the complete, editable version ready for use.
Description
Elevate Your Analysis with the Complete SWOT Report
Manpower’s SWOT reveals a global footprint and diversified services but highlights challenges from tech disruption and margin pressure in staffing cycles. Our full SWOT unpacks competitive moats, regulatory risks, and growth levers with data-driven insights. Purchase the complete report for a professionally formatted, editable Word and Excel package to support strategic decisions and investments.
Strengths
Global brand reach
ManpowerGroup operates in 75+ countries with well-known brands, giving access to broad client and candidate pools. This scale strengthens credibility for enterprise deals and cross-border programs, reducing client acquisition costs and increasing placement velocity. Global reach also diversifies revenue across cycles, supporting roughly 400,000 client relationships and multibillion-dollar annual revenues.
Diverse service portfolio
ManpowerGroup's diverse portfolio—staffing, RPO, MSP, talent assessment, training and outsourcing—leverages its presence in 75+ countries and 400,000+ clients to smooth revenue cycles and enable cross-sell from temp staffing to higher-margin solutions. Integrated offerings deliver end-to-end workforce solutions, increasing client stickiness and expanding wallet share through bundled services and long-term contracts.
Enterprise client relationships
Long-standing ties with large employers drive recurring volume and multi-year contracts, reinforced by ManpowerGroup serving over 400,000 clients across roughly 75 countries. Deep account knowledge from global client footprints measurably improves fill rates and time-to-hire through tailored sourcing and talent pipeline management. Embedded programs raise switching costs by integrating processes and technology, while strong client referenceability supports new enterprise wins.
Operational scale and delivery
Manpower's operational scale—operating in 75 countries with roughly 2,700 branch offices—enables rapid fulfillment through extensive branch networks and shared delivery centers. Standardized processes and global playbooks improve quality and compliance while the scale supports competitive pricing without sacrificing service levels. This footprint accelerates global rollouts of new solutions and productized services.
- 75 countries, ~2,700 offices
- Standardized playbooks → higher compliance
- Scale enables competitive pricing and faster global rollouts
Talent data and assessment
Robust talent assessments and placement data drive more accurate candidate-job matching, reducing mismatches and improving client satisfaction; ManpowerGroup's 2024 Talent Shortage Survey highlights sustained demand for data-led hiring. Better fit lowers attrition and supports workforce planning by identifying skill gaps and training priorities. Data-driven placement differentiates against commodity staffing rivals and informs targeted reskilling investments.
- Improves match quality
- Reduces attrition
- Enables workforce planning
- Differentiates services
Global talent platform: 75+ countries, ~2,700 offices, 400,000+ clients
ManpowerGroup's 75+ country footprint and ~2,700 offices serve 400,000+ clients, enabling multibillion-dollar diversified revenue and faster enterprise wins. Integrated staffing, RPO, MSP and training drive cross-sell and higher margins. Data-led assessments (2024 Talent Shortage Survey) improve match quality, lower attrition and raise switching costs.
| Metric | Value |
|---|---|
| Countries | 75+ |
| Offices | ~2,700 |
| Clients | 400,000+ |
| Revenue | Multibillion USD |
What is included in the product
Detailed Word Document
Provides a concise strategic overview of Manpower's internal strengths and weaknesses and external opportunities and threats, highlighting competitive position, growth drivers, operational gaps, and market risks shaping its future.
Customizable Excel Spreadsheet
Provides a focused Manpower SWOT matrix to quickly identify workforce strengths, gaps and opportunities for staffing optimization; editable format enables fast updates to reflect hiring shifts and supports clear executive presentations.
Weaknesses
Cyclical demand exposure
Staffing volumes closely track macro employment cycles: BLS data showed temporary help accounted for about 1.9% of US nonfarm employment in 2024, highlighting dependence on hiring trends. During downturns, client hiring freezes and lower temp usage compress revenue and margins. Sensitivity to GDP and business confidence amplifies quarter-to-quarter volatility. Rapid cycle turns make demand forecasting and workforce matching materially harder.
Margin pressure
High competition in staffing keeps gross margins thin—industry averages near 15% in 2024—so general staffing is especially exposed. Wage inflation ran around 4% year-over-year in 2024 (BLS), and pricing concessions further compress spreads. Large clients routinely demand volume discounts, eroding unit economics. Shifting mix toward advisory services can lift margins but requires time and upfront investment.
Consultant turnover
Consultant turnover often exceeds 20% annually, disrupting client delivery and relationships as internal recruiter churn delays staffing; replacement costs commonly run ~1.5x a consultant’s annual salary. Lost know-how increases ramp time by roughly 30%, raising project costs and quality variance across offices and regions. In commoditized segments this inconsistency erodes differentiation and client retention.
Complex compliance burden
Operating across ~75 countries and territories raises complex labor-law and co-employment risks; enforcement activity led to hundreds of millions of dollars in fines and recoveries across 2023–24, amplifying reputational exposure. Compliance failures incur direct penalties and remediation costs, contractor classification and pay‑equity adjustments lift operating expense, and compliance overhead slows entry into new niches.
- Jurisdictional scope: ~75 countries
- Enforcement: hundreds of millions in 2023–24
- Higher OPEX for classification & pay equity
- Slower expansion into niche markets
Technology gaps vs. natives
Digital-first platforms iterate matching algorithms and UX weekly to daily, while legacy systems in many enterprises update quarterly, creating a responsiveness gap; Gartner 2024 found 60% of organizations report technical debt slows digital initiatives. Modernization demands sustained capex and intensive change management, and integrating disparate brands and tools is nontrivial operationally and financially.
- Iteration cadence: legacy quarterly vs digital weekly/daily
- Gartner 2024: 60% cite technical debt
- High capex and change mgmt
- Complex cross-brand/tool integration
Temp staffing volatility: 1.9% of jobs; margins ~15%, turnover >20%
Revenue and margins are cyclical: temps were 1.9% of US nonfarm jobs in 2024 and industry gross margins averaged ~15% (2024), amplifying volatility. Consultant turnover >20% p.a. raises replacement cost (~1.5x salary) and ramp time ~30%. Global operations (~75 countries) drove hundreds of millions in enforcement costs in 2023–24; technical debt slows digital parity.
| Metric | 2023–24 |
|---|---|
| Temp share US jobs | 1.9% |
| Industry gross margin | ~15% |
| Consultant turnover | >20% p.a. |
| Enforcement costs | Hundreds of millions |
Preview the Actual Deliverable
Manpower SWOT Analysis
This is the actual Manpower SWOT analysis document you’ll receive upon purchase—no surprises, just professional quality. The preview below is taken directly from the full report and reflects strengths, weaknesses, opportunities and threats analyzed in detail. Buy now to unlock the complete, editable version ready for use.











