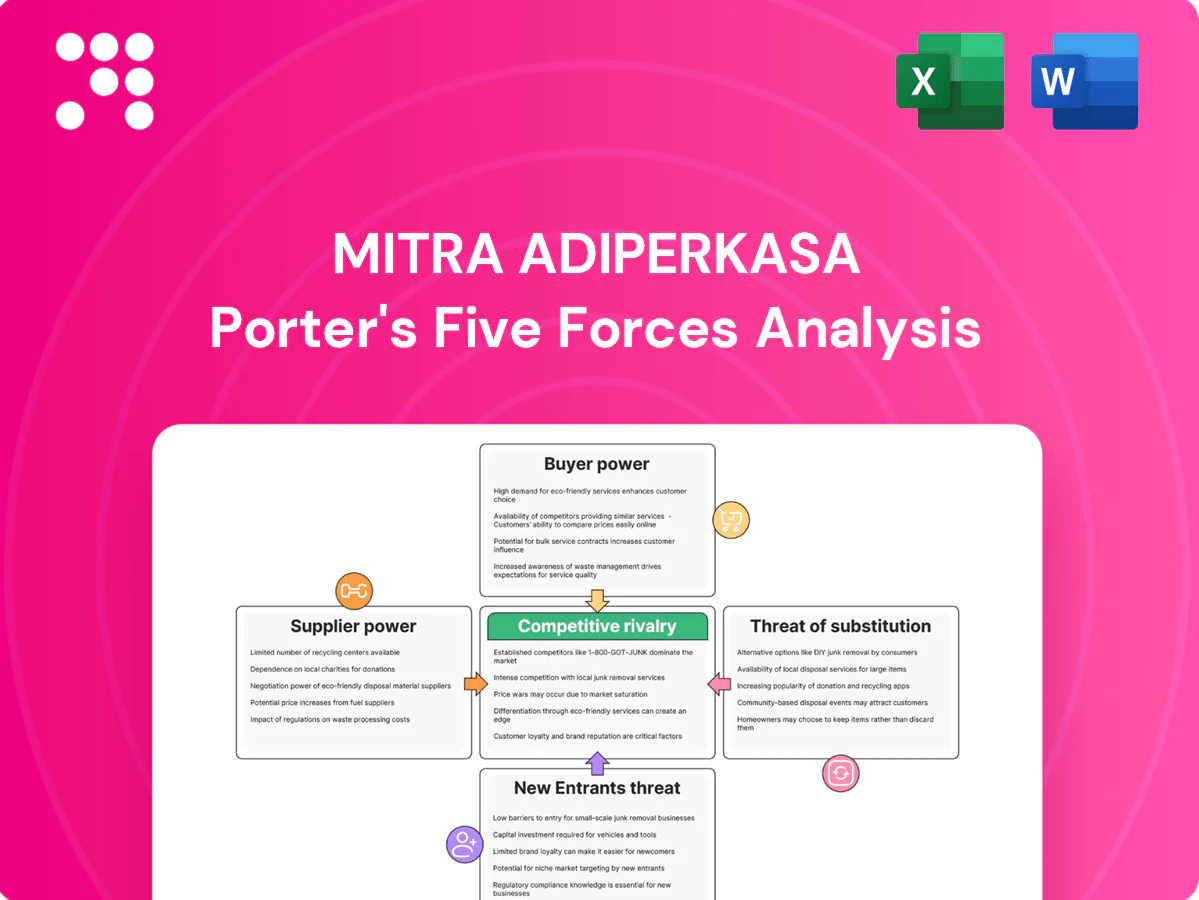
Mitra Adiperkasa Porter's Five Forces Analysis

A Must-Have Tool for Decision-Makers
Mitra Adiperkasa's Porter's Five Forces snapshot highlights strong supplier relationships, shifting buyer power in retail, moderate threats from substitutes, and high competitive rivalry across lifestyle and fashion segments; new entrants face brand and scale barriers. This brief only scratches the surface—unlock the full Porter's Five Forces Analysis for force-by-force ratings, visuals, and actionable strategy insights tailored to Mitra Adiperkasa.
Suppliers Bargaining Power

Exclusive brand principals
MAP depends on global brand owners and franchisors for marquee labels, giving principals leverage over pricing, assortments and brand standards that constrain retail margin management. Exclusive distribution and franchise agreements impose strict compliance and inventory commitments, limiting MAPs flexibility on stock and promotions. Principals control allocations and launch timing, and any contract renegotiation can materially swing margins and store productivity.
Portfolio diversification
MAP's multi-category, multi-brand portfolio reduces reliance on any single supplier, allowing cross-portfolio negotiations and volume aggregation to secure more favorable terms. Spreading purchases across sports, fashion, F&B and lifestyle mitigates supplier concentration risk and preserves margin flexibility. Growth of private labels and increased local sourcing further dilute supplier influence and enhance bargaining leverage.

Scale and bargaining power
MAP’s nationwide network of over 1,700 outlets (2024 MAPA disclosures) and large volumes give negotiating leverage on costs, marketing support and exclusivities; co-op marketing and joint campaigns often shift promotional spend back to principals. Operational POS sell‑through data and inventory visibility strengthen MAP’s case for favorable allocations, while long relationships with top brands sustain trust and continuity.

FX and import exposure
Imported merchandise ties MAP’s costs to FX and duties, indirectly raising supplier power; rupiah traded roughly 15,000–16,000 per USD in 2024, squeezing margins when principals invoice in hard currency and limiting pricing flexibility. Lead times and customs create rigidity in reordering and markdowns, while hedging and increased local sourcing partially mitigate these pressures.
- Hard‑currency invoicing reduces MAP price flexibility
- Customs/lead times hinder quick markdowns
- Hedging/local sourcing can lower FX-driven supplier power
Brand equity dependency
Global labels carry strong pull across MAP stores, making them hard to substitute at similar price points; supplier-controlled drops and limited editions force retailers to follow brand calendars, while global marketing campaigns shape local demand and merchandising—losing a top brand can materially reduce footfall and average basket value.
- Brand-driven sales concentration
- Calendar-driven inventory risk
- Marketing shapes assortment
- High traffic dependency
Retailer's scale boosts negotiation power, but global brands control margins
MAP faces strong supplier power from global brands that control pricing, allocations and launches, constraining margin levers; losing a top label can cut traffic and basket size. MAP’s 1,700+ stores (2024) and volume aggregation boost negotiation power, while hedging and local sourcing partly offset FX/duty exposure (Rupiah ~15,000–16,000 per USD in 2024). Operational data and long relationships sustain favorable terms.
| Metric | Value (2024) |
|---|---|
| Store count | 1,700+ |
| IDR/USD | 15,000–16,000 |
| Supplier influence | High for global brands |
| Mitigants | Private labels, local sourcing, hedging |
What is included in the product
 Detailed Word Document
Tailored Porter's Five Forces analysis for Mitra Adiperkasa that uncovers competitive drivers, buyer and supplier power, entry barriers, substitute threats, and strategic levers to protect market share and profitability.

 Customizable Excel Spreadsheet
A clear one-sheet Porter's Five Forces for Mitra Adiperkasa—instant strategic clarity with a spider chart and customizable pressure levels for evolving retail conditions; clean layout ready for decks and easy data swaps to reflect new brands, channels, or regulations.
Customers Bargaining Power

Low switching costs
Shoppers can easily switch to rival stores, e-commerce platforms, or brand-direct channels, intensifying bargaining power as over 200 million Indonesians were internet users in 2024. Instant price comparisons compress margins on commoditized items, while promotions and seasonal sales further heighten deal sensitivity. MAP must differentiate through curated assortments, superior in-store service, and compelling loyalty benefits to retain spend.
Omnichannel expectations
Indonesian shoppers expect unified inventory, seamless returns and fast delivery, and MAP’s omnichannel footprint of over 2,000 stores plus marketplaces raises service benchmarks; with roughly 215 million internet users in 2024, availability across mall outlets, apps and marketplaces is table-stakes. Stockouts or slow fulfillment push buyers to rivals, and MAP’s investment in last-mile logistics and click-and-collect lowers churn and boosts conversion.

Loyalty and data moats
MAP’s loyalty programs and CRM dampen buyer power by bundling rewards and personalized outreach, with personalization-driven tactics shown to lift repeat rates and average tickets by up to 15%. Targeted offers and segmented promotions increase repeat purchase frequency and basket size, while data-driven assortments raise perceived value through better fit and availability. Benefits must outpace aggressive marketplace vouchers and cashbacks, which commonly exceed 10% in Indonesia.

Price sensitivity segments
Indonesia’s expanding middle class coexists with strong value consciousness, driven by a population of about 276 million and 77% internet penetration in 2024, which intensifies online price comparison and promo hunting in entry and mid-price tiers.
Premium segments tolerate higher prices but insist on exclusivity and rapid novelty; Mitra Adiperkasa’s tiered assortments and brand mixes help capture varied willingness to pay and reduce churn.
- Middle-class + internet: 276M population, 77% online (2024)
- Entry/mid: high promo sensitivity, frequent price comparisons
- Premium: pays more for exclusivity and newness
- Tiered assortments: align SKU mix to willingness to pay
Social proof influence
Social proof—reviews, influencers and community trends—drives rapid demand shifts for Mitra Adiperkasa, tapping Indonesia’s 204 million internet users (2024) and routing traffic across platforms; viral items can re-route customer flows overnight. Negative feedback escalates returns and erodes omnichannel trust; proactive engagement and curated drops help stabilize perception and demand across MAP’s over 2,000 stores (2024).
- Reviews: real-time ratings shape conversion
- Influencers: fast reach, platform rerouting
- Curated drops: reduce churn and calm volatility
High customer bargaining power: ≈212M online users, >10% vouchers, loyalty lifts repeats ~15%
Customers wield strong bargaining power: 276 million population with 77% internet penetration (≈212M users in 2024) enables easy switching, price comparison and promo-chasing; MAP’s 2,000+ stores and omnichannel reach mitigate but do not eliminate churn. Loyalty and personalization can lift repeat rates ~15% while marketplace vouchers/cashbacks often exceed 10%, pressuring margins. Fast fulfillment, curated assortments and exclusive drops are key retention levers.
| Metric | 2024 Value |
|---|---|
| Population | 276M |
| Internet users | ≈212M (77% penetration) |
| MAP stores | 2,000+ |
| Loyalty lift | ≈15% repeat rate ↑ |
| Common voucher/cashback | >10% |
Same Document Delivered
Mitra Adiperkasa Porter's Five Forces Analysis
This preview is the exact Porter’s Five Forces analysis for Mitra Adiperkasa you'll receive after purchase—no placeholders, no samples. The file shown is fully formatted, professionally written and ready for immediate download and use the moment you complete payment. What you see here is the final deliverable, covering competitive rivalry, supplier and buyer power, threats of new entrants and substitutes with actionable insights.

A Must-Have Tool for Decision-Makers
Mitra Adiperkasa's Porter's Five Forces snapshot highlights strong supplier relationships, shifting buyer power in retail, moderate threats from substitutes, and high competitive rivalry across lifestyle and fashion segments; new entrants face brand and scale barriers. This brief only scratches the surface—unlock the full Porter's Five Forces Analysis for force-by-force ratings, visuals, and actionable strategy insights tailored to Mitra Adiperkasa.
Suppliers Bargaining Power
Exclusive brand principals
MAP depends on global brand owners and franchisors for marquee labels, giving principals leverage over pricing, assortments and brand standards that constrain retail margin management. Exclusive distribution and franchise agreements impose strict compliance and inventory commitments, limiting MAPs flexibility on stock and promotions. Principals control allocations and launch timing, and any contract renegotiation can materially swing margins and store productivity.
Portfolio diversification
MAP's multi-category, multi-brand portfolio reduces reliance on any single supplier, allowing cross-portfolio negotiations and volume aggregation to secure more favorable terms. Spreading purchases across sports, fashion, F&B and lifestyle mitigates supplier concentration risk and preserves margin flexibility. Growth of private labels and increased local sourcing further dilute supplier influence and enhance bargaining leverage.
Scale and bargaining power
MAP’s nationwide network of over 1,700 outlets (2024 MAPA disclosures) and large volumes give negotiating leverage on costs, marketing support and exclusivities; co-op marketing and joint campaigns often shift promotional spend back to principals. Operational POS sell‑through data and inventory visibility strengthen MAP’s case for favorable allocations, while long relationships with top brands sustain trust and continuity.
FX and import exposure
Imported merchandise ties MAP’s costs to FX and duties, indirectly raising supplier power; rupiah traded roughly 15,000–16,000 per USD in 2024, squeezing margins when principals invoice in hard currency and limiting pricing flexibility. Lead times and customs create rigidity in reordering and markdowns, while hedging and increased local sourcing partially mitigate these pressures.
- Hard‑currency invoicing reduces MAP price flexibility
- Customs/lead times hinder quick markdowns
- Hedging/local sourcing can lower FX-driven supplier power
Brand equity dependency
Global labels carry strong pull across MAP stores, making them hard to substitute at similar price points; supplier-controlled drops and limited editions force retailers to follow brand calendars, while global marketing campaigns shape local demand and merchandising—losing a top brand can materially reduce footfall and average basket value.
- Brand-driven sales concentration
- Calendar-driven inventory risk
- Marketing shapes assortment
- High traffic dependency
Retailer's scale boosts negotiation power, but global brands control margins
MAP faces strong supplier power from global brands that control pricing, allocations and launches, constraining margin levers; losing a top label can cut traffic and basket size. MAP’s 1,700+ stores (2024) and volume aggregation boost negotiation power, while hedging and local sourcing partly offset FX/duty exposure (Rupiah ~15,000–16,000 per USD in 2024). Operational data and long relationships sustain favorable terms.
| Metric | Value (2024) |
|---|---|
| Store count | 1,700+ |
| IDR/USD | 15,000–16,000 |
| Supplier influence | High for global brands |
| Mitigants | Private labels, local sourcing, hedging |
What is included in the product
Detailed Word Document
Tailored Porter's Five Forces analysis for Mitra Adiperkasa that uncovers competitive drivers, buyer and supplier power, entry barriers, substitute threats, and strategic levers to protect market share and profitability.
Customizable Excel Spreadsheet
A clear one-sheet Porter's Five Forces for Mitra Adiperkasa—instant strategic clarity with a spider chart and customizable pressure levels for evolving retail conditions; clean layout ready for decks and easy data swaps to reflect new brands, channels, or regulations.
Customers Bargaining Power
Low switching costs
Shoppers can easily switch to rival stores, e-commerce platforms, or brand-direct channels, intensifying bargaining power as over 200 million Indonesians were internet users in 2024. Instant price comparisons compress margins on commoditized items, while promotions and seasonal sales further heighten deal sensitivity. MAP must differentiate through curated assortments, superior in-store service, and compelling loyalty benefits to retain spend.
Omnichannel expectations
Indonesian shoppers expect unified inventory, seamless returns and fast delivery, and MAP’s omnichannel footprint of over 2,000 stores plus marketplaces raises service benchmarks; with roughly 215 million internet users in 2024, availability across mall outlets, apps and marketplaces is table-stakes. Stockouts or slow fulfillment push buyers to rivals, and MAP’s investment in last-mile logistics and click-and-collect lowers churn and boosts conversion.
Loyalty and data moats
MAP’s loyalty programs and CRM dampen buyer power by bundling rewards and personalized outreach, with personalization-driven tactics shown to lift repeat rates and average tickets by up to 15%. Targeted offers and segmented promotions increase repeat purchase frequency and basket size, while data-driven assortments raise perceived value through better fit and availability. Benefits must outpace aggressive marketplace vouchers and cashbacks, which commonly exceed 10% in Indonesia.
Price sensitivity segments
Indonesia’s expanding middle class coexists with strong value consciousness, driven by a population of about 276 million and 77% internet penetration in 2024, which intensifies online price comparison and promo hunting in entry and mid-price tiers.
Premium segments tolerate higher prices but insist on exclusivity and rapid novelty; Mitra Adiperkasa’s tiered assortments and brand mixes help capture varied willingness to pay and reduce churn.
- Middle-class + internet: 276M population, 77% online (2024)
- Entry/mid: high promo sensitivity, frequent price comparisons
- Premium: pays more for exclusivity and newness
- Tiered assortments: align SKU mix to willingness to pay
Social proof influence
Social proof—reviews, influencers and community trends—drives rapid demand shifts for Mitra Adiperkasa, tapping Indonesia’s 204 million internet users (2024) and routing traffic across platforms; viral items can re-route customer flows overnight. Negative feedback escalates returns and erodes omnichannel trust; proactive engagement and curated drops help stabilize perception and demand across MAP’s over 2,000 stores (2024).
- Reviews: real-time ratings shape conversion
- Influencers: fast reach, platform rerouting
- Curated drops: reduce churn and calm volatility
High customer bargaining power: ≈212M online users, >10% vouchers, loyalty lifts repeats ~15%
Customers wield strong bargaining power: 276 million population with 77% internet penetration (≈212M users in 2024) enables easy switching, price comparison and promo-chasing; MAP’s 2,000+ stores and omnichannel reach mitigate but do not eliminate churn. Loyalty and personalization can lift repeat rates ~15% while marketplace vouchers/cashbacks often exceed 10%, pressuring margins. Fast fulfillment, curated assortments and exclusive drops are key retention levers.
| Metric | 2024 Value |
|---|---|
| Population | 276M |
| Internet users | ≈212M (77% penetration) |
| MAP stores | 2,000+ |
| Loyalty lift | ≈15% repeat rate ↑ |
| Common voucher/cashback | >10% |
Same Document Delivered
Mitra Adiperkasa Porter's Five Forces Analysis
This preview is the exact Porter’s Five Forces analysis for Mitra Adiperkasa you'll receive after purchase—no placeholders, no samples. The file shown is fully formatted, professionally written and ready for immediate download and use the moment you complete payment. What you see here is the final deliverable, covering competitive rivalry, supplier and buyer power, threats of new entrants and substitutes with actionable insights.
Description
A Must-Have Tool for Decision-Makers
Mitra Adiperkasa's Porter's Five Forces snapshot highlights strong supplier relationships, shifting buyer power in retail, moderate threats from substitutes, and high competitive rivalry across lifestyle and fashion segments; new entrants face brand and scale barriers. This brief only scratches the surface—unlock the full Porter's Five Forces Analysis for force-by-force ratings, visuals, and actionable strategy insights tailored to Mitra Adiperkasa.
Suppliers Bargaining Power
Exclusive brand principals
MAP depends on global brand owners and franchisors for marquee labels, giving principals leverage over pricing, assortments and brand standards that constrain retail margin management. Exclusive distribution and franchise agreements impose strict compliance and inventory commitments, limiting MAPs flexibility on stock and promotions. Principals control allocations and launch timing, and any contract renegotiation can materially swing margins and store productivity.
Portfolio diversification
MAP's multi-category, multi-brand portfolio reduces reliance on any single supplier, allowing cross-portfolio negotiations and volume aggregation to secure more favorable terms. Spreading purchases across sports, fashion, F&B and lifestyle mitigates supplier concentration risk and preserves margin flexibility. Growth of private labels and increased local sourcing further dilute supplier influence and enhance bargaining leverage.
Scale and bargaining power
MAP’s nationwide network of over 1,700 outlets (2024 MAPA disclosures) and large volumes give negotiating leverage on costs, marketing support and exclusivities; co-op marketing and joint campaigns often shift promotional spend back to principals. Operational POS sell‑through data and inventory visibility strengthen MAP’s case for favorable allocations, while long relationships with top brands sustain trust and continuity.
FX and import exposure
Imported merchandise ties MAP’s costs to FX and duties, indirectly raising supplier power; rupiah traded roughly 15,000–16,000 per USD in 2024, squeezing margins when principals invoice in hard currency and limiting pricing flexibility. Lead times and customs create rigidity in reordering and markdowns, while hedging and increased local sourcing partially mitigate these pressures.
- Hard‑currency invoicing reduces MAP price flexibility
- Customs/lead times hinder quick markdowns
- Hedging/local sourcing can lower FX-driven supplier power
Brand equity dependency
Global labels carry strong pull across MAP stores, making them hard to substitute at similar price points; supplier-controlled drops and limited editions force retailers to follow brand calendars, while global marketing campaigns shape local demand and merchandising—losing a top brand can materially reduce footfall and average basket value.
- Brand-driven sales concentration
- Calendar-driven inventory risk
- Marketing shapes assortment
- High traffic dependency
Retailer's scale boosts negotiation power, but global brands control margins
MAP faces strong supplier power from global brands that control pricing, allocations and launches, constraining margin levers; losing a top label can cut traffic and basket size. MAP’s 1,700+ stores (2024) and volume aggregation boost negotiation power, while hedging and local sourcing partly offset FX/duty exposure (Rupiah ~15,000–16,000 per USD in 2024). Operational data and long relationships sustain favorable terms.
| Metric | Value (2024) |
|---|---|
| Store count | 1,700+ |
| IDR/USD | 15,000–16,000 |
| Supplier influence | High for global brands |
| Mitigants | Private labels, local sourcing, hedging |
What is included in the product
Detailed Word Document
Tailored Porter's Five Forces analysis for Mitra Adiperkasa that uncovers competitive drivers, buyer and supplier power, entry barriers, substitute threats, and strategic levers to protect market share and profitability.
Customizable Excel Spreadsheet
A clear one-sheet Porter's Five Forces for Mitra Adiperkasa—instant strategic clarity with a spider chart and customizable pressure levels for evolving retail conditions; clean layout ready for decks and easy data swaps to reflect new brands, channels, or regulations.
Customers Bargaining Power
Low switching costs
Shoppers can easily switch to rival stores, e-commerce platforms, or brand-direct channels, intensifying bargaining power as over 200 million Indonesians were internet users in 2024. Instant price comparisons compress margins on commoditized items, while promotions and seasonal sales further heighten deal sensitivity. MAP must differentiate through curated assortments, superior in-store service, and compelling loyalty benefits to retain spend.
Omnichannel expectations
Indonesian shoppers expect unified inventory, seamless returns and fast delivery, and MAP’s omnichannel footprint of over 2,000 stores plus marketplaces raises service benchmarks; with roughly 215 million internet users in 2024, availability across mall outlets, apps and marketplaces is table-stakes. Stockouts or slow fulfillment push buyers to rivals, and MAP’s investment in last-mile logistics and click-and-collect lowers churn and boosts conversion.
Loyalty and data moats
MAP’s loyalty programs and CRM dampen buyer power by bundling rewards and personalized outreach, with personalization-driven tactics shown to lift repeat rates and average tickets by up to 15%. Targeted offers and segmented promotions increase repeat purchase frequency and basket size, while data-driven assortments raise perceived value through better fit and availability. Benefits must outpace aggressive marketplace vouchers and cashbacks, which commonly exceed 10% in Indonesia.
Price sensitivity segments
Indonesia’s expanding middle class coexists with strong value consciousness, driven by a population of about 276 million and 77% internet penetration in 2024, which intensifies online price comparison and promo hunting in entry and mid-price tiers.
Premium segments tolerate higher prices but insist on exclusivity and rapid novelty; Mitra Adiperkasa’s tiered assortments and brand mixes help capture varied willingness to pay and reduce churn.
- Middle-class + internet: 276M population, 77% online (2024)
- Entry/mid: high promo sensitivity, frequent price comparisons
- Premium: pays more for exclusivity and newness
- Tiered assortments: align SKU mix to willingness to pay
Social proof influence
Social proof—reviews, influencers and community trends—drives rapid demand shifts for Mitra Adiperkasa, tapping Indonesia’s 204 million internet users (2024) and routing traffic across platforms; viral items can re-route customer flows overnight. Negative feedback escalates returns and erodes omnichannel trust; proactive engagement and curated drops help stabilize perception and demand across MAP’s over 2,000 stores (2024).
- Reviews: real-time ratings shape conversion
- Influencers: fast reach, platform rerouting
- Curated drops: reduce churn and calm volatility
High customer bargaining power: ≈212M online users, >10% vouchers, loyalty lifts repeats ~15%
Customers wield strong bargaining power: 276 million population with 77% internet penetration (≈212M users in 2024) enables easy switching, price comparison and promo-chasing; MAP’s 2,000+ stores and omnichannel reach mitigate but do not eliminate churn. Loyalty and personalization can lift repeat rates ~15% while marketplace vouchers/cashbacks often exceed 10%, pressuring margins. Fast fulfillment, curated assortments and exclusive drops are key retention levers.
| Metric | 2024 Value |
|---|---|
| Population | 276M |
| Internet users | ≈212M (77% penetration) |
| MAP stores | 2,000+ |
| Loyalty lift | ≈15% repeat rate ↑ |
| Common voucher/cashback | >10% |
Same Document Delivered
Mitra Adiperkasa Porter's Five Forces Analysis
This preview is the exact Porter’s Five Forces analysis for Mitra Adiperkasa you'll receive after purchase—no placeholders, no samples. The file shown is fully formatted, professionally written and ready for immediate download and use the moment you complete payment. What you see here is the final deliverable, covering competitive rivalry, supplier and buyer power, threats of new entrants and substitutes with actionable insights.











