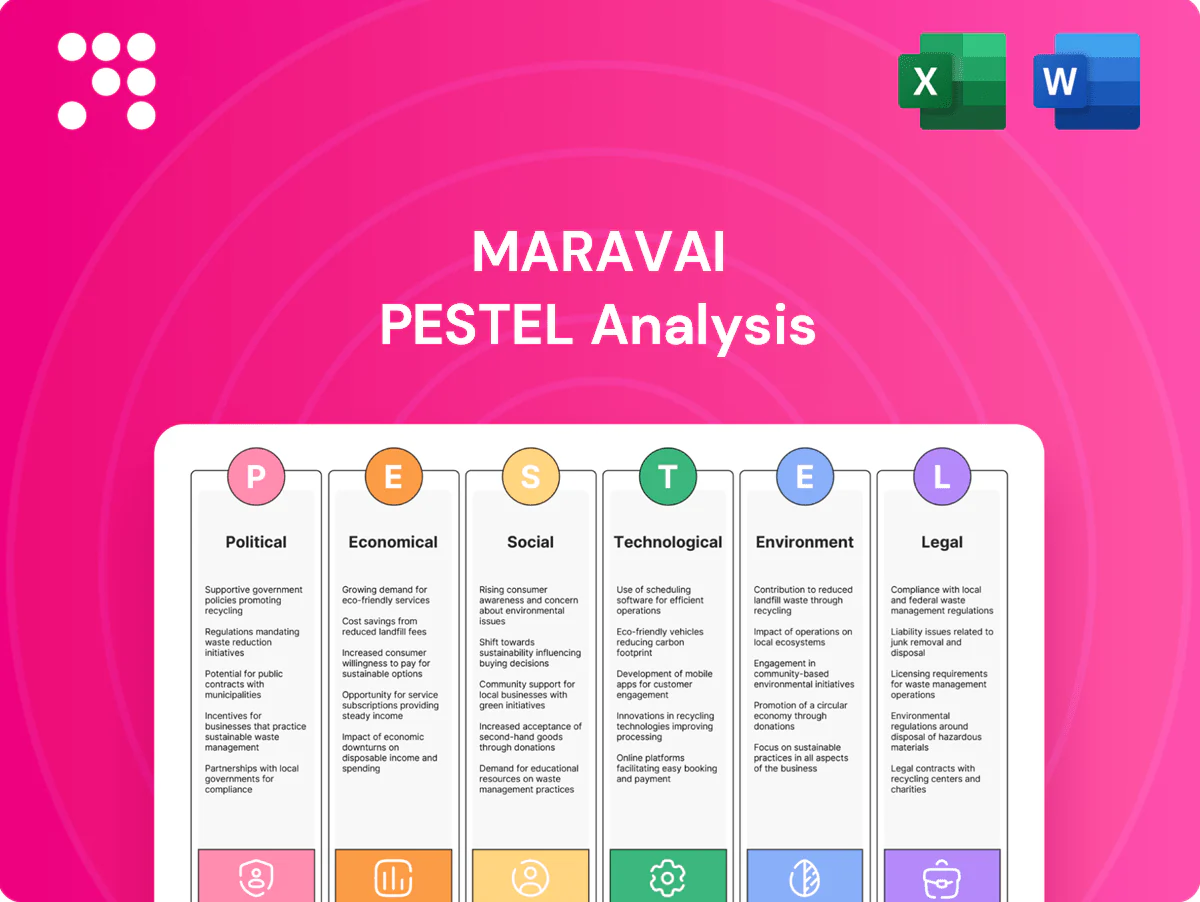
Maravai PESTLE Analysis

Plan Smarter. Present Sharper. Compete Stronger.
Unlock strategic clarity with our Maravai PESTLE analysis — concise, evidence-based insights into political, economic, social, technological, legal, and environmental forces shaping the company’s outlook. Ideal for investors and strategists, it’s ready to use and fully editable. Purchase the full report for the complete, actionable breakdown.
Political factors

Regulatory healthcare policy shifts
Shifts in national healthcare priorities and funding can quickly raise or reduce demand for nucleic acid inputs and biologics safety testing; NIH annual funding (~49 billion USD in FY2024) and BARDA program budgets (~1–2 billion USD annually) directly influence procurement cycles. Pandemic preparedness initiatives since 2020 have expanded strategic stockpiles and contracts, while austerity phases can compress orders and pricing. Maravai must monitor NIH, BARDA, EMA agendas and engage proactively to smooth revenue volatility.
Trade and export controls
Restrictions on exporting nucleic acids, enzymes and certain reagents have increased since 2023 as regulators in the US and EU expanded dual-use scrutiny, disrupting cross-border sales and licensing timelines. Geopolitical tensions in 2024 tightened classifications and licensing requirements for shipments to high-risk jurisdictions, raising compliance costs and export lead times. Diversifying manufacturing footprint and compliant logistics across multiple corridors, with clear customer documentation and established licensing workflows, preserves delivery timelines and reduces single-corridor dependency.

Government incentives for biotech
Tax credits (US R&D credit claims ~$20B/year) and grants such as NIH funding ($47.5B FY2024) plus state cluster investments (Massachusetts Life Sciences Center >$1B committed historically) can materially lower capex for Maravai production scale-up. Locating sites in supportive jurisdictions speeds permitting and improves talent access. Incentive variability requires quantitative site-selection modeling. Aligning with national biotech strategies unlocks partnerships and pilot programs.

Public procurement dynamics
Government tenders for vaccines and diagnostics create large, lumpy orders that drive volatile quarterly sales; public procurement is estimated by the World Bank to account for about 12% of global GDP. Strict qualification requirements and pricing transparency compress supplier margins, so maintaining approved vendor status and audit readiness is critical. Long-term framework agreements provide volume visibility, stabilizing utilization and cash flow.
- Large tenders: drive lumpiness and seasonality
- Qualification/audits: mandatory for market access
- Pricing transparency: margin pressure
- Frameworks: stabilize volumes and receivables
Political stability and supply security
Civil unrest or sanctions can disrupt sourcing and deliveries of critical inputs such as nucleotides, lipids and enzymes, undermining predictable customs clearance and time-sensitive manufacture for regulated customers; Maravai and peers therefore emphasize continuity planning. Building buffer inventories of 3–6 months and multisourcing suppliers reduces exposure, while scenario planning enables uninterrupted service to CDMOs and clinical partners.
- Supply risk: customs delays threaten time-critical reagents
- Key inputs: nucleotides, lipids, enzymes require predictable clearance
- Mitigation: 3–6 months buffer inventory; multisourcing
- Operational resilience: scenario planning for regulated customers
NIH 49B shifts lengthen lead times — keep 3–6m stock
Shifts in NIH funding (~49B USD FY2024) and BARDA budgets (~1–2B USD) drive procurement cycles and demand for nucleic acid inputs. Export control tightening since 2023 raises compliance costs and lead times. Public procurement (~12% of global GDP) creates lumpy large tenders that compress margins. Maintain 3–6 month buffer inventory and multisourcing to reduce disruption.
| Factor | Impact | Key data |
|---|---|---|
| Public funding | Demand volatility | NIH 49B; BARDA 1–2B |
| Export controls | Longer lead times | Expanded since 2023 |
| Procurement | Lumpy orders, margin pressure | Public procurement ~12% GDP |
| Continuity | Resilience | Inventory 3–6 months |
What is included in the product
 Detailed Word Document
Explores how Political, Economic, Social, Technological, Environmental, and Legal factors uniquely affect Maravai, with data-backed trends, detailed sub-points, and forward-looking insights to support executives, consultants, and investors in risk identification, scenario planning, and strategy formation—delivered in clean, report-ready format.

 Customizable Excel Spreadsheet
A concise, visually segmented PESTLE summary of Maravai that’s easily dropped into presentations, editable for regional or business-specific notes, and shareable for quick cross-team alignment—ideal for risk discussions and client reports.
Economic factors

Biopharma R&D spending cycles
Biopharma R&D spending cycles drive demand for research-grade and GMP nucleic acids; US NIH appropriations reached about $49.5 billion for FY2024, supporting non-dilutive research demand. Venture funding slowed in 2024, delaying some pipeline programs and reducing reagent consumption in early-stage labs. Maravai’s balanced mix of research and clinical customers helps smooth revenue variability. Improved visibility into client pipelines strengthens forecasting accuracy.
Pricing power and input inflation
Specialty reagents retain pricing power but face margin pressure as procurement consolidation among biopharma buyers increases negotiating leverage. Enzyme, solvent and energy input costs rose roughly 4–6% YoY in 2023–24, squeezing unit economics unless passed through. Cost pass-through varies with contract terms and product differentiation—premium, hard-to-replace reagents command higher pass-through. Lean operations and yield improvements have protected gross margins at many peers by several hundred basis points.

FX and global revenue mix
Multi-currency sales expose Maravai to dollar strength; the US dollar (DXY ~104 in July 2025) can compress reported international revenues. Hedging programs can stabilize EPS but add cost and accounting complexity and were noted by peers to reduce FX volatility by ~60% in practice. Local invoicing and matching costs in local currencies create natural hedges, and monitoring regional demand supports balanced capacity allocation.

Scale economies in GMP production
Scale economies in GMP production lower nucleic acid unit costs as batch sizes grow and utilization rises; industry data show per-unit costs can fall by ~20–35% when utilization moves from 50% to 80%. Fixed-cost absorption improves as Maravai’s install base across mRNA, gene therapy and vaccine programs expands, reducing overhead per project. Qualification overheads and time-to-first-batch favor established suppliers, raising barriers for new entrants. Aligning capacity plans with customer clinical and commercial milestones maximizes ROI by minimizing idle-capacity drag.
- scale_savings: 20–35% per-unit cost reduction at 50→80% utilization
- fixed_absorption: larger install base lowers overhead per program
- qualification_barrier: incumbents benefit from established GMP traceability
- capacity_alignment: milestone-tied capacity boosts ROI, cuts idle costs
M&A and competitor consolidation
Industry roll-ups (eg Danaher purchase of GE’s bioprocessing unit for $21.4B in 2020 and Thermo Fisher’s acquisition of PPD for $17.4B in 2021) can shift pricing power, portfolios, and negotiating leverage; acquisitions may enable cross-selling into safety testing and oligo chemistries but integration risk and culture fit limit value capture.
- Pricing pressure
- Cross-sell potential
- Integration risk
- CI-driven roadmap
NIH 49B shifts lengthen lead times — keep 3–6m stock
Biopharma R&D funding (NIH ~$49.5B FY2024) and slowed VC in 2024 temper reagent demand; Maravai's mixed research/clinical base smooths revenue. Input costs up ~4–6% YoY 2023–24; scale reduces unit costs 20–35% from 50→80% utilization. USD strength (DXY ~104 Jul 2025) risks reported sales; hedging cuts FX volatility ~60%.
| Metric | Value |
|---|---|
| NIH FY2024 | $49.5B |
| Input cost change | +4–6% YoY |
| Scale saving | 20–35% |
| DXY Jul2025 | ~104 |
Same Document Delivered
Maravai PESTLE Analysis
The preview shown here is the exact Maravai PESTLE Analysis document you’ll receive after purchase—fully formatted and ready to use. The layout, content, and structure visible are identical to the file you’ll download immediately after payment. No placeholders or teasers—this is the final, professionally structured report.

Plan Smarter. Present Sharper. Compete Stronger.
Unlock strategic clarity with our Maravai PESTLE analysis — concise, evidence-based insights into political, economic, social, technological, legal, and environmental forces shaping the company’s outlook. Ideal for investors and strategists, it’s ready to use and fully editable. Purchase the full report for the complete, actionable breakdown.
Political factors
Regulatory healthcare policy shifts
Shifts in national healthcare priorities and funding can quickly raise or reduce demand for nucleic acid inputs and biologics safety testing; NIH annual funding (~49 billion USD in FY2024) and BARDA program budgets (~1–2 billion USD annually) directly influence procurement cycles. Pandemic preparedness initiatives since 2020 have expanded strategic stockpiles and contracts, while austerity phases can compress orders and pricing. Maravai must monitor NIH, BARDA, EMA agendas and engage proactively to smooth revenue volatility.
Trade and export controls
Restrictions on exporting nucleic acids, enzymes and certain reagents have increased since 2023 as regulators in the US and EU expanded dual-use scrutiny, disrupting cross-border sales and licensing timelines. Geopolitical tensions in 2024 tightened classifications and licensing requirements for shipments to high-risk jurisdictions, raising compliance costs and export lead times. Diversifying manufacturing footprint and compliant logistics across multiple corridors, with clear customer documentation and established licensing workflows, preserves delivery timelines and reduces single-corridor dependency.
Government incentives for biotech
Tax credits (US R&D credit claims ~$20B/year) and grants such as NIH funding ($47.5B FY2024) plus state cluster investments (Massachusetts Life Sciences Center >$1B committed historically) can materially lower capex for Maravai production scale-up. Locating sites in supportive jurisdictions speeds permitting and improves talent access. Incentive variability requires quantitative site-selection modeling. Aligning with national biotech strategies unlocks partnerships and pilot programs.
Public procurement dynamics
Government tenders for vaccines and diagnostics create large, lumpy orders that drive volatile quarterly sales; public procurement is estimated by the World Bank to account for about 12% of global GDP. Strict qualification requirements and pricing transparency compress supplier margins, so maintaining approved vendor status and audit readiness is critical. Long-term framework agreements provide volume visibility, stabilizing utilization and cash flow.
- Large tenders: drive lumpiness and seasonality
- Qualification/audits: mandatory for market access
- Pricing transparency: margin pressure
- Frameworks: stabilize volumes and receivables
Political stability and supply security
Civil unrest or sanctions can disrupt sourcing and deliveries of critical inputs such as nucleotides, lipids and enzymes, undermining predictable customs clearance and time-sensitive manufacture for regulated customers; Maravai and peers therefore emphasize continuity planning. Building buffer inventories of 3–6 months and multisourcing suppliers reduces exposure, while scenario planning enables uninterrupted service to CDMOs and clinical partners.
- Supply risk: customs delays threaten time-critical reagents
- Key inputs: nucleotides, lipids, enzymes require predictable clearance
- Mitigation: 3–6 months buffer inventory; multisourcing
- Operational resilience: scenario planning for regulated customers
NIH 49B shifts lengthen lead times — keep 3–6m stock
Shifts in NIH funding (~49B USD FY2024) and BARDA budgets (~1–2B USD) drive procurement cycles and demand for nucleic acid inputs. Export control tightening since 2023 raises compliance costs and lead times. Public procurement (~12% of global GDP) creates lumpy large tenders that compress margins. Maintain 3–6 month buffer inventory and multisourcing to reduce disruption.
| Factor | Impact | Key data |
|---|---|---|
| Public funding | Demand volatility | NIH 49B; BARDA 1–2B |
| Export controls | Longer lead times | Expanded since 2023 |
| Procurement | Lumpy orders, margin pressure | Public procurement ~12% GDP |
| Continuity | Resilience | Inventory 3–6 months |
What is included in the product
Detailed Word Document
Explores how Political, Economic, Social, Technological, Environmental, and Legal factors uniquely affect Maravai, with data-backed trends, detailed sub-points, and forward-looking insights to support executives, consultants, and investors in risk identification, scenario planning, and strategy formation—delivered in clean, report-ready format.
Customizable Excel Spreadsheet
A concise, visually segmented PESTLE summary of Maravai that’s easily dropped into presentations, editable for regional or business-specific notes, and shareable for quick cross-team alignment—ideal for risk discussions and client reports.
Economic factors
Biopharma R&D spending cycles
Biopharma R&D spending cycles drive demand for research-grade and GMP nucleic acids; US NIH appropriations reached about $49.5 billion for FY2024, supporting non-dilutive research demand. Venture funding slowed in 2024, delaying some pipeline programs and reducing reagent consumption in early-stage labs. Maravai’s balanced mix of research and clinical customers helps smooth revenue variability. Improved visibility into client pipelines strengthens forecasting accuracy.
Pricing power and input inflation
Specialty reagents retain pricing power but face margin pressure as procurement consolidation among biopharma buyers increases negotiating leverage. Enzyme, solvent and energy input costs rose roughly 4–6% YoY in 2023–24, squeezing unit economics unless passed through. Cost pass-through varies with contract terms and product differentiation—premium, hard-to-replace reagents command higher pass-through. Lean operations and yield improvements have protected gross margins at many peers by several hundred basis points.
FX and global revenue mix
Multi-currency sales expose Maravai to dollar strength; the US dollar (DXY ~104 in July 2025) can compress reported international revenues. Hedging programs can stabilize EPS but add cost and accounting complexity and were noted by peers to reduce FX volatility by ~60% in practice. Local invoicing and matching costs in local currencies create natural hedges, and monitoring regional demand supports balanced capacity allocation.
Scale economies in GMP production
Scale economies in GMP production lower nucleic acid unit costs as batch sizes grow and utilization rises; industry data show per-unit costs can fall by ~20–35% when utilization moves from 50% to 80%. Fixed-cost absorption improves as Maravai’s install base across mRNA, gene therapy and vaccine programs expands, reducing overhead per project. Qualification overheads and time-to-first-batch favor established suppliers, raising barriers for new entrants. Aligning capacity plans with customer clinical and commercial milestones maximizes ROI by minimizing idle-capacity drag.
- scale_savings: 20–35% per-unit cost reduction at 50→80% utilization
- fixed_absorption: larger install base lowers overhead per program
- qualification_barrier: incumbents benefit from established GMP traceability
- capacity_alignment: milestone-tied capacity boosts ROI, cuts idle costs
M&A and competitor consolidation
Industry roll-ups (eg Danaher purchase of GE’s bioprocessing unit for $21.4B in 2020 and Thermo Fisher’s acquisition of PPD for $17.4B in 2021) can shift pricing power, portfolios, and negotiating leverage; acquisitions may enable cross-selling into safety testing and oligo chemistries but integration risk and culture fit limit value capture.
- Pricing pressure
- Cross-sell potential
- Integration risk
- CI-driven roadmap
NIH 49B shifts lengthen lead times — keep 3–6m stock
Biopharma R&D funding (NIH ~$49.5B FY2024) and slowed VC in 2024 temper reagent demand; Maravai's mixed research/clinical base smooths revenue. Input costs up ~4–6% YoY 2023–24; scale reduces unit costs 20–35% from 50→80% utilization. USD strength (DXY ~104 Jul 2025) risks reported sales; hedging cuts FX volatility ~60%.
| Metric | Value |
|---|---|
| NIH FY2024 | $49.5B |
| Input cost change | +4–6% YoY |
| Scale saving | 20–35% |
| DXY Jul2025 | ~104 |
Same Document Delivered
Maravai PESTLE Analysis
The preview shown here is the exact Maravai PESTLE Analysis document you’ll receive after purchase—fully formatted and ready to use. The layout, content, and structure visible are identical to the file you’ll download immediately after payment. No placeholders or teasers—this is the final, professionally structured report.
Description
Plan Smarter. Present Sharper. Compete Stronger.
Unlock strategic clarity with our Maravai PESTLE analysis — concise, evidence-based insights into political, economic, social, technological, legal, and environmental forces shaping the company’s outlook. Ideal for investors and strategists, it’s ready to use and fully editable. Purchase the full report for the complete, actionable breakdown.
Political factors
Regulatory healthcare policy shifts
Shifts in national healthcare priorities and funding can quickly raise or reduce demand for nucleic acid inputs and biologics safety testing; NIH annual funding (~49 billion USD in FY2024) and BARDA program budgets (~1–2 billion USD annually) directly influence procurement cycles. Pandemic preparedness initiatives since 2020 have expanded strategic stockpiles and contracts, while austerity phases can compress orders and pricing. Maravai must monitor NIH, BARDA, EMA agendas and engage proactively to smooth revenue volatility.
Trade and export controls
Restrictions on exporting nucleic acids, enzymes and certain reagents have increased since 2023 as regulators in the US and EU expanded dual-use scrutiny, disrupting cross-border sales and licensing timelines. Geopolitical tensions in 2024 tightened classifications and licensing requirements for shipments to high-risk jurisdictions, raising compliance costs and export lead times. Diversifying manufacturing footprint and compliant logistics across multiple corridors, with clear customer documentation and established licensing workflows, preserves delivery timelines and reduces single-corridor dependency.
Government incentives for biotech
Tax credits (US R&D credit claims ~$20B/year) and grants such as NIH funding ($47.5B FY2024) plus state cluster investments (Massachusetts Life Sciences Center >$1B committed historically) can materially lower capex for Maravai production scale-up. Locating sites in supportive jurisdictions speeds permitting and improves talent access. Incentive variability requires quantitative site-selection modeling. Aligning with national biotech strategies unlocks partnerships and pilot programs.
Public procurement dynamics
Government tenders for vaccines and diagnostics create large, lumpy orders that drive volatile quarterly sales; public procurement is estimated by the World Bank to account for about 12% of global GDP. Strict qualification requirements and pricing transparency compress supplier margins, so maintaining approved vendor status and audit readiness is critical. Long-term framework agreements provide volume visibility, stabilizing utilization and cash flow.
- Large tenders: drive lumpiness and seasonality
- Qualification/audits: mandatory for market access
- Pricing transparency: margin pressure
- Frameworks: stabilize volumes and receivables
Political stability and supply security
Civil unrest or sanctions can disrupt sourcing and deliveries of critical inputs such as nucleotides, lipids and enzymes, undermining predictable customs clearance and time-sensitive manufacture for regulated customers; Maravai and peers therefore emphasize continuity planning. Building buffer inventories of 3–6 months and multisourcing suppliers reduces exposure, while scenario planning enables uninterrupted service to CDMOs and clinical partners.
- Supply risk: customs delays threaten time-critical reagents
- Key inputs: nucleotides, lipids, enzymes require predictable clearance
- Mitigation: 3–6 months buffer inventory; multisourcing
- Operational resilience: scenario planning for regulated customers
NIH 49B shifts lengthen lead times — keep 3–6m stock
Shifts in NIH funding (~49B USD FY2024) and BARDA budgets (~1–2B USD) drive procurement cycles and demand for nucleic acid inputs. Export control tightening since 2023 raises compliance costs and lead times. Public procurement (~12% of global GDP) creates lumpy large tenders that compress margins. Maintain 3–6 month buffer inventory and multisourcing to reduce disruption.
| Factor | Impact | Key data |
|---|---|---|
| Public funding | Demand volatility | NIH 49B; BARDA 1–2B |
| Export controls | Longer lead times | Expanded since 2023 |
| Procurement | Lumpy orders, margin pressure | Public procurement ~12% GDP |
| Continuity | Resilience | Inventory 3–6 months |
What is included in the product
Detailed Word Document
Explores how Political, Economic, Social, Technological, Environmental, and Legal factors uniquely affect Maravai, with data-backed trends, detailed sub-points, and forward-looking insights to support executives, consultants, and investors in risk identification, scenario planning, and strategy formation—delivered in clean, report-ready format.
Customizable Excel Spreadsheet
A concise, visually segmented PESTLE summary of Maravai that’s easily dropped into presentations, editable for regional or business-specific notes, and shareable for quick cross-team alignment—ideal for risk discussions and client reports.
Economic factors
Biopharma R&D spending cycles
Biopharma R&D spending cycles drive demand for research-grade and GMP nucleic acids; US NIH appropriations reached about $49.5 billion for FY2024, supporting non-dilutive research demand. Venture funding slowed in 2024, delaying some pipeline programs and reducing reagent consumption in early-stage labs. Maravai’s balanced mix of research and clinical customers helps smooth revenue variability. Improved visibility into client pipelines strengthens forecasting accuracy.
Pricing power and input inflation
Specialty reagents retain pricing power but face margin pressure as procurement consolidation among biopharma buyers increases negotiating leverage. Enzyme, solvent and energy input costs rose roughly 4–6% YoY in 2023–24, squeezing unit economics unless passed through. Cost pass-through varies with contract terms and product differentiation—premium, hard-to-replace reagents command higher pass-through. Lean operations and yield improvements have protected gross margins at many peers by several hundred basis points.
FX and global revenue mix
Multi-currency sales expose Maravai to dollar strength; the US dollar (DXY ~104 in July 2025) can compress reported international revenues. Hedging programs can stabilize EPS but add cost and accounting complexity and were noted by peers to reduce FX volatility by ~60% in practice. Local invoicing and matching costs in local currencies create natural hedges, and monitoring regional demand supports balanced capacity allocation.
Scale economies in GMP production
Scale economies in GMP production lower nucleic acid unit costs as batch sizes grow and utilization rises; industry data show per-unit costs can fall by ~20–35% when utilization moves from 50% to 80%. Fixed-cost absorption improves as Maravai’s install base across mRNA, gene therapy and vaccine programs expands, reducing overhead per project. Qualification overheads and time-to-first-batch favor established suppliers, raising barriers for new entrants. Aligning capacity plans with customer clinical and commercial milestones maximizes ROI by minimizing idle-capacity drag.
- scale_savings: 20–35% per-unit cost reduction at 50→80% utilization
- fixed_absorption: larger install base lowers overhead per program
- qualification_barrier: incumbents benefit from established GMP traceability
- capacity_alignment: milestone-tied capacity boosts ROI, cuts idle costs
M&A and competitor consolidation
Industry roll-ups (eg Danaher purchase of GE’s bioprocessing unit for $21.4B in 2020 and Thermo Fisher’s acquisition of PPD for $17.4B in 2021) can shift pricing power, portfolios, and negotiating leverage; acquisitions may enable cross-selling into safety testing and oligo chemistries but integration risk and culture fit limit value capture.
- Pricing pressure
- Cross-sell potential
- Integration risk
- CI-driven roadmap
NIH 49B shifts lengthen lead times — keep 3–6m stock
Biopharma R&D funding (NIH ~$49.5B FY2024) and slowed VC in 2024 temper reagent demand; Maravai's mixed research/clinical base smooths revenue. Input costs up ~4–6% YoY 2023–24; scale reduces unit costs 20–35% from 50→80% utilization. USD strength (DXY ~104 Jul 2025) risks reported sales; hedging cuts FX volatility ~60%.
| Metric | Value |
|---|---|
| NIH FY2024 | $49.5B |
| Input cost change | +4–6% YoY |
| Scale saving | 20–35% |
| DXY Jul2025 | ~104 |
Same Document Delivered
Maravai PESTLE Analysis
The preview shown here is the exact Maravai PESTLE Analysis document you’ll receive after purchase—fully formatted and ready to use. The layout, content, and structure visible are identical to the file you’ll download immediately after payment. No placeholders or teasers—this is the final, professionally structured report.











