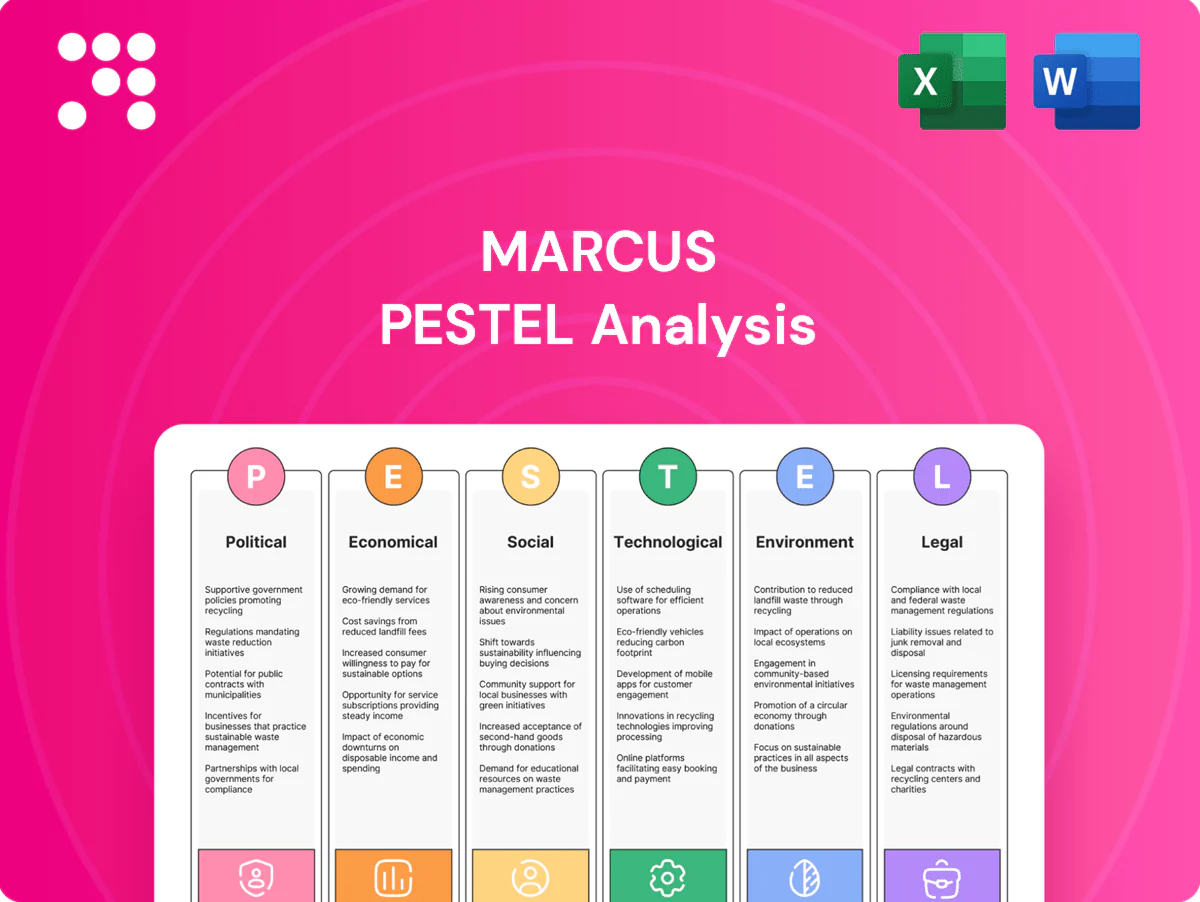
Marcus PESTLE Analysis

Your Competitive Advantage Starts with This Report
Discover how political, economic, social, technological, legal, and environmental forces are reshaping Marcus’s prospects in our concise PESTLE briefing—insights tailored for investors and strategists. This analysis highlights risks and opportunities you can act on today. Purchase the full PESTLE to access the complete, editable report and make data-driven decisions with confidence.
Political factors

Local zoning, permits, and development incentives
Hotel and cinema projects hinge on municipal approvals, zoning variances and tools like tax increment financing, with U.S. construction put in place at roughly $1.8 trillion in 2023 (U.S. Census). Pro-business cities that streamline permits accelerate new builds and refurbishments. Opposition or policy shifts can delay timelines and raise costs. Active stakeholder engagement helps secure incentives and community support.
Tourism promotion and destination marketing funding
State and city budgets for convention bureaus and tourism boards directly influence hotel demand; in 2024 U.S. hotel occupancy averaged about 66% with ADR near $154, showing sensitivity to destination marketing spend. Increased funding for events and campaigns can lift group and leisure inflows and RevPAR, while cuts compress group bookings and push RevPAR down. Marcus stands to gain when its portfolio aligns with local marketing strategies.

Public health policy and emergency mandates
Changes to health guidelines can force theater occupancy limits and hotel operational changes; the US COVID public health emergency ended May 11, 2023, but past shifts cut US box office ~80% in Q2 2020 and hotel RevPAR fell ~87% in April 2020, showing revenue sensitivity. Preparedness for rapid policy shifts preserves continuity, and clear compliance builds guest trust while reducing reputational risk.

Urban safety, transportation, and infrastructure priorities
City investments in transit, parking, and public safety shape foot traffic to cinemas and downtown hotels; the U.S. Bipartisan Infrastructure Law allocates roughly 110 billion for roads/bridges and 39 billion for transit through 2024, which supports accessibility that boosts visit frequency and event bookings. Neglect of precincts can deter evening entertainment and tourism, while advocacy for targeted improvements can lift asset performance.
- Transit funding: 39B transit, 110B roads/bridges
- Expected footfall uplift: typical range 5–15% from accessibility gains
- Improved safety increases visit frequency and bookings
Visa, air connectivity, and regional political stability
International travel policies and geopolitical tensions directly sway hotel inbound demand; IATA reported 2024 international traffic at roughly 95% of 2019 levels, boosting leisure bookings where visas and routes are eased. Eased e-visas and new direct routes have driven higher occupancy and ADR in source markets, while travel restrictions or instability sharply suppress group and luxury segment demand. Continuous monitoring of airline routes and top source markets guides sales targeting and channel mix decisions.
- visa_ease: e-visa rollouts up, raising arrivals from key markets
- air_routes: 95% intl traffic vs 2019 (IATA 2024)
- instability_risk: groups/luxury see fastest demand drop during tensions
- monitoring: route/source-market data to prioritize sales
Zoning, approvals and infra drive hotel demand; construction $1.8T
Municipal approvals, zoning and TIF drive project timelines and costs; US construction put-in-place ~$1.8T (2023). Local marketing budgets affect hotel demand; 2024 US occupancy ~66% with ADR ~$154. Infrastructure (Bipartisan Law: $110B roads/bridges, $39B transit) and intl travel (IATA 2024: intl traffic ~95% of 2019) materially shift footfall and bookings.
| Metric | Value |
|---|---|
| US construction | $1.8T (2023) |
| Hotel occ/ADR | 66% / $154 (2024) |
| Infra | $110B roads, $39B transit |
| Intl traffic | 95% of 2019 (IATA 2024) |
What is included in the product
 Detailed Word Document
Explores how macro-environmental factors uniquely affect Marcus across Political, Economic, Social, Technological, Environmental, and Legal dimensions, with data-backed trends, forward-looking scenario insights, and actionable implications designed to support executives, investors, and entrepreneurs.

 Customizable Excel Spreadsheet
A concise, visually segmented Marcus PESTLE summary that’s easy to drop into presentations, share across teams, and annotate with region- or business-specific notes—ideal for meetings, quick alignment, and strategic planning.
Economic factors

Consumer discretionary spending cycles
Theatres and hotels are highly sensitive to household confidence and disposable income; leisure and hospitality employment exceeded pre-COVID levels in 2024 per BLS, underscoring demand's recovery. Economic slowdowns compress ticket sales, F&B spend, ADR and occupancy, while strategic expansions enable premium formats and higher upsell conversion. Flexible pricing and targeted promotions smooth revenue variability across cycles.
Inflation, interest rates, and capital intensity
High interest rates (Fed funds ~5.25–5.50% in 2024–25) raise financing costs for renovations and new screens, squeezing returns; CPI inflation averaged about 3.4% in 2024, lifting labor, utilities and F&B inputs and pressuring margins. Cost pass-through via ticket and F&B pricing must balance measured demand elasticity; prioritizing high-ROI projects and using hedges or fixed-rate debt can protect cash flow.

Box office supply and content volatility
Theatrical performance remains tied to studio release slates and the 2023–24 writers and actors strikes, which delayed hundreds of releases and compressed tentpole timing. Strong tentpoles and genre variety boost attendance and concession spend, often accounting for the majority of quarterly box office upticks. Content gaps depress visit frequency and screen utilization, while programming alternatives — reissues, indie cycles, event cinema — partially offset troughs.

Travel patterns, group business, and convention cycles
Corporate travel and conventions drive midweek hotel demand and rate strength, with business travel rebounding to near pre‑pandemic levels by 2024 per GBTA; leisure and bleisure trends bolster weekend and shoulder occupancy. Event calendars and citywide conventions can lift pacing 10–30%, while sales‑mix optimization (group vs transient) stabilizes RevPAR across seasons.
- Tag: midweek demand
- Tag: leisure/bleisure
- Tag: event pacing +10–30%
- Tag: sales‑mix stabilizes RevPAR
Labor markets and wage dynamics
Tight labor markets (US unemployment ~3.7% mid-2025) have pushed wages up for hospitality and cinema staff, increasing payroll share and average hourly pay pressures. High turnover—often exceeding 60-70% in hospitality segments—raises training costs and service variability, while productivity tools and cross-training reduce labor hours per guest. Strong employer brand and enhanced benefits measurably improve retention and guest experience.
Zoning, approvals and infra drive hotel demand; construction $1.8T
High rates (Fed funds ~5.25–5.50% in 2024–25) and CPI ~3.4% (2024) raise financing and input costs, pressuring margins; demand recovery (leisure employment > pre‑COVID in 2024, BLS) supports pricing power. Tight labor (unemployment ~3.7% mid‑2025) elevates wages and turnover (60–70%), requiring productivity and targeted pricing to protect RevPAR and box‑office yields.
| Metric | Value |
|---|---|
| Fed funds | 5.25–5.50% (2024–25) |
| CPI | 3.4% (2024) |
| Unemployment | 3.7% (mid‑2025) |
| Leisure employment | Above pre‑COVID (BLS 2024) |
| Hospitality turnover | 60–70% |
Preview Before You Purchase
Marcus PESTLE Analysis
The Marcus PESTLE Analysis preview shown here is the exact document you’ll receive after purchase—fully formatted and ready to use. It contains the same structured political, economic, social, technological, legal, and environmental insights visible in the sample, with no placeholders or teasers. After payment you’ll instantly download this final, professionally prepared file.

Your Competitive Advantage Starts with This Report
Discover how political, economic, social, technological, legal, and environmental forces are reshaping Marcus’s prospects in our concise PESTLE briefing—insights tailored for investors and strategists. This analysis highlights risks and opportunities you can act on today. Purchase the full PESTLE to access the complete, editable report and make data-driven decisions with confidence.
Political factors
Local zoning, permits, and development incentives
Hotel and cinema projects hinge on municipal approvals, zoning variances and tools like tax increment financing, with U.S. construction put in place at roughly $1.8 trillion in 2023 (U.S. Census). Pro-business cities that streamline permits accelerate new builds and refurbishments. Opposition or policy shifts can delay timelines and raise costs. Active stakeholder engagement helps secure incentives and community support.
Tourism promotion and destination marketing funding
State and city budgets for convention bureaus and tourism boards directly influence hotel demand; in 2024 U.S. hotel occupancy averaged about 66% with ADR near $154, showing sensitivity to destination marketing spend. Increased funding for events and campaigns can lift group and leisure inflows and RevPAR, while cuts compress group bookings and push RevPAR down. Marcus stands to gain when its portfolio aligns with local marketing strategies.
Public health policy and emergency mandates
Changes to health guidelines can force theater occupancy limits and hotel operational changes; the US COVID public health emergency ended May 11, 2023, but past shifts cut US box office ~80% in Q2 2020 and hotel RevPAR fell ~87% in April 2020, showing revenue sensitivity. Preparedness for rapid policy shifts preserves continuity, and clear compliance builds guest trust while reducing reputational risk.
Urban safety, transportation, and infrastructure priorities
City investments in transit, parking, and public safety shape foot traffic to cinemas and downtown hotels; the U.S. Bipartisan Infrastructure Law allocates roughly 110 billion for roads/bridges and 39 billion for transit through 2024, which supports accessibility that boosts visit frequency and event bookings. Neglect of precincts can deter evening entertainment and tourism, while advocacy for targeted improvements can lift asset performance.
- Transit funding: 39B transit, 110B roads/bridges
- Expected footfall uplift: typical range 5–15% from accessibility gains
- Improved safety increases visit frequency and bookings
Visa, air connectivity, and regional political stability
International travel policies and geopolitical tensions directly sway hotel inbound demand; IATA reported 2024 international traffic at roughly 95% of 2019 levels, boosting leisure bookings where visas and routes are eased. Eased e-visas and new direct routes have driven higher occupancy and ADR in source markets, while travel restrictions or instability sharply suppress group and luxury segment demand. Continuous monitoring of airline routes and top source markets guides sales targeting and channel mix decisions.
- visa_ease: e-visa rollouts up, raising arrivals from key markets
- air_routes: 95% intl traffic vs 2019 (IATA 2024)
- instability_risk: groups/luxury see fastest demand drop during tensions
- monitoring: route/source-market data to prioritize sales
Zoning, approvals and infra drive hotel demand; construction $1.8T
Municipal approvals, zoning and TIF drive project timelines and costs; US construction put-in-place ~$1.8T (2023). Local marketing budgets affect hotel demand; 2024 US occupancy ~66% with ADR ~$154. Infrastructure (Bipartisan Law: $110B roads/bridges, $39B transit) and intl travel (IATA 2024: intl traffic ~95% of 2019) materially shift footfall and bookings.
| Metric | Value |
|---|---|
| US construction | $1.8T (2023) |
| Hotel occ/ADR | 66% / $154 (2024) |
| Infra | $110B roads, $39B transit |
| Intl traffic | 95% of 2019 (IATA 2024) |
What is included in the product
Detailed Word Document
Explores how macro-environmental factors uniquely affect Marcus across Political, Economic, Social, Technological, Environmental, and Legal dimensions, with data-backed trends, forward-looking scenario insights, and actionable implications designed to support executives, investors, and entrepreneurs.
Customizable Excel Spreadsheet
A concise, visually segmented Marcus PESTLE summary that’s easy to drop into presentations, share across teams, and annotate with region- or business-specific notes—ideal for meetings, quick alignment, and strategic planning.
Economic factors
Consumer discretionary spending cycles
Theatres and hotels are highly sensitive to household confidence and disposable income; leisure and hospitality employment exceeded pre-COVID levels in 2024 per BLS, underscoring demand's recovery. Economic slowdowns compress ticket sales, F&B spend, ADR and occupancy, while strategic expansions enable premium formats and higher upsell conversion. Flexible pricing and targeted promotions smooth revenue variability across cycles.
Inflation, interest rates, and capital intensity
High interest rates (Fed funds ~5.25–5.50% in 2024–25) raise financing costs for renovations and new screens, squeezing returns; CPI inflation averaged about 3.4% in 2024, lifting labor, utilities and F&B inputs and pressuring margins. Cost pass-through via ticket and F&B pricing must balance measured demand elasticity; prioritizing high-ROI projects and using hedges or fixed-rate debt can protect cash flow.
Box office supply and content volatility
Theatrical performance remains tied to studio release slates and the 2023–24 writers and actors strikes, which delayed hundreds of releases and compressed tentpole timing. Strong tentpoles and genre variety boost attendance and concession spend, often accounting for the majority of quarterly box office upticks. Content gaps depress visit frequency and screen utilization, while programming alternatives — reissues, indie cycles, event cinema — partially offset troughs.
Travel patterns, group business, and convention cycles
Corporate travel and conventions drive midweek hotel demand and rate strength, with business travel rebounding to near pre‑pandemic levels by 2024 per GBTA; leisure and bleisure trends bolster weekend and shoulder occupancy. Event calendars and citywide conventions can lift pacing 10–30%, while sales‑mix optimization (group vs transient) stabilizes RevPAR across seasons.
- Tag: midweek demand
- Tag: leisure/bleisure
- Tag: event pacing +10–30%
- Tag: sales‑mix stabilizes RevPAR
Labor markets and wage dynamics
Tight labor markets (US unemployment ~3.7% mid-2025) have pushed wages up for hospitality and cinema staff, increasing payroll share and average hourly pay pressures. High turnover—often exceeding 60-70% in hospitality segments—raises training costs and service variability, while productivity tools and cross-training reduce labor hours per guest. Strong employer brand and enhanced benefits measurably improve retention and guest experience.
Zoning, approvals and infra drive hotel demand; construction $1.8T
High rates (Fed funds ~5.25–5.50% in 2024–25) and CPI ~3.4% (2024) raise financing and input costs, pressuring margins; demand recovery (leisure employment > pre‑COVID in 2024, BLS) supports pricing power. Tight labor (unemployment ~3.7% mid‑2025) elevates wages and turnover (60–70%), requiring productivity and targeted pricing to protect RevPAR and box‑office yields.
| Metric | Value |
|---|---|
| Fed funds | 5.25–5.50% (2024–25) |
| CPI | 3.4% (2024) |
| Unemployment | 3.7% (mid‑2025) |
| Leisure employment | Above pre‑COVID (BLS 2024) |
| Hospitality turnover | 60–70% |
Preview Before You Purchase
Marcus PESTLE Analysis
The Marcus PESTLE Analysis preview shown here is the exact document you’ll receive after purchase—fully formatted and ready to use. It contains the same structured political, economic, social, technological, legal, and environmental insights visible in the sample, with no placeholders or teasers. After payment you’ll instantly download this final, professionally prepared file.
Original: $10.00
-65%$10.00
$3.50Description
Your Competitive Advantage Starts with This Report
Discover how political, economic, social, technological, legal, and environmental forces are reshaping Marcus’s prospects in our concise PESTLE briefing—insights tailored for investors and strategists. This analysis highlights risks and opportunities you can act on today. Purchase the full PESTLE to access the complete, editable report and make data-driven decisions with confidence.
Political factors
Local zoning, permits, and development incentives
Hotel and cinema projects hinge on municipal approvals, zoning variances and tools like tax increment financing, with U.S. construction put in place at roughly $1.8 trillion in 2023 (U.S. Census). Pro-business cities that streamline permits accelerate new builds and refurbishments. Opposition or policy shifts can delay timelines and raise costs. Active stakeholder engagement helps secure incentives and community support.
Tourism promotion and destination marketing funding
State and city budgets for convention bureaus and tourism boards directly influence hotel demand; in 2024 U.S. hotel occupancy averaged about 66% with ADR near $154, showing sensitivity to destination marketing spend. Increased funding for events and campaigns can lift group and leisure inflows and RevPAR, while cuts compress group bookings and push RevPAR down. Marcus stands to gain when its portfolio aligns with local marketing strategies.
Public health policy and emergency mandates
Changes to health guidelines can force theater occupancy limits and hotel operational changes; the US COVID public health emergency ended May 11, 2023, but past shifts cut US box office ~80% in Q2 2020 and hotel RevPAR fell ~87% in April 2020, showing revenue sensitivity. Preparedness for rapid policy shifts preserves continuity, and clear compliance builds guest trust while reducing reputational risk.
Urban safety, transportation, and infrastructure priorities
City investments in transit, parking, and public safety shape foot traffic to cinemas and downtown hotels; the U.S. Bipartisan Infrastructure Law allocates roughly 110 billion for roads/bridges and 39 billion for transit through 2024, which supports accessibility that boosts visit frequency and event bookings. Neglect of precincts can deter evening entertainment and tourism, while advocacy for targeted improvements can lift asset performance.
- Transit funding: 39B transit, 110B roads/bridges
- Expected footfall uplift: typical range 5–15% from accessibility gains
- Improved safety increases visit frequency and bookings
Visa, air connectivity, and regional political stability
International travel policies and geopolitical tensions directly sway hotel inbound demand; IATA reported 2024 international traffic at roughly 95% of 2019 levels, boosting leisure bookings where visas and routes are eased. Eased e-visas and new direct routes have driven higher occupancy and ADR in source markets, while travel restrictions or instability sharply suppress group and luxury segment demand. Continuous monitoring of airline routes and top source markets guides sales targeting and channel mix decisions.
- visa_ease: e-visa rollouts up, raising arrivals from key markets
- air_routes: 95% intl traffic vs 2019 (IATA 2024)
- instability_risk: groups/luxury see fastest demand drop during tensions
- monitoring: route/source-market data to prioritize sales
Zoning, approvals and infra drive hotel demand; construction $1.8T
Municipal approvals, zoning and TIF drive project timelines and costs; US construction put-in-place ~$1.8T (2023). Local marketing budgets affect hotel demand; 2024 US occupancy ~66% with ADR ~$154. Infrastructure (Bipartisan Law: $110B roads/bridges, $39B transit) and intl travel (IATA 2024: intl traffic ~95% of 2019) materially shift footfall and bookings.
| Metric | Value |
|---|---|
| US construction | $1.8T (2023) |
| Hotel occ/ADR | 66% / $154 (2024) |
| Infra | $110B roads, $39B transit |
| Intl traffic | 95% of 2019 (IATA 2024) |
What is included in the product
Detailed Word Document
Explores how macro-environmental factors uniquely affect Marcus across Political, Economic, Social, Technological, Environmental, and Legal dimensions, with data-backed trends, forward-looking scenario insights, and actionable implications designed to support executives, investors, and entrepreneurs.
Customizable Excel Spreadsheet
A concise, visually segmented Marcus PESTLE summary that’s easy to drop into presentations, share across teams, and annotate with region- or business-specific notes—ideal for meetings, quick alignment, and strategic planning.
Economic factors
Consumer discretionary spending cycles
Theatres and hotels are highly sensitive to household confidence and disposable income; leisure and hospitality employment exceeded pre-COVID levels in 2024 per BLS, underscoring demand's recovery. Economic slowdowns compress ticket sales, F&B spend, ADR and occupancy, while strategic expansions enable premium formats and higher upsell conversion. Flexible pricing and targeted promotions smooth revenue variability across cycles.
Inflation, interest rates, and capital intensity
High interest rates (Fed funds ~5.25–5.50% in 2024–25) raise financing costs for renovations and new screens, squeezing returns; CPI inflation averaged about 3.4% in 2024, lifting labor, utilities and F&B inputs and pressuring margins. Cost pass-through via ticket and F&B pricing must balance measured demand elasticity; prioritizing high-ROI projects and using hedges or fixed-rate debt can protect cash flow.
Box office supply and content volatility
Theatrical performance remains tied to studio release slates and the 2023–24 writers and actors strikes, which delayed hundreds of releases and compressed tentpole timing. Strong tentpoles and genre variety boost attendance and concession spend, often accounting for the majority of quarterly box office upticks. Content gaps depress visit frequency and screen utilization, while programming alternatives — reissues, indie cycles, event cinema — partially offset troughs.
Travel patterns, group business, and convention cycles
Corporate travel and conventions drive midweek hotel demand and rate strength, with business travel rebounding to near pre‑pandemic levels by 2024 per GBTA; leisure and bleisure trends bolster weekend and shoulder occupancy. Event calendars and citywide conventions can lift pacing 10–30%, while sales‑mix optimization (group vs transient) stabilizes RevPAR across seasons.
- Tag: midweek demand
- Tag: leisure/bleisure
- Tag: event pacing +10–30%
- Tag: sales‑mix stabilizes RevPAR
Labor markets and wage dynamics
Tight labor markets (US unemployment ~3.7% mid-2025) have pushed wages up for hospitality and cinema staff, increasing payroll share and average hourly pay pressures. High turnover—often exceeding 60-70% in hospitality segments—raises training costs and service variability, while productivity tools and cross-training reduce labor hours per guest. Strong employer brand and enhanced benefits measurably improve retention and guest experience.
Zoning, approvals and infra drive hotel demand; construction $1.8T
High rates (Fed funds ~5.25–5.50% in 2024–25) and CPI ~3.4% (2024) raise financing and input costs, pressuring margins; demand recovery (leisure employment > pre‑COVID in 2024, BLS) supports pricing power. Tight labor (unemployment ~3.7% mid‑2025) elevates wages and turnover (60–70%), requiring productivity and targeted pricing to protect RevPAR and box‑office yields.
| Metric | Value |
|---|---|
| Fed funds | 5.25–5.50% (2024–25) |
| CPI | 3.4% (2024) |
| Unemployment | 3.7% (mid‑2025) |
| Leisure employment | Above pre‑COVID (BLS 2024) |
| Hospitality turnover | 60–70% |
Preview Before You Purchase
Marcus PESTLE Analysis
The Marcus PESTLE Analysis preview shown here is the exact document you’ll receive after purchase—fully formatted and ready to use. It contains the same structured political, economic, social, technological, legal, and environmental insights visible in the sample, with no placeholders or teasers. After payment you’ll instantly download this final, professionally prepared file.











