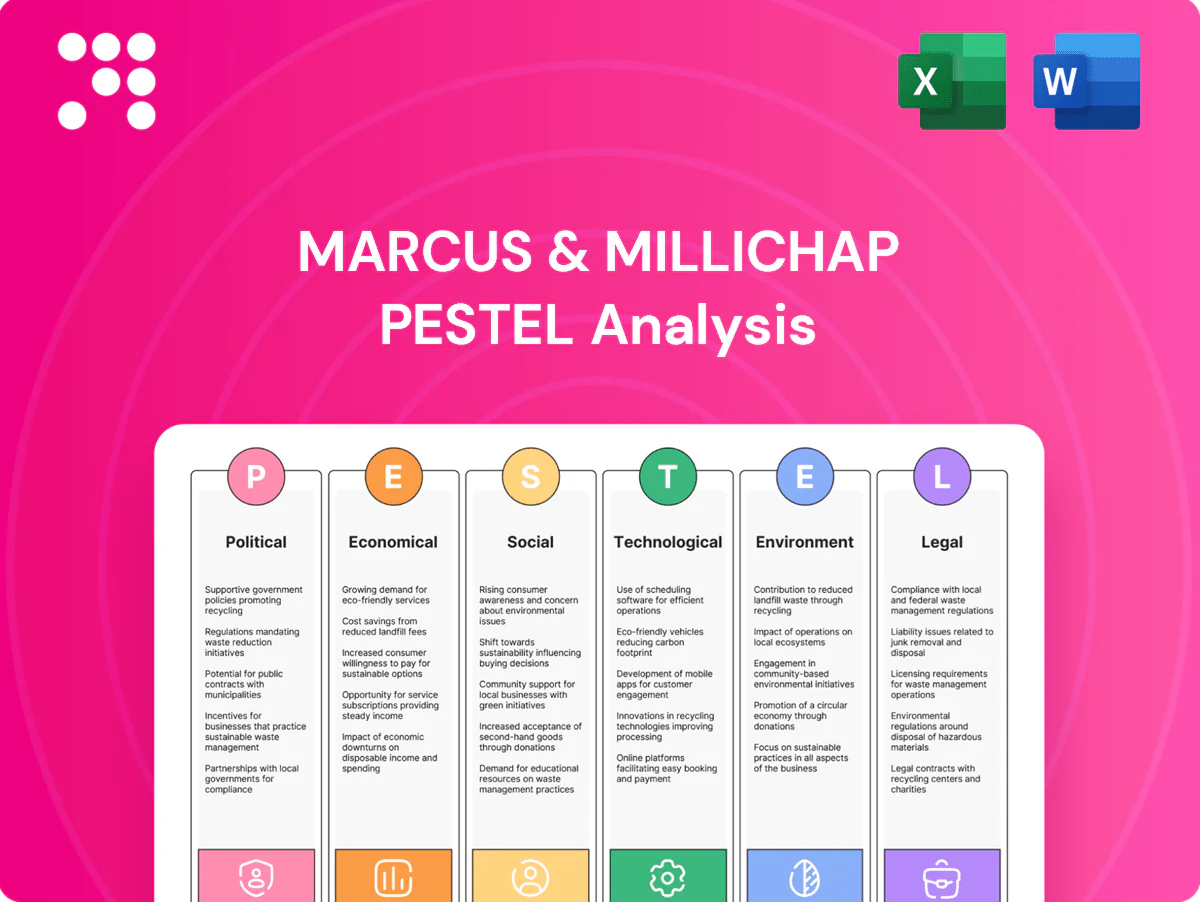
Marcus & Millichap PESTLE Analysis

Plan Smarter. Present Sharper. Compete Stronger.
Discover how political shifts, economic cycles, and technological change shape Marcus & Millichap’s competitive outlook in our concise PESTLE snapshot; it highlights risks and opportunities for investors and strategists. For the full, actionable breakdown—ready to download and use—purchase the complete PESTLE analysis now.
Political factors

Zoning and land-use policy shifts
Local and state zoning shifts can rapidly unlock or constrain multifamily, industrial and retail supply, with entitlement timelines commonly ranging 6–18 months and materially affecting pricing and deal certainty. Marcus & Millichap must monitor municipal agendas and cultivate city hall relationships to anticipate approvals. Proactive insight positions listings and buyers ahead of supply inflections and tight markets.
Tax policy and 1031 exchange stability
Proposals to limit like-kind exchanges would reduce transaction velocity and alter underwriting for Marcus & Millichap, increasing realized tax cash-outs for sellers. Federal long-term capital gains remain taxed at 20% plus the 3.8% NIIT (23.8% total) and state top rates like California reach 13.3%; bonus depreciation phases to 40% in 2025. The firm should scenario-plan, educate clients on structures and timing, and pursue policy engagement and thought leadership to limit uncertainty-driven deal delays.

Public infrastructure spending
New transportation, broadband and logistics investments from the Bipartisan Infrastructure Law (roughly 550 billion in new spending) and the BEAD broadband program (42.45 billion) can re-rate submarkets; industrial and mixed-use sites near projects often see cap-rate compression. Marcus & Millichap maps pipeline projects to identify emerging nodes, enabling targeted outreach to align capital with policy-driven growth corridors.

Housing affordability and rent control
Local rent regulations in metros such as New York, San Francisco, Los Angeles and Portland materially compress multifamily cash flows, valuations and lender appetite; 31 percent of US renter households were cost-burdened per HUD data, heightening political sensitivity. Compliance complexity can deter broad capital while creating niche arbitrage for experienced operators; Marcus & Millichap should parse ordinances to segment risk-adjusted buyers and stress-test NOI resilience using turnover and concession metrics.
- Impact: reduced rent upside, higher cap-rate premium
- Risk: compliance and legal exposure raise debt spreads
- Opportunity: specialized buyers capture regulated assets
- Action: use market reports on turnover, concessions, NOI to reframe narratives
Global capital flows and geopolitical risk
Sanctions, currency volatility and capital controls materially reshape cross-border CRE demand; UNCTAD reported global FDI fell about 12% in 2023 to roughly $1.3 trillion, tightening foreign capital pools. Gateway cities and trophy assets remain most exposed to policy shocks given concentrated foreign ownership. Emphasizing dollar-denominated stability (USD ~58.5% of global reserves in 2024, IMF COFER) and diversifying buyer channels attracts buyers, while asset-level briefings that map macro risk to cashflows build trust.
- Sanctions & controls: restrict bidder pools
- Currency risk: raises hedging costs
- Gateways/trophy: highest policy sensitivity
- Dollar safety: USD ~58.5% of reserves (2024)
- Action: diversify channels; provide asset-level macro briefings
Political risk, tax changes and entitlement delays compress multifamily NOI and deals
Political shifts drive zoning, tax and rent-policy risk that reshape supply, underwriting and valuations; entitlement delays (6–18 months) and rent rules in NY/CA/OR compress multifamily NOI. Changes to like-kind exchanges and tax rules (23.8% federal long-term rate; CA top 13.3%) would reduce transaction velocity. Infrastructure and BEAD funding (≈550 billion; 42.45 billion) re-rate submarkets and industrial demand. Cross-border flows fell ~12% in 2023 (FDI ≈1.3 trillion), raising gateway risk.
| Factor | Metric |
|---|---|
| Entitlements | 6–18 months |
| Tax | Federal 23.8% incl. NIIT; CA 13.3% |
| Infrastructure | ≈550B; BEAD 42.45B |
| FDI | ≈1.3T (−12% in 2023) |
What is included in the product
 Detailed Word Document
Provides a concise PESTLE assessment showing how Political, Economic, Social, Technological, Environmental, and Legal forces shape Marcus & Millichap’s commercial real estate advisory model, with data-backed, region- and industry-specific insights designed for executives, investors, and planners to identify risks, opportunities, and scenario-driven strategies.

 Customizable Excel Spreadsheet
A clean, visually segmented Marcus & Millichap PESTLE summary that can be dropped into presentations, annotated for local context, and easily shared across teams to streamline external risk discussions and planning.
Economic factors

Interest rates and cap-rate dynamics
Interest-rate paths drive discount rates, pricing spreads and bid-ask alignment: with the U.S. policy rate near 5.25–5.50% and the 10-year Treasury around 4.5% in 2024–25, commercial cap rates have widened roughly 150–200 bps versus 2021, pressuring valuations. Rapid moves can freeze markets until expectations reset; transactions slowed sharply in 2023–24 as spreads and uncertainty spiked. Marcus & Millichap uses scenario cap-rate bands, re-trading guidance and data-led comps to restore price discovery and educate sellers.
Credit availability and bank health
Lender risk appetite drives leverage, DSCR thresholds and refinance feasibility as higher rates raise debt service burdens; the fed funds rate held near 5.25–5.50% in 2024–25, compressing borrowing capacity. Regional bank stress after 2023 failures tightened construction and bridge lending, so Marcus & Millichap can expand non-bank relationships. Financing advisory becomes a key differentiator in constrained credit cycles.

Employment and space demand
Strong job growth (US unemployment ~3.8% in 2024) drives absorption in industrial, retail and hospitality while office demand lags with national office vacancy near 17% in 2024. Remote/hybrid patterns depress core office submarkets and reduce peak density. Market-by-market labor analytics calibrate rent-growth assumptions. Locating assets near resilient employment nodes boosts occupancy and rent resilience.

Supply pipeline and replacement costs
Rising construction starts (US housing starts ~1.4M in 2024) and steady deliveries (multifamily completions near 350k) plus materials costs pressure pricing and competition for Marcus & Millichap listings.
Elevated replacement costs versus pre-pandemic levels support pricing for stabilized assets; M&M should monitor permits and cost indices to time dispositions and advise sellers.
Investors pay up for clear lease-up visibility and trending concessions; tracking permit flows and cost inflation reduces execution risk.
- permits: monitor monthly census permit data
- cost indices: follow ENR/CPI construction indexes
- lease-up: report absorption and concession trends
Inflation and NOI durability
Inflation (US CPI 12‑month +3.3% as of June 2025) pushes operating expenses and lease escalators; multifamily (median lease ~12 months) and self‑storage (tenancies ~6–9 months) reprice far faster than office (typical lease 5–7 years), so NOI durability varies by asset class. Marcus & Millichap can emphasize CPI‑linked clauses and expense pass‑throughs while underwriting stress‑tests margin compression and tax/insurance spikes (commercial insurance rose ~12% in 2024).
- CPI +3.3% (Jun 2025)
- Multifamily lease ~12 months
- Self‑storage tenancy 6–9 months
- Office lease 5–7 years
- Insurance +12% (2024)
- Underwrite with CPI clauses, expense pass‑throughs, margin stress tests
Political risk, tax changes and entitlement delays compress multifamily NOI and deals
Higher policy rates (fed funds 5.25–5.50%, 10y ~4.5% in 2024–25) widened cap rates ~150–200bps, slowing transactions; tight credit and regional bank stress constrain leverage. Strong labor (unemp ~3.8% 2024) supports industrial/retail absorption while office vacancy ~17% depresses values. Inflation CPI +3.3% (Jun 2025) and insurance +12% (2024) raise OPEX and underwriting stress.
| Metric | Value |
|---|---|
| Fed funds | 5.25–5.50% |
| 10‑yr Treasury | ~4.5% |
| CPI (Jun 2025) | +3.3% |
| Unemployment (2024) | ~3.8% |
| Office vacancy (2024) | ~17% |
| Multifamily completions (2024) | ~350k |
What You See Is What You Get
Marcus & Millichap PESTLE Analysis
The Marcus & Millichap PESTLE Analysis preview is the exact, fully formatted document you’ll receive after purchase. It contains the complete, professionally structured analysis with no placeholders or teasers. After checkout you’ll be able to download this same final file immediately.

Plan Smarter. Present Sharper. Compete Stronger.
Discover how political shifts, economic cycles, and technological change shape Marcus & Millichap’s competitive outlook in our concise PESTLE snapshot; it highlights risks and opportunities for investors and strategists. For the full, actionable breakdown—ready to download and use—purchase the complete PESTLE analysis now.
Political factors
Zoning and land-use policy shifts
Local and state zoning shifts can rapidly unlock or constrain multifamily, industrial and retail supply, with entitlement timelines commonly ranging 6–18 months and materially affecting pricing and deal certainty. Marcus & Millichap must monitor municipal agendas and cultivate city hall relationships to anticipate approvals. Proactive insight positions listings and buyers ahead of supply inflections and tight markets.
Tax policy and 1031 exchange stability
Proposals to limit like-kind exchanges would reduce transaction velocity and alter underwriting for Marcus & Millichap, increasing realized tax cash-outs for sellers. Federal long-term capital gains remain taxed at 20% plus the 3.8% NIIT (23.8% total) and state top rates like California reach 13.3%; bonus depreciation phases to 40% in 2025. The firm should scenario-plan, educate clients on structures and timing, and pursue policy engagement and thought leadership to limit uncertainty-driven deal delays.
Public infrastructure spending
New transportation, broadband and logistics investments from the Bipartisan Infrastructure Law (roughly 550 billion in new spending) and the BEAD broadband program (42.45 billion) can re-rate submarkets; industrial and mixed-use sites near projects often see cap-rate compression. Marcus & Millichap maps pipeline projects to identify emerging nodes, enabling targeted outreach to align capital with policy-driven growth corridors.
Housing affordability and rent control
Local rent regulations in metros such as New York, San Francisco, Los Angeles and Portland materially compress multifamily cash flows, valuations and lender appetite; 31 percent of US renter households were cost-burdened per HUD data, heightening political sensitivity. Compliance complexity can deter broad capital while creating niche arbitrage for experienced operators; Marcus & Millichap should parse ordinances to segment risk-adjusted buyers and stress-test NOI resilience using turnover and concession metrics.
- Impact: reduced rent upside, higher cap-rate premium
- Risk: compliance and legal exposure raise debt spreads
- Opportunity: specialized buyers capture regulated assets
- Action: use market reports on turnover, concessions, NOI to reframe narratives
Global capital flows and geopolitical risk
Sanctions, currency volatility and capital controls materially reshape cross-border CRE demand; UNCTAD reported global FDI fell about 12% in 2023 to roughly $1.3 trillion, tightening foreign capital pools. Gateway cities and trophy assets remain most exposed to policy shocks given concentrated foreign ownership. Emphasizing dollar-denominated stability (USD ~58.5% of global reserves in 2024, IMF COFER) and diversifying buyer channels attracts buyers, while asset-level briefings that map macro risk to cashflows build trust.
- Sanctions & controls: restrict bidder pools
- Currency risk: raises hedging costs
- Gateways/trophy: highest policy sensitivity
- Dollar safety: USD ~58.5% of reserves (2024)
- Action: diversify channels; provide asset-level macro briefings
Political risk, tax changes and entitlement delays compress multifamily NOI and deals
Political shifts drive zoning, tax and rent-policy risk that reshape supply, underwriting and valuations; entitlement delays (6–18 months) and rent rules in NY/CA/OR compress multifamily NOI. Changes to like-kind exchanges and tax rules (23.8% federal long-term rate; CA top 13.3%) would reduce transaction velocity. Infrastructure and BEAD funding (≈550 billion; 42.45 billion) re-rate submarkets and industrial demand. Cross-border flows fell ~12% in 2023 (FDI ≈1.3 trillion), raising gateway risk.
| Factor | Metric |
|---|---|
| Entitlements | 6–18 months |
| Tax | Federal 23.8% incl. NIIT; CA 13.3% |
| Infrastructure | ≈550B; BEAD 42.45B |
| FDI | ≈1.3T (−12% in 2023) |
What is included in the product
Detailed Word Document
Provides a concise PESTLE assessment showing how Political, Economic, Social, Technological, Environmental, and Legal forces shape Marcus & Millichap’s commercial real estate advisory model, with data-backed, region- and industry-specific insights designed for executives, investors, and planners to identify risks, opportunities, and scenario-driven strategies.
Customizable Excel Spreadsheet
A clean, visually segmented Marcus & Millichap PESTLE summary that can be dropped into presentations, annotated for local context, and easily shared across teams to streamline external risk discussions and planning.
Economic factors
Interest rates and cap-rate dynamics
Interest-rate paths drive discount rates, pricing spreads and bid-ask alignment: with the U.S. policy rate near 5.25–5.50% and the 10-year Treasury around 4.5% in 2024–25, commercial cap rates have widened roughly 150–200 bps versus 2021, pressuring valuations. Rapid moves can freeze markets until expectations reset; transactions slowed sharply in 2023–24 as spreads and uncertainty spiked. Marcus & Millichap uses scenario cap-rate bands, re-trading guidance and data-led comps to restore price discovery and educate sellers.
Credit availability and bank health
Lender risk appetite drives leverage, DSCR thresholds and refinance feasibility as higher rates raise debt service burdens; the fed funds rate held near 5.25–5.50% in 2024–25, compressing borrowing capacity. Regional bank stress after 2023 failures tightened construction and bridge lending, so Marcus & Millichap can expand non-bank relationships. Financing advisory becomes a key differentiator in constrained credit cycles.
Employment and space demand
Strong job growth (US unemployment ~3.8% in 2024) drives absorption in industrial, retail and hospitality while office demand lags with national office vacancy near 17% in 2024. Remote/hybrid patterns depress core office submarkets and reduce peak density. Market-by-market labor analytics calibrate rent-growth assumptions. Locating assets near resilient employment nodes boosts occupancy and rent resilience.
Supply pipeline and replacement costs
Rising construction starts (US housing starts ~1.4M in 2024) and steady deliveries (multifamily completions near 350k) plus materials costs pressure pricing and competition for Marcus & Millichap listings.
Elevated replacement costs versus pre-pandemic levels support pricing for stabilized assets; M&M should monitor permits and cost indices to time dispositions and advise sellers.
Investors pay up for clear lease-up visibility and trending concessions; tracking permit flows and cost inflation reduces execution risk.
- permits: monitor monthly census permit data
- cost indices: follow ENR/CPI construction indexes
- lease-up: report absorption and concession trends
Inflation and NOI durability
Inflation (US CPI 12‑month +3.3% as of June 2025) pushes operating expenses and lease escalators; multifamily (median lease ~12 months) and self‑storage (tenancies ~6–9 months) reprice far faster than office (typical lease 5–7 years), so NOI durability varies by asset class. Marcus & Millichap can emphasize CPI‑linked clauses and expense pass‑throughs while underwriting stress‑tests margin compression and tax/insurance spikes (commercial insurance rose ~12% in 2024).
- CPI +3.3% (Jun 2025)
- Multifamily lease ~12 months
- Self‑storage tenancy 6–9 months
- Office lease 5–7 years
- Insurance +12% (2024)
- Underwrite with CPI clauses, expense pass‑throughs, margin stress tests
Political risk, tax changes and entitlement delays compress multifamily NOI and deals
Higher policy rates (fed funds 5.25–5.50%, 10y ~4.5% in 2024–25) widened cap rates ~150–200bps, slowing transactions; tight credit and regional bank stress constrain leverage. Strong labor (unemp ~3.8% 2024) supports industrial/retail absorption while office vacancy ~17% depresses values. Inflation CPI +3.3% (Jun 2025) and insurance +12% (2024) raise OPEX and underwriting stress.
| Metric | Value |
|---|---|
| Fed funds | 5.25–5.50% |
| 10‑yr Treasury | ~4.5% |
| CPI (Jun 2025) | +3.3% |
| Unemployment (2024) | ~3.8% |
| Office vacancy (2024) | ~17% |
| Multifamily completions (2024) | ~350k |
What You See Is What You Get
Marcus & Millichap PESTLE Analysis
The Marcus & Millichap PESTLE Analysis preview is the exact, fully formatted document you’ll receive after purchase. It contains the complete, professionally structured analysis with no placeholders or teasers. After checkout you’ll be able to download this same final file immediately.
Description
Plan Smarter. Present Sharper. Compete Stronger.
Discover how political shifts, economic cycles, and technological change shape Marcus & Millichap’s competitive outlook in our concise PESTLE snapshot; it highlights risks and opportunities for investors and strategists. For the full, actionable breakdown—ready to download and use—purchase the complete PESTLE analysis now.
Political factors
Zoning and land-use policy shifts
Local and state zoning shifts can rapidly unlock or constrain multifamily, industrial and retail supply, with entitlement timelines commonly ranging 6–18 months and materially affecting pricing and deal certainty. Marcus & Millichap must monitor municipal agendas and cultivate city hall relationships to anticipate approvals. Proactive insight positions listings and buyers ahead of supply inflections and tight markets.
Tax policy and 1031 exchange stability
Proposals to limit like-kind exchanges would reduce transaction velocity and alter underwriting for Marcus & Millichap, increasing realized tax cash-outs for sellers. Federal long-term capital gains remain taxed at 20% plus the 3.8% NIIT (23.8% total) and state top rates like California reach 13.3%; bonus depreciation phases to 40% in 2025. The firm should scenario-plan, educate clients on structures and timing, and pursue policy engagement and thought leadership to limit uncertainty-driven deal delays.
Public infrastructure spending
New transportation, broadband and logistics investments from the Bipartisan Infrastructure Law (roughly 550 billion in new spending) and the BEAD broadband program (42.45 billion) can re-rate submarkets; industrial and mixed-use sites near projects often see cap-rate compression. Marcus & Millichap maps pipeline projects to identify emerging nodes, enabling targeted outreach to align capital with policy-driven growth corridors.
Housing affordability and rent control
Local rent regulations in metros such as New York, San Francisco, Los Angeles and Portland materially compress multifamily cash flows, valuations and lender appetite; 31 percent of US renter households were cost-burdened per HUD data, heightening political sensitivity. Compliance complexity can deter broad capital while creating niche arbitrage for experienced operators; Marcus & Millichap should parse ordinances to segment risk-adjusted buyers and stress-test NOI resilience using turnover and concession metrics.
- Impact: reduced rent upside, higher cap-rate premium
- Risk: compliance and legal exposure raise debt spreads
- Opportunity: specialized buyers capture regulated assets
- Action: use market reports on turnover, concessions, NOI to reframe narratives
Global capital flows and geopolitical risk
Sanctions, currency volatility and capital controls materially reshape cross-border CRE demand; UNCTAD reported global FDI fell about 12% in 2023 to roughly $1.3 trillion, tightening foreign capital pools. Gateway cities and trophy assets remain most exposed to policy shocks given concentrated foreign ownership. Emphasizing dollar-denominated stability (USD ~58.5% of global reserves in 2024, IMF COFER) and diversifying buyer channels attracts buyers, while asset-level briefings that map macro risk to cashflows build trust.
- Sanctions & controls: restrict bidder pools
- Currency risk: raises hedging costs
- Gateways/trophy: highest policy sensitivity
- Dollar safety: USD ~58.5% of reserves (2024)
- Action: diversify channels; provide asset-level macro briefings
Political risk, tax changes and entitlement delays compress multifamily NOI and deals
Political shifts drive zoning, tax and rent-policy risk that reshape supply, underwriting and valuations; entitlement delays (6–18 months) and rent rules in NY/CA/OR compress multifamily NOI. Changes to like-kind exchanges and tax rules (23.8% federal long-term rate; CA top 13.3%) would reduce transaction velocity. Infrastructure and BEAD funding (≈550 billion; 42.45 billion) re-rate submarkets and industrial demand. Cross-border flows fell ~12% in 2023 (FDI ≈1.3 trillion), raising gateway risk.
| Factor | Metric |
|---|---|
| Entitlements | 6–18 months |
| Tax | Federal 23.8% incl. NIIT; CA 13.3% |
| Infrastructure | ≈550B; BEAD 42.45B |
| FDI | ≈1.3T (−12% in 2023) |
What is included in the product
Detailed Word Document
Provides a concise PESTLE assessment showing how Political, Economic, Social, Technological, Environmental, and Legal forces shape Marcus & Millichap’s commercial real estate advisory model, with data-backed, region- and industry-specific insights designed for executives, investors, and planners to identify risks, opportunities, and scenario-driven strategies.
Customizable Excel Spreadsheet
A clean, visually segmented Marcus & Millichap PESTLE summary that can be dropped into presentations, annotated for local context, and easily shared across teams to streamline external risk discussions and planning.
Economic factors
Interest rates and cap-rate dynamics
Interest-rate paths drive discount rates, pricing spreads and bid-ask alignment: with the U.S. policy rate near 5.25–5.50% and the 10-year Treasury around 4.5% in 2024–25, commercial cap rates have widened roughly 150–200 bps versus 2021, pressuring valuations. Rapid moves can freeze markets until expectations reset; transactions slowed sharply in 2023–24 as spreads and uncertainty spiked. Marcus & Millichap uses scenario cap-rate bands, re-trading guidance and data-led comps to restore price discovery and educate sellers.
Credit availability and bank health
Lender risk appetite drives leverage, DSCR thresholds and refinance feasibility as higher rates raise debt service burdens; the fed funds rate held near 5.25–5.50% in 2024–25, compressing borrowing capacity. Regional bank stress after 2023 failures tightened construction and bridge lending, so Marcus & Millichap can expand non-bank relationships. Financing advisory becomes a key differentiator in constrained credit cycles.
Employment and space demand
Strong job growth (US unemployment ~3.8% in 2024) drives absorption in industrial, retail and hospitality while office demand lags with national office vacancy near 17% in 2024. Remote/hybrid patterns depress core office submarkets and reduce peak density. Market-by-market labor analytics calibrate rent-growth assumptions. Locating assets near resilient employment nodes boosts occupancy and rent resilience.
Supply pipeline and replacement costs
Rising construction starts (US housing starts ~1.4M in 2024) and steady deliveries (multifamily completions near 350k) plus materials costs pressure pricing and competition for Marcus & Millichap listings.
Elevated replacement costs versus pre-pandemic levels support pricing for stabilized assets; M&M should monitor permits and cost indices to time dispositions and advise sellers.
Investors pay up for clear lease-up visibility and trending concessions; tracking permit flows and cost inflation reduces execution risk.
- permits: monitor monthly census permit data
- cost indices: follow ENR/CPI construction indexes
- lease-up: report absorption and concession trends
Inflation and NOI durability
Inflation (US CPI 12‑month +3.3% as of June 2025) pushes operating expenses and lease escalators; multifamily (median lease ~12 months) and self‑storage (tenancies ~6–9 months) reprice far faster than office (typical lease 5–7 years), so NOI durability varies by asset class. Marcus & Millichap can emphasize CPI‑linked clauses and expense pass‑throughs while underwriting stress‑tests margin compression and tax/insurance spikes (commercial insurance rose ~12% in 2024).
- CPI +3.3% (Jun 2025)
- Multifamily lease ~12 months
- Self‑storage tenancy 6–9 months
- Office lease 5–7 years
- Insurance +12% (2024)
- Underwrite with CPI clauses, expense pass‑throughs, margin stress tests
Political risk, tax changes and entitlement delays compress multifamily NOI and deals
Higher policy rates (fed funds 5.25–5.50%, 10y ~4.5% in 2024–25) widened cap rates ~150–200bps, slowing transactions; tight credit and regional bank stress constrain leverage. Strong labor (unemp ~3.8% 2024) supports industrial/retail absorption while office vacancy ~17% depresses values. Inflation CPI +3.3% (Jun 2025) and insurance +12% (2024) raise OPEX and underwriting stress.
| Metric | Value |
|---|---|
| Fed funds | 5.25–5.50% |
| 10‑yr Treasury | ~4.5% |
| CPI (Jun 2025) | +3.3% |
| Unemployment (2024) | ~3.8% |
| Office vacancy (2024) | ~17% |
| Multifamily completions (2024) | ~350k |
What You See Is What You Get
Marcus & Millichap PESTLE Analysis
The Marcus & Millichap PESTLE Analysis preview is the exact, fully formatted document you’ll receive after purchase. It contains the complete, professionally structured analysis with no placeholders or teasers. After checkout you’ll be able to download this same final file immediately.











