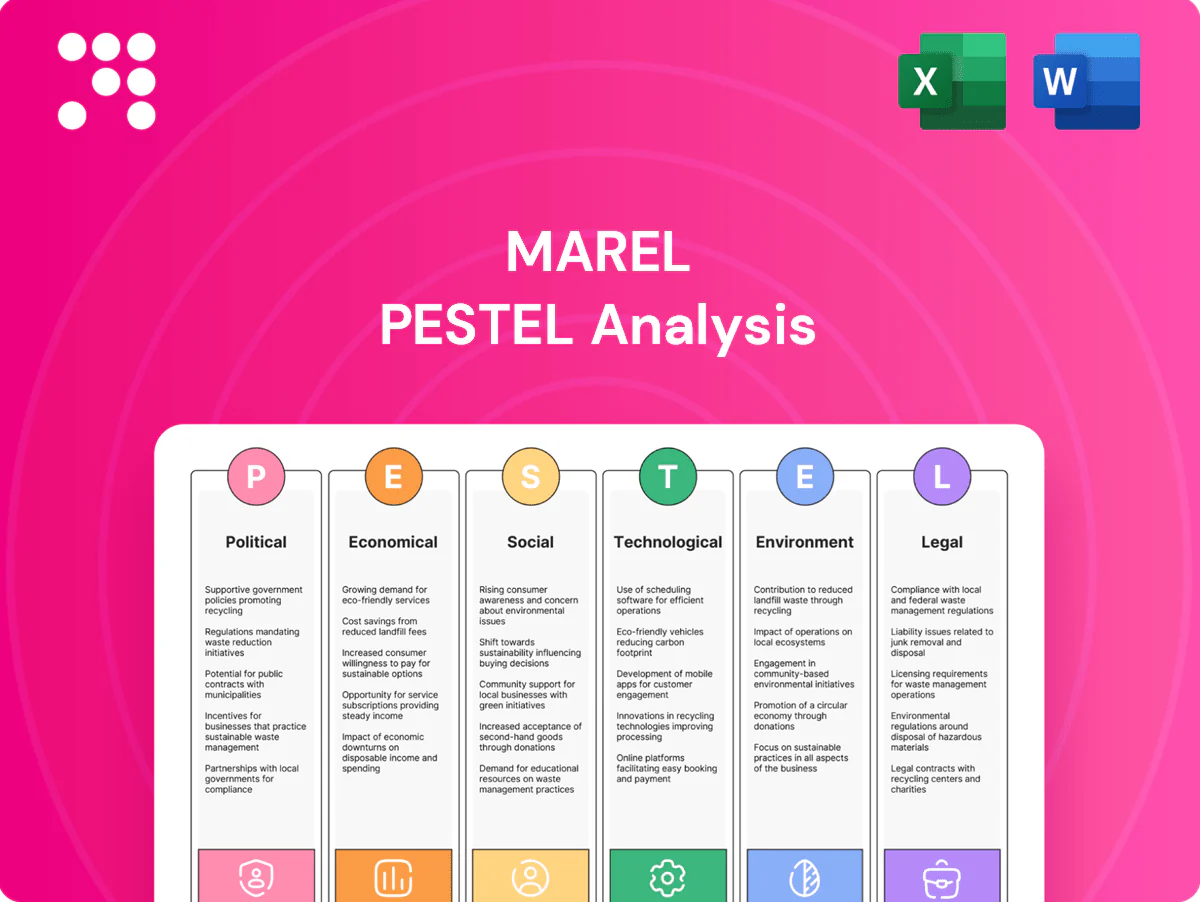
Marel PESTLE Analysis

Skip the Research. Get the Strategy.
Unlock strategic clarity with our targeted PESTLE analysis of Marel—three to five expert-ready insights into how political shifts, economic cycles, and technological advances shape its outlook. This concise, actionable brief is ideal for investors and strategists who need fast, reliable intelligence. Purchase the full PESTLE to access the complete, editable report and start making informed decisions today.
Political factors

Trade policies and tariffs
Changes in trade policy can raise costs for exporting processing equipment and sourcing components; US Section 232 steel tariffs of 25% and aluminum tariffs of 10% can directly inflate input prices. Tariffs on steel, electronics or finished machinery compress pricing and margins and may force Marel to adjust supply chains or localize production. Active monitoring and government relations reduce disruption risk.
Food security agendas
Governments increasingly prioritize resilient, safe food supply chains, boosting demand for automation and traceability solutions that Marel provides. Public incentives and grants accelerate plant modernization and adoption of Marel systems, with the EU Common Agricultural Policy budget of €386.6 billion (2021–2027) signaling large funding pools. Policy shifts toward self-sufficiency drive local processing investments and alignment with national food strategies unlocks tenders and procurement opportunities.

Geopolitical instability
Geopolitical instability since 2022 disrupts logistics, restricts currency access and hinders customer operations, forcing Marel to reroute shipments and delay implementations. Regional demand can pause while others expand, requiring agile reallocation of production and sales resources. Compliance with sanctions regimes alters sales pipelines and service commitments, making regional risk diversification a strategic imperative for continuity.

Public procurement dynamics
State-backed processors and cooperatives often drive large capital orders in food processing, and OECD data show public procurement represents about 12% of GDP and ~29% of public expenditure, making these contracts material to Marel’s addressable market. Tender rules, localization requirements and election cycles shift timing and award criteria, while demonstrable transparency and lifecycle value propositions (lower TCO, longer uptime) increase win rates. Building local partnerships and JV arrangements frequently ease entry, compliance and execution in protected markets.
Subsidies and industrial policy
Green and digital industrial policies (NextGenerationEU €750 billion) drive uptake of energy-efficient smart factories; EU carbon prices near €90/ton in 2024 make efficiency investments more attractive. Grants and tax credits improve automation ROI, but competing vendors also capture incentives, increasing pressure to differentiate. Proactive eligibility mapping helps customers capture subsidies using Marel solutions.
- policy: NextGenerationEU €750bn
- pricing: EU ETS ~€90/ton (2024)
- ROI: grants/tax credits boost payback
- risk: competitors also benefit
- action: eligibility mapping with Marel
Tariffs and green stimulus reshape supply chains, pushing automation amid higher costs
Trade tariffs (US Section 232: steel 25%, aluminium 10%) and sanctions raise input and compliance costs, pressuring margins and supply-chain localization. Public food-security funding and procurement (EU CAP €386.6bn 2021–27; OECD public spend ~29% GDP) and green/digital stimuli (NextGenerationEU €750bn; EU ETS ≈€90/t in 2024) boost automation demand and incentives.
| Item | Key figure |
|---|---|
| US tariffs | Steel 25%, Al 10% |
| EU CAP | €386.6bn (2021–27) |
| NextGenerationEU | €750bn |
| EU ETS price | ≈€90/t (2024) |
| Public spend | ~29% GDP (OECD) |
What is included in the product
 Detailed Word Document
Explores how external macro-environmental factors affect Marel across Political, Economic, Social, Technological, Environmental and Legal dimensions; each section is data-backed, region- and industry-specific, forward-looking and formatted for insertion into business plans, supporting executives, investors and scenario planning.

 Customizable Excel Spreadsheet
Visually segmented by PESTLE categories for rapid insight, the Marel PESTLE Analysis provides a clean, editable summary that’s easily dropped into presentations or shared across teams to streamline risk discussions and strategic alignment.
Economic factors

Capex cycles in food processing
Processors’ investment budgets rise and fall with margins and demand, and many scaled-back capex in 2023–24 as margin pressure intensified. High input costs or weak consumer demand can delay equipment upgrades; global food inflation moderated to roughly 4% in 2024, yet volatility persists. Marel’s counter-cyclical service and retrofit offerings help stabilize revenue, while payback-focused proposals improve deal closure during tighter cycles.
Inflation and input costs
Inflation in 2024 raised component, labor and freight costs, squeezing Marel’s gross margins as input inflation averaged about 3.5%–4.5% in many markets. Price indexing and value-based pricing help protect profitability by passing cost increases to customers. Design-to-cost initiatives and supplier consolidation improve resilience and lower unit costs. With end-customer inflation near 3.5% in 2024, ROI payback expectations tightened, intensifying purchase scrutiny.

Currency volatility
Multi-currency sales and sourcing expose Marel earnings to FX swings across EUR, USD, GBP and emerging market currencies, creating translation and transaction risk. Active hedging programs and natural offsets in receipts and payables help reduce volatility in reported results. Pricing in local currencies can boost competitiveness but transfers FX risk to Marel. Transparent FX clauses and pass-through mechanisms improve customer trust and revenue predictability.

Emerging market growth
Emerging market protein consumption is growing about 2.5% annually, expanding greenfield processing demand that suits Marel's equipment pipeline. Access to local financing and service capacity will be decisive for win share; IMF forecasts EM GDP growth around 4.2% in 2024, supporting investment flows. Modular, scalable systems and partnerships with regional integrators speed penetration while matching capex and infrastructure limits.
- Rising EM protein demand ~2.5% p.a.
- EM GDP ~4.2% (IMF 2024) boosts investment
- Financing & local service capacity key
- Modular systems + regional integrators = faster market share
Consolidation among processors
Consolidation among processors means large integrators now demand standardized, integrated lines across multiple plants; in US beef packing the top four firms accounted for roughly 80% of slaughter capacity in 2023, illustrating buyer concentration and rising bargaining power. Fewer, bigger buyers push for enterprise-wide digital and maintenance agreements as strategic contracts, while strong installed bases and uptime metrics increase customer stickiness and recurring service revenue.
- Buyer concentration: top-4 ~80% (US beef, 2023)
- Higher bargaining power → tougher pricing/service terms
- Enterprise digital/MRO deals become strategic
- Installed base + uptime = revenue stickiness
Tariffs and green stimulus reshape supply chains, pushing automation amid higher costs
Capex was constrained in 2023–24 as processors cut back amid margin pressure; global food inflation eased to ~4% in 2024 while input inflation ran ~3.5–4.5%, tightening ROI expectations. FX exposure across EUR/USD/GBP remains material but hedging and natural offsets limit reported volatility. Emerging markets drive demand (~2.5% p.a.) with IMF 2024 GDP ~4.2%, offering greenfield upside; US beef top-4 ~80% (2023) raises buyer power.
| Metric | 2024 figure | Implication |
|---|---|---|
| Global food inflation | ~4% | moderate demand volatility |
| Input inflation | 3.5–4.5% | margin squeeze |
| EM protein demand | ~2.5% p.a. | equipment growth |
| EM GDP (IMF) | ~4.2% | investment support |
| US beef top-4 | ~80% | high buyer power |
Full Version Awaits
Marel PESTLE Analysis
The preview shown here is the exact Marel PESTLE Analysis you’ll receive after purchase—fully formatted and ready to use. This is the real file with no placeholders or surprises. The layout, content, and structure are identical to the downloadable document. Purchase delivers this exact finished report instantly.

Skip the Research. Get the Strategy.
Unlock strategic clarity with our targeted PESTLE analysis of Marel—three to five expert-ready insights into how political shifts, economic cycles, and technological advances shape its outlook. This concise, actionable brief is ideal for investors and strategists who need fast, reliable intelligence. Purchase the full PESTLE to access the complete, editable report and start making informed decisions today.
Political factors
Trade policies and tariffs
Changes in trade policy can raise costs for exporting processing equipment and sourcing components; US Section 232 steel tariffs of 25% and aluminum tariffs of 10% can directly inflate input prices. Tariffs on steel, electronics or finished machinery compress pricing and margins and may force Marel to adjust supply chains or localize production. Active monitoring and government relations reduce disruption risk.
Food security agendas
Governments increasingly prioritize resilient, safe food supply chains, boosting demand for automation and traceability solutions that Marel provides. Public incentives and grants accelerate plant modernization and adoption of Marel systems, with the EU Common Agricultural Policy budget of €386.6 billion (2021–2027) signaling large funding pools. Policy shifts toward self-sufficiency drive local processing investments and alignment with national food strategies unlocks tenders and procurement opportunities.
Geopolitical instability
Geopolitical instability since 2022 disrupts logistics, restricts currency access and hinders customer operations, forcing Marel to reroute shipments and delay implementations. Regional demand can pause while others expand, requiring agile reallocation of production and sales resources. Compliance with sanctions regimes alters sales pipelines and service commitments, making regional risk diversification a strategic imperative for continuity.
Public procurement dynamics
State-backed processors and cooperatives often drive large capital orders in food processing, and OECD data show public procurement represents about 12% of GDP and ~29% of public expenditure, making these contracts material to Marel’s addressable market. Tender rules, localization requirements and election cycles shift timing and award criteria, while demonstrable transparency and lifecycle value propositions (lower TCO, longer uptime) increase win rates. Building local partnerships and JV arrangements frequently ease entry, compliance and execution in protected markets.
Subsidies and industrial policy
Green and digital industrial policies (NextGenerationEU €750 billion) drive uptake of energy-efficient smart factories; EU carbon prices near €90/ton in 2024 make efficiency investments more attractive. Grants and tax credits improve automation ROI, but competing vendors also capture incentives, increasing pressure to differentiate. Proactive eligibility mapping helps customers capture subsidies using Marel solutions.
- policy: NextGenerationEU €750bn
- pricing: EU ETS ~€90/ton (2024)
- ROI: grants/tax credits boost payback
- risk: competitors also benefit
- action: eligibility mapping with Marel
Tariffs and green stimulus reshape supply chains, pushing automation amid higher costs
Trade tariffs (US Section 232: steel 25%, aluminium 10%) and sanctions raise input and compliance costs, pressuring margins and supply-chain localization. Public food-security funding and procurement (EU CAP €386.6bn 2021–27; OECD public spend ~29% GDP) and green/digital stimuli (NextGenerationEU €750bn; EU ETS ≈€90/t in 2024) boost automation demand and incentives.
| Item | Key figure |
|---|---|
| US tariffs | Steel 25%, Al 10% |
| EU CAP | €386.6bn (2021–27) |
| NextGenerationEU | €750bn |
| EU ETS price | ≈€90/t (2024) |
| Public spend | ~29% GDP (OECD) |
What is included in the product
Detailed Word Document
Explores how external macro-environmental factors affect Marel across Political, Economic, Social, Technological, Environmental and Legal dimensions; each section is data-backed, region- and industry-specific, forward-looking and formatted for insertion into business plans, supporting executives, investors and scenario planning.
Customizable Excel Spreadsheet
Visually segmented by PESTLE categories for rapid insight, the Marel PESTLE Analysis provides a clean, editable summary that’s easily dropped into presentations or shared across teams to streamline risk discussions and strategic alignment.
Economic factors
Capex cycles in food processing
Processors’ investment budgets rise and fall with margins and demand, and many scaled-back capex in 2023–24 as margin pressure intensified. High input costs or weak consumer demand can delay equipment upgrades; global food inflation moderated to roughly 4% in 2024, yet volatility persists. Marel’s counter-cyclical service and retrofit offerings help stabilize revenue, while payback-focused proposals improve deal closure during tighter cycles.
Inflation and input costs
Inflation in 2024 raised component, labor and freight costs, squeezing Marel’s gross margins as input inflation averaged about 3.5%–4.5% in many markets. Price indexing and value-based pricing help protect profitability by passing cost increases to customers. Design-to-cost initiatives and supplier consolidation improve resilience and lower unit costs. With end-customer inflation near 3.5% in 2024, ROI payback expectations tightened, intensifying purchase scrutiny.
Currency volatility
Multi-currency sales and sourcing expose Marel earnings to FX swings across EUR, USD, GBP and emerging market currencies, creating translation and transaction risk. Active hedging programs and natural offsets in receipts and payables help reduce volatility in reported results. Pricing in local currencies can boost competitiveness but transfers FX risk to Marel. Transparent FX clauses and pass-through mechanisms improve customer trust and revenue predictability.
Emerging market growth
Emerging market protein consumption is growing about 2.5% annually, expanding greenfield processing demand that suits Marel's equipment pipeline. Access to local financing and service capacity will be decisive for win share; IMF forecasts EM GDP growth around 4.2% in 2024, supporting investment flows. Modular, scalable systems and partnerships with regional integrators speed penetration while matching capex and infrastructure limits.
- Rising EM protein demand ~2.5% p.a.
- EM GDP ~4.2% (IMF 2024) boosts investment
- Financing & local service capacity key
- Modular systems + regional integrators = faster market share
Consolidation among processors
Consolidation among processors means large integrators now demand standardized, integrated lines across multiple plants; in US beef packing the top four firms accounted for roughly 80% of slaughter capacity in 2023, illustrating buyer concentration and rising bargaining power. Fewer, bigger buyers push for enterprise-wide digital and maintenance agreements as strategic contracts, while strong installed bases and uptime metrics increase customer stickiness and recurring service revenue.
- Buyer concentration: top-4 ~80% (US beef, 2023)
- Higher bargaining power → tougher pricing/service terms
- Enterprise digital/MRO deals become strategic
- Installed base + uptime = revenue stickiness
Tariffs and green stimulus reshape supply chains, pushing automation amid higher costs
Capex was constrained in 2023–24 as processors cut back amid margin pressure; global food inflation eased to ~4% in 2024 while input inflation ran ~3.5–4.5%, tightening ROI expectations. FX exposure across EUR/USD/GBP remains material but hedging and natural offsets limit reported volatility. Emerging markets drive demand (~2.5% p.a.) with IMF 2024 GDP ~4.2%, offering greenfield upside; US beef top-4 ~80% (2023) raises buyer power.
| Metric | 2024 figure | Implication |
|---|---|---|
| Global food inflation | ~4% | moderate demand volatility |
| Input inflation | 3.5–4.5% | margin squeeze |
| EM protein demand | ~2.5% p.a. | equipment growth |
| EM GDP (IMF) | ~4.2% | investment support |
| US beef top-4 | ~80% | high buyer power |
Full Version Awaits
Marel PESTLE Analysis
The preview shown here is the exact Marel PESTLE Analysis you’ll receive after purchase—fully formatted and ready to use. This is the real file with no placeholders or surprises. The layout, content, and structure are identical to the downloadable document. Purchase delivers this exact finished report instantly.
Original: $10.00
-65%$10.00
$3.50Description
Skip the Research. Get the Strategy.
Unlock strategic clarity with our targeted PESTLE analysis of Marel—three to five expert-ready insights into how political shifts, economic cycles, and technological advances shape its outlook. This concise, actionable brief is ideal for investors and strategists who need fast, reliable intelligence. Purchase the full PESTLE to access the complete, editable report and start making informed decisions today.
Political factors
Trade policies and tariffs
Changes in trade policy can raise costs for exporting processing equipment and sourcing components; US Section 232 steel tariffs of 25% and aluminum tariffs of 10% can directly inflate input prices. Tariffs on steel, electronics or finished machinery compress pricing and margins and may force Marel to adjust supply chains or localize production. Active monitoring and government relations reduce disruption risk.
Food security agendas
Governments increasingly prioritize resilient, safe food supply chains, boosting demand for automation and traceability solutions that Marel provides. Public incentives and grants accelerate plant modernization and adoption of Marel systems, with the EU Common Agricultural Policy budget of €386.6 billion (2021–2027) signaling large funding pools. Policy shifts toward self-sufficiency drive local processing investments and alignment with national food strategies unlocks tenders and procurement opportunities.
Geopolitical instability
Geopolitical instability since 2022 disrupts logistics, restricts currency access and hinders customer operations, forcing Marel to reroute shipments and delay implementations. Regional demand can pause while others expand, requiring agile reallocation of production and sales resources. Compliance with sanctions regimes alters sales pipelines and service commitments, making regional risk diversification a strategic imperative for continuity.
Public procurement dynamics
State-backed processors and cooperatives often drive large capital orders in food processing, and OECD data show public procurement represents about 12% of GDP and ~29% of public expenditure, making these contracts material to Marel’s addressable market. Tender rules, localization requirements and election cycles shift timing and award criteria, while demonstrable transparency and lifecycle value propositions (lower TCO, longer uptime) increase win rates. Building local partnerships and JV arrangements frequently ease entry, compliance and execution in protected markets.
Subsidies and industrial policy
Green and digital industrial policies (NextGenerationEU €750 billion) drive uptake of energy-efficient smart factories; EU carbon prices near €90/ton in 2024 make efficiency investments more attractive. Grants and tax credits improve automation ROI, but competing vendors also capture incentives, increasing pressure to differentiate. Proactive eligibility mapping helps customers capture subsidies using Marel solutions.
- policy: NextGenerationEU €750bn
- pricing: EU ETS ~€90/ton (2024)
- ROI: grants/tax credits boost payback
- risk: competitors also benefit
- action: eligibility mapping with Marel
Tariffs and green stimulus reshape supply chains, pushing automation amid higher costs
Trade tariffs (US Section 232: steel 25%, aluminium 10%) and sanctions raise input and compliance costs, pressuring margins and supply-chain localization. Public food-security funding and procurement (EU CAP €386.6bn 2021–27; OECD public spend ~29% GDP) and green/digital stimuli (NextGenerationEU €750bn; EU ETS ≈€90/t in 2024) boost automation demand and incentives.
| Item | Key figure |
|---|---|
| US tariffs | Steel 25%, Al 10% |
| EU CAP | €386.6bn (2021–27) |
| NextGenerationEU | €750bn |
| EU ETS price | ≈€90/t (2024) |
| Public spend | ~29% GDP (OECD) |
What is included in the product
Detailed Word Document
Explores how external macro-environmental factors affect Marel across Political, Economic, Social, Technological, Environmental and Legal dimensions; each section is data-backed, region- and industry-specific, forward-looking and formatted for insertion into business plans, supporting executives, investors and scenario planning.
Customizable Excel Spreadsheet
Visually segmented by PESTLE categories for rapid insight, the Marel PESTLE Analysis provides a clean, editable summary that’s easily dropped into presentations or shared across teams to streamline risk discussions and strategic alignment.
Economic factors
Capex cycles in food processing
Processors’ investment budgets rise and fall with margins and demand, and many scaled-back capex in 2023–24 as margin pressure intensified. High input costs or weak consumer demand can delay equipment upgrades; global food inflation moderated to roughly 4% in 2024, yet volatility persists. Marel’s counter-cyclical service and retrofit offerings help stabilize revenue, while payback-focused proposals improve deal closure during tighter cycles.
Inflation and input costs
Inflation in 2024 raised component, labor and freight costs, squeezing Marel’s gross margins as input inflation averaged about 3.5%–4.5% in many markets. Price indexing and value-based pricing help protect profitability by passing cost increases to customers. Design-to-cost initiatives and supplier consolidation improve resilience and lower unit costs. With end-customer inflation near 3.5% in 2024, ROI payback expectations tightened, intensifying purchase scrutiny.
Currency volatility
Multi-currency sales and sourcing expose Marel earnings to FX swings across EUR, USD, GBP and emerging market currencies, creating translation and transaction risk. Active hedging programs and natural offsets in receipts and payables help reduce volatility in reported results. Pricing in local currencies can boost competitiveness but transfers FX risk to Marel. Transparent FX clauses and pass-through mechanisms improve customer trust and revenue predictability.
Emerging market growth
Emerging market protein consumption is growing about 2.5% annually, expanding greenfield processing demand that suits Marel's equipment pipeline. Access to local financing and service capacity will be decisive for win share; IMF forecasts EM GDP growth around 4.2% in 2024, supporting investment flows. Modular, scalable systems and partnerships with regional integrators speed penetration while matching capex and infrastructure limits.
- Rising EM protein demand ~2.5% p.a.
- EM GDP ~4.2% (IMF 2024) boosts investment
- Financing & local service capacity key
- Modular systems + regional integrators = faster market share
Consolidation among processors
Consolidation among processors means large integrators now demand standardized, integrated lines across multiple plants; in US beef packing the top four firms accounted for roughly 80% of slaughter capacity in 2023, illustrating buyer concentration and rising bargaining power. Fewer, bigger buyers push for enterprise-wide digital and maintenance agreements as strategic contracts, while strong installed bases and uptime metrics increase customer stickiness and recurring service revenue.
- Buyer concentration: top-4 ~80% (US beef, 2023)
- Higher bargaining power → tougher pricing/service terms
- Enterprise digital/MRO deals become strategic
- Installed base + uptime = revenue stickiness
Tariffs and green stimulus reshape supply chains, pushing automation amid higher costs
Capex was constrained in 2023–24 as processors cut back amid margin pressure; global food inflation eased to ~4% in 2024 while input inflation ran ~3.5–4.5%, tightening ROI expectations. FX exposure across EUR/USD/GBP remains material but hedging and natural offsets limit reported volatility. Emerging markets drive demand (~2.5% p.a.) with IMF 2024 GDP ~4.2%, offering greenfield upside; US beef top-4 ~80% (2023) raises buyer power.
| Metric | 2024 figure | Implication |
|---|---|---|
| Global food inflation | ~4% | moderate demand volatility |
| Input inflation | 3.5–4.5% | margin squeeze |
| EM protein demand | ~2.5% p.a. | equipment growth |
| EM GDP (IMF) | ~4.2% | investment support |
| US beef top-4 | ~80% | high buyer power |
Full Version Awaits
Marel PESTLE Analysis
The preview shown here is the exact Marel PESTLE Analysis you’ll receive after purchase—fully formatted and ready to use. This is the real file with no placeholders or surprises. The layout, content, and structure are identical to the downloadable document. Purchase delivers this exact finished report instantly.











