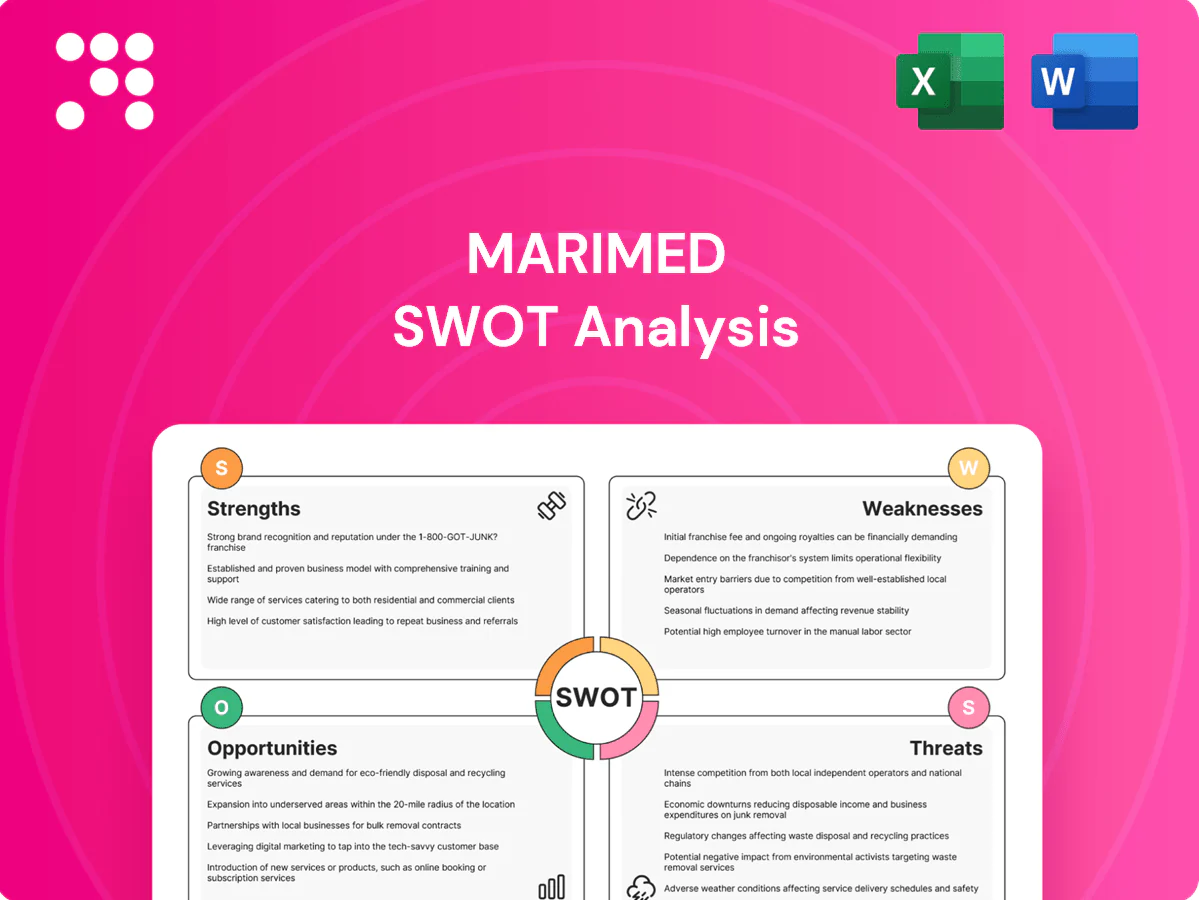
MariMed SWOT Analysis

Your Strategic Toolkit Starts Here
MariMed's SWOT highlights proven branded products and regulated-market access, balanced against competitive pressure and regulatory risk. Our full SWOT unpacks financials, market positioning, and strategic options with editable Word and Excel deliverables. Purchase the complete report to turn insight into actionable strategy for investors, advisors, and operators.
Strengths

End-to-end vertical integration
Seed-to-sale control lets MariMed ensure consistent quality, traceability, and capture margins across cultivation, processing and retail, supporting SKU optimization and faster feedback from dispensaries to cultivators. Integrated ops can boost inventory turns and yield efficiency; U.S. legal cannabis sales exceeded $28B in 2023, highlighting scale opportunity. This structure creates operating leverage as volumes scale, improving gross margins and cash flow predictability.
Multi-state operating footprint
Presence in 10+ licensed states reduces regulatory and demand risk, enabling cross-market learning and shared operational playbooks that lower per-unit costs. A multi-state footprint boosts purchasing power with suppliers and supports brand portability and wholesale placement across hundreds of dispensaries. This geographic scale increases strategic optionality as individual state markets and regulations evolve.

Operational track record
MariMed’s operational track record reduces execution risk through extensive experience developing and managing cannabis cultivation, manufacturing and retail operations. Established SOPs across cultivation, manufacturing and retail improve product consistency and regulatory compliance. Proven project delivery has supported timely store openings and capacity ramp-ups, enhancing credibility for licensing approvals and local partnerships.

Quality-focused product positioning
Quality-focused product positioning sustains pricing power and brand loyalty, enabling MariMed to command premiums even as value-tier pressure rises; U.S. legal cannabis sales topped roughly $26 billion in 2023, supporting growing demand for premium offerings. Quality credentials and rigorous third-party testing facilitate entry into medical-dominant markets and differentiate in crowded adult-use channels.
- Sustains pricing power
- Defends vs price compression
- Supports medical market entry
- Differentiates in adult-use
Compliance and licensing expertise
Operating state-licensed facilities demonstrates MariMed’s strength in regulatory navigation, reducing risk of fines, shutdowns, or license issues and enhancing credibility in competitive application processes; this expertise also supports smoother audits and faster expansion approvals.
Seed-to-sale control boosts quality, margins across 10+ states
Seed-to-sale control drives consistent quality, traceability and margin capture across cultivation, processing and retail, enabling SKU optimization and faster feedback loops. Multi-state presence (10+ licensed states) spreads regulatory risk and boosts purchasing scale. Proven operations and compliance record lower execution risk and support faster approvals.
| Metric | Value |
|---|---|
| US legal sales (2023) | $28B |
| States operated | 10+ |
What is included in the product
 Detailed Word Document
Provides a concise SWOT overview of MariMed’s internal capabilities and external market forces, outlining strengths, weaknesses, opportunities and threats to its growth, competitive position, and regulatory exposure.

 Customizable Excel Spreadsheet
Provides a focused MariMed SWOT matrix to quickly surface regulatory, market, and operational risks and opportunities, enabling fast alignment and decision-making for leadership.
Weaknesses

Exposure to fragmented regulations
Operating across a fragmented US market (38 states with medical programs, 23 with adult-use as of 2025) forces duplicative systems tailored to differing rules, raising overhead. Compliance complexity increases costs and slows speed to market, eroding margins in a ~$30 billion 2023 legal market. Product SKUs and packaging often require state-specific variants, diluting scale benefits versus federally legal industries.
Capital intensity and cash needs
Building cultivation and processing capacity requires significant capital expenditures, and MariMed faces high upfront capex to scale operations.
Working capital remains tied up in biological assets and inventories, lengthening cash conversion cycles and pressuring liquidity.
Limited access to traditional banking and higher-cost financing can raise funding costs and constrain growth relative to larger, better-capitalized peers.

Scale disadvantage vs. Tier-1 MSOs
Smaller footprint limits MariMed's bargaining power and brand reach compared with Tier-1 MSOs, many of which reported >$1 billion in revenue in 2024, enabling deeper supplier discounts and national retail presence. National marketing and multi-state wholesale penetration are harder to match, constraining scale-driven customer acquisition. Higher SG&A and compliance costs per unit at smaller scale can compress margins and amplify downside in industry downcycles.

Sensitivity to price compression
Sensitivity to price compression: wholesale oversupply in several states has pressured flower and distillate pricing, increasing margin risk. If MariMed’s product mix skews toward flower, earnings volatility rises as wholesale prices fluctuate. Retail competition and promotional pressure can erode profitability and require ongoing investment to sustain premium positioning.
- Wholesale oversupply
- Flower-heavy mix = higher margin volatility
- Retail promotions compress margins
- Continuous investment to maintain premium
Tax and accounting burden (e.g., 280E)
Federal 280E prevents deducting ordinary business expenses for plant-touching cannabis firms, often inflating effective federal cash tax rates; industry reports commonly cite effective rates in the 40–80% range versus ~25–30% for non-cannabis peers. Limited deductibility compresses free cash flow, forcing complex tax structures that raise administrative costs; during rapid growth, cash taxes can exceed accounting profit, straining liquidity.
- Higher effective tax rates: industry 40–80%
- Reduced free cash flow: lower reinvestment capacity
- Added admin costs: complex mitigation structures
- Liquidity risk: cash taxes can outpace accounting profit
38/23-state footprint and 280E (40–80%) tax squeeze margins in a $30B market
Operating across 38 medical and 23 adult-use states (2025) raises compliance overhead and SKU fragmentation, eroding scale in a ~$30B 2023 legal market. High capex and tied-up inventory lengthen cash cycles and limit liquidity, while limited banking and smaller footprint vs Tier-1 peers (> $1B revenue in 2024) constrain growth. 280E boosts effective tax rates to ~40–80%, compressing free cash flow.
| Metric | Value |
|---|---|
| States (medical / adult-use, 2025) | 38 / 23 |
| Legal market (2023) | $30B |
| Tier-1 revenue (2024) | > $1B |
| Effective tax rate (280E) | 40–80% |
Preview Before You Purchase
MariMed SWOT Analysis
This is the actual MariMed SWOT analysis document you’ll receive upon purchase—no surprises, just professional quality. The preview below is taken directly from the full SWOT report you'll get, and the complete, editable version is unlocked after checkout. Purchase to download the full, detailed analysis ready for use.

Your Strategic Toolkit Starts Here
MariMed's SWOT highlights proven branded products and regulated-market access, balanced against competitive pressure and regulatory risk. Our full SWOT unpacks financials, market positioning, and strategic options with editable Word and Excel deliverables. Purchase the complete report to turn insight into actionable strategy for investors, advisors, and operators.
Strengths
End-to-end vertical integration
Seed-to-sale control lets MariMed ensure consistent quality, traceability, and capture margins across cultivation, processing and retail, supporting SKU optimization and faster feedback from dispensaries to cultivators. Integrated ops can boost inventory turns and yield efficiency; U.S. legal cannabis sales exceeded $28B in 2023, highlighting scale opportunity. This structure creates operating leverage as volumes scale, improving gross margins and cash flow predictability.
Multi-state operating footprint
Presence in 10+ licensed states reduces regulatory and demand risk, enabling cross-market learning and shared operational playbooks that lower per-unit costs. A multi-state footprint boosts purchasing power with suppliers and supports brand portability and wholesale placement across hundreds of dispensaries. This geographic scale increases strategic optionality as individual state markets and regulations evolve.
Operational track record
MariMed’s operational track record reduces execution risk through extensive experience developing and managing cannabis cultivation, manufacturing and retail operations. Established SOPs across cultivation, manufacturing and retail improve product consistency and regulatory compliance. Proven project delivery has supported timely store openings and capacity ramp-ups, enhancing credibility for licensing approvals and local partnerships.
Quality-focused product positioning
Quality-focused product positioning sustains pricing power and brand loyalty, enabling MariMed to command premiums even as value-tier pressure rises; U.S. legal cannabis sales topped roughly $26 billion in 2023, supporting growing demand for premium offerings. Quality credentials and rigorous third-party testing facilitate entry into medical-dominant markets and differentiate in crowded adult-use channels.
- Sustains pricing power
- Defends vs price compression
- Supports medical market entry
- Differentiates in adult-use
Compliance and licensing expertise
Operating state-licensed facilities demonstrates MariMed’s strength in regulatory navigation, reducing risk of fines, shutdowns, or license issues and enhancing credibility in competitive application processes; this expertise also supports smoother audits and faster expansion approvals.
Seed-to-sale control boosts quality, margins across 10+ states
Seed-to-sale control drives consistent quality, traceability and margin capture across cultivation, processing and retail, enabling SKU optimization and faster feedback loops. Multi-state presence (10+ licensed states) spreads regulatory risk and boosts purchasing scale. Proven operations and compliance record lower execution risk and support faster approvals.
| Metric | Value |
|---|---|
| US legal sales (2023) | $28B |
| States operated | 10+ |
What is included in the product
Detailed Word Document
Provides a concise SWOT overview of MariMed’s internal capabilities and external market forces, outlining strengths, weaknesses, opportunities and threats to its growth, competitive position, and regulatory exposure.
Customizable Excel Spreadsheet
Provides a focused MariMed SWOT matrix to quickly surface regulatory, market, and operational risks and opportunities, enabling fast alignment and decision-making for leadership.
Weaknesses
Exposure to fragmented regulations
Operating across a fragmented US market (38 states with medical programs, 23 with adult-use as of 2025) forces duplicative systems tailored to differing rules, raising overhead. Compliance complexity increases costs and slows speed to market, eroding margins in a ~$30 billion 2023 legal market. Product SKUs and packaging often require state-specific variants, diluting scale benefits versus federally legal industries.
Capital intensity and cash needs
Building cultivation and processing capacity requires significant capital expenditures, and MariMed faces high upfront capex to scale operations.
Working capital remains tied up in biological assets and inventories, lengthening cash conversion cycles and pressuring liquidity.
Limited access to traditional banking and higher-cost financing can raise funding costs and constrain growth relative to larger, better-capitalized peers.
Scale disadvantage vs. Tier-1 MSOs
Smaller footprint limits MariMed's bargaining power and brand reach compared with Tier-1 MSOs, many of which reported >$1 billion in revenue in 2024, enabling deeper supplier discounts and national retail presence. National marketing and multi-state wholesale penetration are harder to match, constraining scale-driven customer acquisition. Higher SG&A and compliance costs per unit at smaller scale can compress margins and amplify downside in industry downcycles.
Sensitivity to price compression
Sensitivity to price compression: wholesale oversupply in several states has pressured flower and distillate pricing, increasing margin risk. If MariMed’s product mix skews toward flower, earnings volatility rises as wholesale prices fluctuate. Retail competition and promotional pressure can erode profitability and require ongoing investment to sustain premium positioning.
- Wholesale oversupply
- Flower-heavy mix = higher margin volatility
- Retail promotions compress margins
- Continuous investment to maintain premium
Tax and accounting burden (e.g., 280E)
Federal 280E prevents deducting ordinary business expenses for plant-touching cannabis firms, often inflating effective federal cash tax rates; industry reports commonly cite effective rates in the 40–80% range versus ~25–30% for non-cannabis peers. Limited deductibility compresses free cash flow, forcing complex tax structures that raise administrative costs; during rapid growth, cash taxes can exceed accounting profit, straining liquidity.
- Higher effective tax rates: industry 40–80%
- Reduced free cash flow: lower reinvestment capacity
- Added admin costs: complex mitigation structures
- Liquidity risk: cash taxes can outpace accounting profit
38/23-state footprint and 280E (40–80%) tax squeeze margins in a $30B market
Operating across 38 medical and 23 adult-use states (2025) raises compliance overhead and SKU fragmentation, eroding scale in a ~$30B 2023 legal market. High capex and tied-up inventory lengthen cash cycles and limit liquidity, while limited banking and smaller footprint vs Tier-1 peers (> $1B revenue in 2024) constrain growth. 280E boosts effective tax rates to ~40–80%, compressing free cash flow.
| Metric | Value |
|---|---|
| States (medical / adult-use, 2025) | 38 / 23 |
| Legal market (2023) | $30B |
| Tier-1 revenue (2024) | > $1B |
| Effective tax rate (280E) | 40–80% |
Preview Before You Purchase
MariMed SWOT Analysis
This is the actual MariMed SWOT analysis document you’ll receive upon purchase—no surprises, just professional quality. The preview below is taken directly from the full SWOT report you'll get, and the complete, editable version is unlocked after checkout. Purchase to download the full, detailed analysis ready for use.
Original: $10.00
-65%$10.00
$3.50Description
Your Strategic Toolkit Starts Here
MariMed's SWOT highlights proven branded products and regulated-market access, balanced against competitive pressure and regulatory risk. Our full SWOT unpacks financials, market positioning, and strategic options with editable Word and Excel deliverables. Purchase the complete report to turn insight into actionable strategy for investors, advisors, and operators.
Strengths
End-to-end vertical integration
Seed-to-sale control lets MariMed ensure consistent quality, traceability, and capture margins across cultivation, processing and retail, supporting SKU optimization and faster feedback from dispensaries to cultivators. Integrated ops can boost inventory turns and yield efficiency; U.S. legal cannabis sales exceeded $28B in 2023, highlighting scale opportunity. This structure creates operating leverage as volumes scale, improving gross margins and cash flow predictability.
Multi-state operating footprint
Presence in 10+ licensed states reduces regulatory and demand risk, enabling cross-market learning and shared operational playbooks that lower per-unit costs. A multi-state footprint boosts purchasing power with suppliers and supports brand portability and wholesale placement across hundreds of dispensaries. This geographic scale increases strategic optionality as individual state markets and regulations evolve.
Operational track record
MariMed’s operational track record reduces execution risk through extensive experience developing and managing cannabis cultivation, manufacturing and retail operations. Established SOPs across cultivation, manufacturing and retail improve product consistency and regulatory compliance. Proven project delivery has supported timely store openings and capacity ramp-ups, enhancing credibility for licensing approvals and local partnerships.
Quality-focused product positioning
Quality-focused product positioning sustains pricing power and brand loyalty, enabling MariMed to command premiums even as value-tier pressure rises; U.S. legal cannabis sales topped roughly $26 billion in 2023, supporting growing demand for premium offerings. Quality credentials and rigorous third-party testing facilitate entry into medical-dominant markets and differentiate in crowded adult-use channels.
- Sustains pricing power
- Defends vs price compression
- Supports medical market entry
- Differentiates in adult-use
Compliance and licensing expertise
Operating state-licensed facilities demonstrates MariMed’s strength in regulatory navigation, reducing risk of fines, shutdowns, or license issues and enhancing credibility in competitive application processes; this expertise also supports smoother audits and faster expansion approvals.
Seed-to-sale control boosts quality, margins across 10+ states
Seed-to-sale control drives consistent quality, traceability and margin capture across cultivation, processing and retail, enabling SKU optimization and faster feedback loops. Multi-state presence (10+ licensed states) spreads regulatory risk and boosts purchasing scale. Proven operations and compliance record lower execution risk and support faster approvals.
| Metric | Value |
|---|---|
| US legal sales (2023) | $28B |
| States operated | 10+ |
What is included in the product
Detailed Word Document
Provides a concise SWOT overview of MariMed’s internal capabilities and external market forces, outlining strengths, weaknesses, opportunities and threats to its growth, competitive position, and regulatory exposure.
Customizable Excel Spreadsheet
Provides a focused MariMed SWOT matrix to quickly surface regulatory, market, and operational risks and opportunities, enabling fast alignment and decision-making for leadership.
Weaknesses
Exposure to fragmented regulations
Operating across a fragmented US market (38 states with medical programs, 23 with adult-use as of 2025) forces duplicative systems tailored to differing rules, raising overhead. Compliance complexity increases costs and slows speed to market, eroding margins in a ~$30 billion 2023 legal market. Product SKUs and packaging often require state-specific variants, diluting scale benefits versus federally legal industries.
Capital intensity and cash needs
Building cultivation and processing capacity requires significant capital expenditures, and MariMed faces high upfront capex to scale operations.
Working capital remains tied up in biological assets and inventories, lengthening cash conversion cycles and pressuring liquidity.
Limited access to traditional banking and higher-cost financing can raise funding costs and constrain growth relative to larger, better-capitalized peers.
Scale disadvantage vs. Tier-1 MSOs
Smaller footprint limits MariMed's bargaining power and brand reach compared with Tier-1 MSOs, many of which reported >$1 billion in revenue in 2024, enabling deeper supplier discounts and national retail presence. National marketing and multi-state wholesale penetration are harder to match, constraining scale-driven customer acquisition. Higher SG&A and compliance costs per unit at smaller scale can compress margins and amplify downside in industry downcycles.
Sensitivity to price compression
Sensitivity to price compression: wholesale oversupply in several states has pressured flower and distillate pricing, increasing margin risk. If MariMed’s product mix skews toward flower, earnings volatility rises as wholesale prices fluctuate. Retail competition and promotional pressure can erode profitability and require ongoing investment to sustain premium positioning.
- Wholesale oversupply
- Flower-heavy mix = higher margin volatility
- Retail promotions compress margins
- Continuous investment to maintain premium
Tax and accounting burden (e.g., 280E)
Federal 280E prevents deducting ordinary business expenses for plant-touching cannabis firms, often inflating effective federal cash tax rates; industry reports commonly cite effective rates in the 40–80% range versus ~25–30% for non-cannabis peers. Limited deductibility compresses free cash flow, forcing complex tax structures that raise administrative costs; during rapid growth, cash taxes can exceed accounting profit, straining liquidity.
- Higher effective tax rates: industry 40–80%
- Reduced free cash flow: lower reinvestment capacity
- Added admin costs: complex mitigation structures
- Liquidity risk: cash taxes can outpace accounting profit
38/23-state footprint and 280E (40–80%) tax squeeze margins in a $30B market
Operating across 38 medical and 23 adult-use states (2025) raises compliance overhead and SKU fragmentation, eroding scale in a ~$30B 2023 legal market. High capex and tied-up inventory lengthen cash cycles and limit liquidity, while limited banking and smaller footprint vs Tier-1 peers (> $1B revenue in 2024) constrain growth. 280E boosts effective tax rates to ~40–80%, compressing free cash flow.
| Metric | Value |
|---|---|
| States (medical / adult-use, 2025) | 38 / 23 |
| Legal market (2023) | $30B |
| Tier-1 revenue (2024) | > $1B |
| Effective tax rate (280E) | 40–80% |
Preview Before You Purchase
MariMed SWOT Analysis
This is the actual MariMed SWOT analysis document you’ll receive upon purchase—no surprises, just professional quality. The preview below is taken directly from the full SWOT report you'll get, and the complete, editable version is unlocked after checkout. Purchase to download the full, detailed analysis ready for use.











