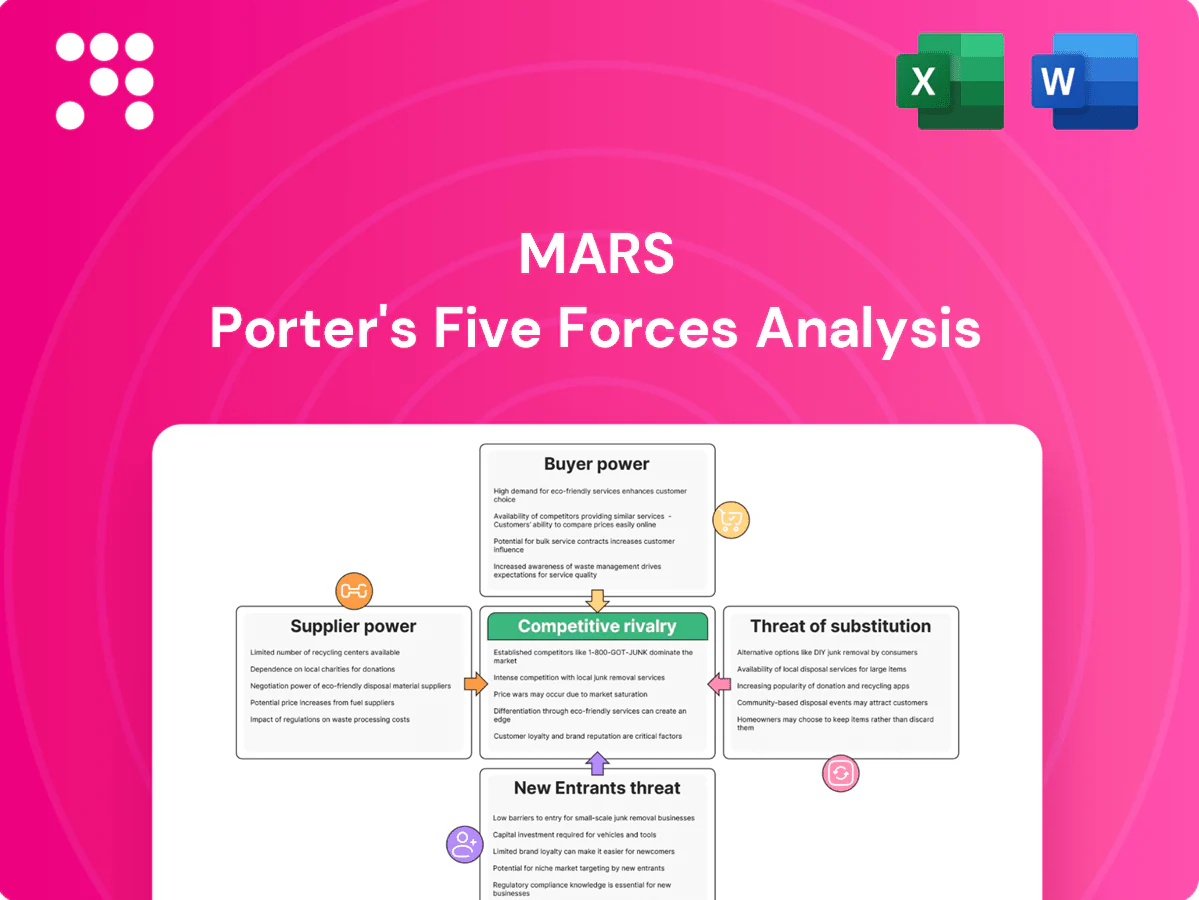
Mars Porter's Five Forces Analysis

A Must-Have Tool for Decision-Makers
Mars faces moderate buyer power, high supplier reliance for commodities, intense rivalry across confectionery and petcare, and evolving threats from private-label substitutes and health trends. Regulatory and sustainability pressures shape entry barriers and supplier bargaining. This snapshot highlights strategic levers and risks for investors and managers. Unlock the full Porter's Five Forces Analysis for force-by-force ratings, visuals, and actionable insights.
Suppliers Bargaining Power

Global commodity exposure
Mars relies on core inputs—cocoa, sugar, dairy, grains and proteins—exposing it to volatile commodity markets; Ivory Coast and Ghana supply about 60% of world cocoa, concentrating risk. Weather, geopolitics and supply-chain shocks can tighten supply and lift costs. Hedging and long-term contracts dampen volatility but cannot eliminate spikes. Supplier power increases sharply during tight commodity cycles.
Scale-driven bargaining leverage
Mars’s scale—operating in over 80 countries with roughly 140,000 employees—gives strong negotiating leverage with ingredient and packaging suppliers. Multi-year, multi-region contracts and vendor consolidation drive unit-cost reductions and risk pooling. Preferred-supplier programs and SRM tools raise compliance and service levels, and aggregate volumes offset individual supplier power across most input categories.

Packaging and specialty inputs
Resins (eg SABIC, LyondellBasell), aluminum foil (eg Novelis) and specialty flavors/colors (Givaudan ~25% market share in 2023) have relatively few qualified sources, raising supplier power for Mars. Switching is costly and slow—qualification and regulatory approvals commonly take 6–12 months and can require multi-hundred-thousand-dollar testing programs. Supply disruptions or price spikes (eg 2021–24 commodity volatility) give suppliers temporary leverage, while dual-sourcing and inventory buffers partially mitigate risk.

ESG and traceability requirements
ESG and traceability mandates for cocoa — deforestation-free sourcing and improved labor standards — shrink the viable supplier base, forcing Mars to coordinate more with certified farms and cooperatives; certified cocoa often commands a 10–20% premium in 2024 spot markets, increasing input cost pressure while strengthening compliant suppliers’ bargaining power.
- Cocoa sustainability narrows suppliers
- Deforestation-free rules raise compliance costs
- Certified supply carries premiums (≈10–20% 2024)
- Mars programs boost resilience but lift input costs
Logistics and energy dependencies
Freight, cold-chain requirements and energy together drove delivered cost volatility for Mars in 2024: fuel represented about 10% of logistics costs and global container spot rates fell roughly 40% year-on-year in 2024 after pandemic peaks, but fuel spikes and port congestion can quickly shift bargaining power to carriers and cold-chain specialists. Diversified carrier networks and long-term contracts reduced exposure, though systemic shocks (e.g., severe fuel spikes) can temporarily elevate supplier power.
- Freight volatility: container rates down ~40% Y/Y (2024)
- Energy share: fuel ≈10% of logistics cost (2024)
- Mitigation: diversification + long-term contracts
- Risk: port congestion/fuel spikes = transient supplier leverage
Cocoa concentrated in Ivory Coast and Ghana: 60% supply raises supplier risk
Mars depends on cocoa, sugar, dairy and packaging; Ivory Coast and Ghana supply ~60% of cocoa, concentrating risk and raising supplier leverage during tight cycles. Scale and multi-year contracts lower supplier power, but specialty suppliers (Givaudan ~25% share 2023) and ESG-certified cocoa (premium ≈10–20% in 2024) increase costs and supplier clout.
| Metric | 2024 |
|---|---|
| Cocoa share (Ivory Coast+Ghana) | ~60% |
| Certified cocoa premium | ≈10–20% |
| Container rates Y/Y | −40% |
| Fuel share logistics | ≈10% |
What is included in the product
 Detailed Word Document
Comprehensive Porter’s Five Forces analysis tailored exclusively for Mars, assessing competitive rivalry, supplier and buyer power, substitute threats, and entry barriers to reveal pricing pressures and strategic vulnerabilities, delivered in editable Word format for easy integration into reports and presentations.

 Customizable Excel Spreadsheet
Concise Mars Porter's Five Forces one-sheet highlighting competitive pressures and relief strategies—ready to drop into decks; interactive sliders model scenarios and instantly reveal strategic pain points and mitigation options.
Customers Bargaining Power

Concentrated retail channels
Mass retailers, grocers and pet specialty chains control shelf space and terms: the top four US grocery retailers account for roughly 60% of grocery sales in 2024, giving buyers leverage over Mars on pricing, placement and trade spend. Large accounts typically drive trade spend of ~15% of net sales and demand slotting fees (commonly $50k–$100k per SKU), pressuring margins. Losing a top retailer can cut volumes by 20–30% for specific SKUs.
Strong brand equity
Iconic Mars brands like M&M's, Snickers and Pedigree cut price sensitivity, underpinned by Mars' roughly $45 billion annual sales (2023), allowing pricing flexibility without major volume loss. Strong brand loyalty and habitual purchases curb switching for many consumers. Premiumization in pet food — premium SKUs growing ~8% in 2023 and comprising ~40% of US dog food value sales — further weakens buyer bargaining power.

E-commerce and D2C dynamics
Online marketplaces increase price transparency—e-commerce accounted for about 22% of global retail sales in 2024—making products highly comparable and amplifying buyer price sensitivity. Subscription models in pet care can lock customers but typically require discounts and elevated service levels to keep churn low. D2C data sharpens targeting but shifts fulfillment costs to Mars, while platforms gain leverage through algorithms and placement fees.

Private label and challenger brands
Retailer private-label penetration rose to about 17% of grocery sales in 2024, offering cheaper alternatives that increase buyer leverage; challenger brands in natural and functional niches grew near 8% in 2024, expanding consumer choice and switching risk for Mars. Mars must accelerate innovation and clear product differentiation to defend price points and leverage category leadership to secure favorable planograms.
- private-label ~17% (2024)
- natural/functional growth ~8% (2024)
- focus: innovation, differentiation, planogram leverage
Health and value sensitivity
Consumers shift between indulgence, health, and value as macro conditions change; confectionery is highly discretionary and promo-responsive while pet food shows higher loyalty but remains exposed to value pressure. Trade-down risk rises in downturns, increasing buyer power; pack-price architecture and revenue management (mix, promotions) help defend margins. Global confectionery ~196 billion USD (2024).
- confectionery discretionary — 196B USD (2024)
- pet care stickier — 136B USD (2024)
- promo sensitivity rises in downturns
Grocer consolidation drives risk - 60% share, 22% e-commerce, 15% trade spend
Top-4 US grocers account for ~60% of grocery sales (2024), driving trade spend ~15% of net sales and slotting fees $50k–$100k; losing a major retailer can cut SKU volumes 20–30%. Mars' brands and ~$45B sales (2023) plus pet premium growth ~8% (2023) cushion price pressure. E-commerce ~22% of retail (2024) and private-label ~17% (2024) increase transparency and switching risk.
| Metric | Value |
|---|---|
| Top-4 grocery share | ~60% (2024) |
| Mars sales | $45B (2023) |
| Trade spend | ~15% net sales |
| Private-label | ~17% (2024) |
What You See Is What You Get
Mars Porter's Five Forces Analysis
This preview shows the exact Mars Porter’s Five Forces Analysis you'll receive after purchase—no placeholders or samples. The file is the full, professionally formatted document ready for immediate download and use. What you see here is precisely what will be delivered upon payment.

A Must-Have Tool for Decision-Makers
Mars faces moderate buyer power, high supplier reliance for commodities, intense rivalry across confectionery and petcare, and evolving threats from private-label substitutes and health trends. Regulatory and sustainability pressures shape entry barriers and supplier bargaining. This snapshot highlights strategic levers and risks for investors and managers. Unlock the full Porter's Five Forces Analysis for force-by-force ratings, visuals, and actionable insights.
Suppliers Bargaining Power
Global commodity exposure
Mars relies on core inputs—cocoa, sugar, dairy, grains and proteins—exposing it to volatile commodity markets; Ivory Coast and Ghana supply about 60% of world cocoa, concentrating risk. Weather, geopolitics and supply-chain shocks can tighten supply and lift costs. Hedging and long-term contracts dampen volatility but cannot eliminate spikes. Supplier power increases sharply during tight commodity cycles.
Scale-driven bargaining leverage
Mars’s scale—operating in over 80 countries with roughly 140,000 employees—gives strong negotiating leverage with ingredient and packaging suppliers. Multi-year, multi-region contracts and vendor consolidation drive unit-cost reductions and risk pooling. Preferred-supplier programs and SRM tools raise compliance and service levels, and aggregate volumes offset individual supplier power across most input categories.
Packaging and specialty inputs
Resins (eg SABIC, LyondellBasell), aluminum foil (eg Novelis) and specialty flavors/colors (Givaudan ~25% market share in 2023) have relatively few qualified sources, raising supplier power for Mars. Switching is costly and slow—qualification and regulatory approvals commonly take 6–12 months and can require multi-hundred-thousand-dollar testing programs. Supply disruptions or price spikes (eg 2021–24 commodity volatility) give suppliers temporary leverage, while dual-sourcing and inventory buffers partially mitigate risk.
ESG and traceability requirements
ESG and traceability mandates for cocoa — deforestation-free sourcing and improved labor standards — shrink the viable supplier base, forcing Mars to coordinate more with certified farms and cooperatives; certified cocoa often commands a 10–20% premium in 2024 spot markets, increasing input cost pressure while strengthening compliant suppliers’ bargaining power.
- Cocoa sustainability narrows suppliers
- Deforestation-free rules raise compliance costs
- Certified supply carries premiums (≈10–20% 2024)
- Mars programs boost resilience but lift input costs
Logistics and energy dependencies
Freight, cold-chain requirements and energy together drove delivered cost volatility for Mars in 2024: fuel represented about 10% of logistics costs and global container spot rates fell roughly 40% year-on-year in 2024 after pandemic peaks, but fuel spikes and port congestion can quickly shift bargaining power to carriers and cold-chain specialists. Diversified carrier networks and long-term contracts reduced exposure, though systemic shocks (e.g., severe fuel spikes) can temporarily elevate supplier power.
- Freight volatility: container rates down ~40% Y/Y (2024)
- Energy share: fuel ≈10% of logistics cost (2024)
- Mitigation: diversification + long-term contracts
- Risk: port congestion/fuel spikes = transient supplier leverage
Cocoa concentrated in Ivory Coast and Ghana: 60% supply raises supplier risk
Mars depends on cocoa, sugar, dairy and packaging; Ivory Coast and Ghana supply ~60% of cocoa, concentrating risk and raising supplier leverage during tight cycles. Scale and multi-year contracts lower supplier power, but specialty suppliers (Givaudan ~25% share 2023) and ESG-certified cocoa (premium ≈10–20% in 2024) increase costs and supplier clout.
| Metric | 2024 |
|---|---|
| Cocoa share (Ivory Coast+Ghana) | ~60% |
| Certified cocoa premium | ≈10–20% |
| Container rates Y/Y | −40% |
| Fuel share logistics | ≈10% |
What is included in the product
Detailed Word Document
Comprehensive Porter’s Five Forces analysis tailored exclusively for Mars, assessing competitive rivalry, supplier and buyer power, substitute threats, and entry barriers to reveal pricing pressures and strategic vulnerabilities, delivered in editable Word format for easy integration into reports and presentations.
Customizable Excel Spreadsheet
Concise Mars Porter's Five Forces one-sheet highlighting competitive pressures and relief strategies—ready to drop into decks; interactive sliders model scenarios and instantly reveal strategic pain points and mitigation options.
Customers Bargaining Power
Concentrated retail channels
Mass retailers, grocers and pet specialty chains control shelf space and terms: the top four US grocery retailers account for roughly 60% of grocery sales in 2024, giving buyers leverage over Mars on pricing, placement and trade spend. Large accounts typically drive trade spend of ~15% of net sales and demand slotting fees (commonly $50k–$100k per SKU), pressuring margins. Losing a top retailer can cut volumes by 20–30% for specific SKUs.
Strong brand equity
Iconic Mars brands like M&M's, Snickers and Pedigree cut price sensitivity, underpinned by Mars' roughly $45 billion annual sales (2023), allowing pricing flexibility without major volume loss. Strong brand loyalty and habitual purchases curb switching for many consumers. Premiumization in pet food — premium SKUs growing ~8% in 2023 and comprising ~40% of US dog food value sales — further weakens buyer bargaining power.
E-commerce and D2C dynamics
Online marketplaces increase price transparency—e-commerce accounted for about 22% of global retail sales in 2024—making products highly comparable and amplifying buyer price sensitivity. Subscription models in pet care can lock customers but typically require discounts and elevated service levels to keep churn low. D2C data sharpens targeting but shifts fulfillment costs to Mars, while platforms gain leverage through algorithms and placement fees.
Private label and challenger brands
Retailer private-label penetration rose to about 17% of grocery sales in 2024, offering cheaper alternatives that increase buyer leverage; challenger brands in natural and functional niches grew near 8% in 2024, expanding consumer choice and switching risk for Mars. Mars must accelerate innovation and clear product differentiation to defend price points and leverage category leadership to secure favorable planograms.
- private-label ~17% (2024)
- natural/functional growth ~8% (2024)
- focus: innovation, differentiation, planogram leverage
Health and value sensitivity
Consumers shift between indulgence, health, and value as macro conditions change; confectionery is highly discretionary and promo-responsive while pet food shows higher loyalty but remains exposed to value pressure. Trade-down risk rises in downturns, increasing buyer power; pack-price architecture and revenue management (mix, promotions) help defend margins. Global confectionery ~196 billion USD (2024).
- confectionery discretionary — 196B USD (2024)
- pet care stickier — 136B USD (2024)
- promo sensitivity rises in downturns
Grocer consolidation drives risk - 60% share, 22% e-commerce, 15% trade spend
Top-4 US grocers account for ~60% of grocery sales (2024), driving trade spend ~15% of net sales and slotting fees $50k–$100k; losing a major retailer can cut SKU volumes 20–30%. Mars' brands and ~$45B sales (2023) plus pet premium growth ~8% (2023) cushion price pressure. E-commerce ~22% of retail (2024) and private-label ~17% (2024) increase transparency and switching risk.
| Metric | Value |
|---|---|
| Top-4 grocery share | ~60% (2024) |
| Mars sales | $45B (2023) |
| Trade spend | ~15% net sales |
| Private-label | ~17% (2024) |
What You See Is What You Get
Mars Porter's Five Forces Analysis
This preview shows the exact Mars Porter’s Five Forces Analysis you'll receive after purchase—no placeholders or samples. The file is the full, professionally formatted document ready for immediate download and use. What you see here is precisely what will be delivered upon payment.
Original: $10.00
-65%$10.00
$3.50Description
A Must-Have Tool for Decision-Makers
Mars faces moderate buyer power, high supplier reliance for commodities, intense rivalry across confectionery and petcare, and evolving threats from private-label substitutes and health trends. Regulatory and sustainability pressures shape entry barriers and supplier bargaining. This snapshot highlights strategic levers and risks for investors and managers. Unlock the full Porter's Five Forces Analysis for force-by-force ratings, visuals, and actionable insights.
Suppliers Bargaining Power
Global commodity exposure
Mars relies on core inputs—cocoa, sugar, dairy, grains and proteins—exposing it to volatile commodity markets; Ivory Coast and Ghana supply about 60% of world cocoa, concentrating risk. Weather, geopolitics and supply-chain shocks can tighten supply and lift costs. Hedging and long-term contracts dampen volatility but cannot eliminate spikes. Supplier power increases sharply during tight commodity cycles.
Scale-driven bargaining leverage
Mars’s scale—operating in over 80 countries with roughly 140,000 employees—gives strong negotiating leverage with ingredient and packaging suppliers. Multi-year, multi-region contracts and vendor consolidation drive unit-cost reductions and risk pooling. Preferred-supplier programs and SRM tools raise compliance and service levels, and aggregate volumes offset individual supplier power across most input categories.
Packaging and specialty inputs
Resins (eg SABIC, LyondellBasell), aluminum foil (eg Novelis) and specialty flavors/colors (Givaudan ~25% market share in 2023) have relatively few qualified sources, raising supplier power for Mars. Switching is costly and slow—qualification and regulatory approvals commonly take 6–12 months and can require multi-hundred-thousand-dollar testing programs. Supply disruptions or price spikes (eg 2021–24 commodity volatility) give suppliers temporary leverage, while dual-sourcing and inventory buffers partially mitigate risk.
ESG and traceability requirements
ESG and traceability mandates for cocoa — deforestation-free sourcing and improved labor standards — shrink the viable supplier base, forcing Mars to coordinate more with certified farms and cooperatives; certified cocoa often commands a 10–20% premium in 2024 spot markets, increasing input cost pressure while strengthening compliant suppliers’ bargaining power.
- Cocoa sustainability narrows suppliers
- Deforestation-free rules raise compliance costs
- Certified supply carries premiums (≈10–20% 2024)
- Mars programs boost resilience but lift input costs
Logistics and energy dependencies
Freight, cold-chain requirements and energy together drove delivered cost volatility for Mars in 2024: fuel represented about 10% of logistics costs and global container spot rates fell roughly 40% year-on-year in 2024 after pandemic peaks, but fuel spikes and port congestion can quickly shift bargaining power to carriers and cold-chain specialists. Diversified carrier networks and long-term contracts reduced exposure, though systemic shocks (e.g., severe fuel spikes) can temporarily elevate supplier power.
- Freight volatility: container rates down ~40% Y/Y (2024)
- Energy share: fuel ≈10% of logistics cost (2024)
- Mitigation: diversification + long-term contracts
- Risk: port congestion/fuel spikes = transient supplier leverage
Cocoa concentrated in Ivory Coast and Ghana: 60% supply raises supplier risk
Mars depends on cocoa, sugar, dairy and packaging; Ivory Coast and Ghana supply ~60% of cocoa, concentrating risk and raising supplier leverage during tight cycles. Scale and multi-year contracts lower supplier power, but specialty suppliers (Givaudan ~25% share 2023) and ESG-certified cocoa (premium ≈10–20% in 2024) increase costs and supplier clout.
| Metric | 2024 |
|---|---|
| Cocoa share (Ivory Coast+Ghana) | ~60% |
| Certified cocoa premium | ≈10–20% |
| Container rates Y/Y | −40% |
| Fuel share logistics | ≈10% |
What is included in the product
Detailed Word Document
Comprehensive Porter’s Five Forces analysis tailored exclusively for Mars, assessing competitive rivalry, supplier and buyer power, substitute threats, and entry barriers to reveal pricing pressures and strategic vulnerabilities, delivered in editable Word format for easy integration into reports and presentations.
Customizable Excel Spreadsheet
Concise Mars Porter's Five Forces one-sheet highlighting competitive pressures and relief strategies—ready to drop into decks; interactive sliders model scenarios and instantly reveal strategic pain points and mitigation options.
Customers Bargaining Power
Concentrated retail channels
Mass retailers, grocers and pet specialty chains control shelf space and terms: the top four US grocery retailers account for roughly 60% of grocery sales in 2024, giving buyers leverage over Mars on pricing, placement and trade spend. Large accounts typically drive trade spend of ~15% of net sales and demand slotting fees (commonly $50k–$100k per SKU), pressuring margins. Losing a top retailer can cut volumes by 20–30% for specific SKUs.
Strong brand equity
Iconic Mars brands like M&M's, Snickers and Pedigree cut price sensitivity, underpinned by Mars' roughly $45 billion annual sales (2023), allowing pricing flexibility without major volume loss. Strong brand loyalty and habitual purchases curb switching for many consumers. Premiumization in pet food — premium SKUs growing ~8% in 2023 and comprising ~40% of US dog food value sales — further weakens buyer bargaining power.
E-commerce and D2C dynamics
Online marketplaces increase price transparency—e-commerce accounted for about 22% of global retail sales in 2024—making products highly comparable and amplifying buyer price sensitivity. Subscription models in pet care can lock customers but typically require discounts and elevated service levels to keep churn low. D2C data sharpens targeting but shifts fulfillment costs to Mars, while platforms gain leverage through algorithms and placement fees.
Private label and challenger brands
Retailer private-label penetration rose to about 17% of grocery sales in 2024, offering cheaper alternatives that increase buyer leverage; challenger brands in natural and functional niches grew near 8% in 2024, expanding consumer choice and switching risk for Mars. Mars must accelerate innovation and clear product differentiation to defend price points and leverage category leadership to secure favorable planograms.
- private-label ~17% (2024)
- natural/functional growth ~8% (2024)
- focus: innovation, differentiation, planogram leverage
Health and value sensitivity
Consumers shift between indulgence, health, and value as macro conditions change; confectionery is highly discretionary and promo-responsive while pet food shows higher loyalty but remains exposed to value pressure. Trade-down risk rises in downturns, increasing buyer power; pack-price architecture and revenue management (mix, promotions) help defend margins. Global confectionery ~196 billion USD (2024).
- confectionery discretionary — 196B USD (2024)
- pet care stickier — 136B USD (2024)
- promo sensitivity rises in downturns
Grocer consolidation drives risk - 60% share, 22% e-commerce, 15% trade spend
Top-4 US grocers account for ~60% of grocery sales (2024), driving trade spend ~15% of net sales and slotting fees $50k–$100k; losing a major retailer can cut SKU volumes 20–30%. Mars' brands and ~$45B sales (2023) plus pet premium growth ~8% (2023) cushion price pressure. E-commerce ~22% of retail (2024) and private-label ~17% (2024) increase transparency and switching risk.
| Metric | Value |
|---|---|
| Top-4 grocery share | ~60% (2024) |
| Mars sales | $45B (2023) |
| Trade spend | ~15% net sales |
| Private-label | ~17% (2024) |
What You See Is What You Get
Mars Porter's Five Forces Analysis
This preview shows the exact Mars Porter’s Five Forces Analysis you'll receive after purchase—no placeholders or samples. The file is the full, professionally formatted document ready for immediate download and use. What you see here is precisely what will be delivered upon payment.











