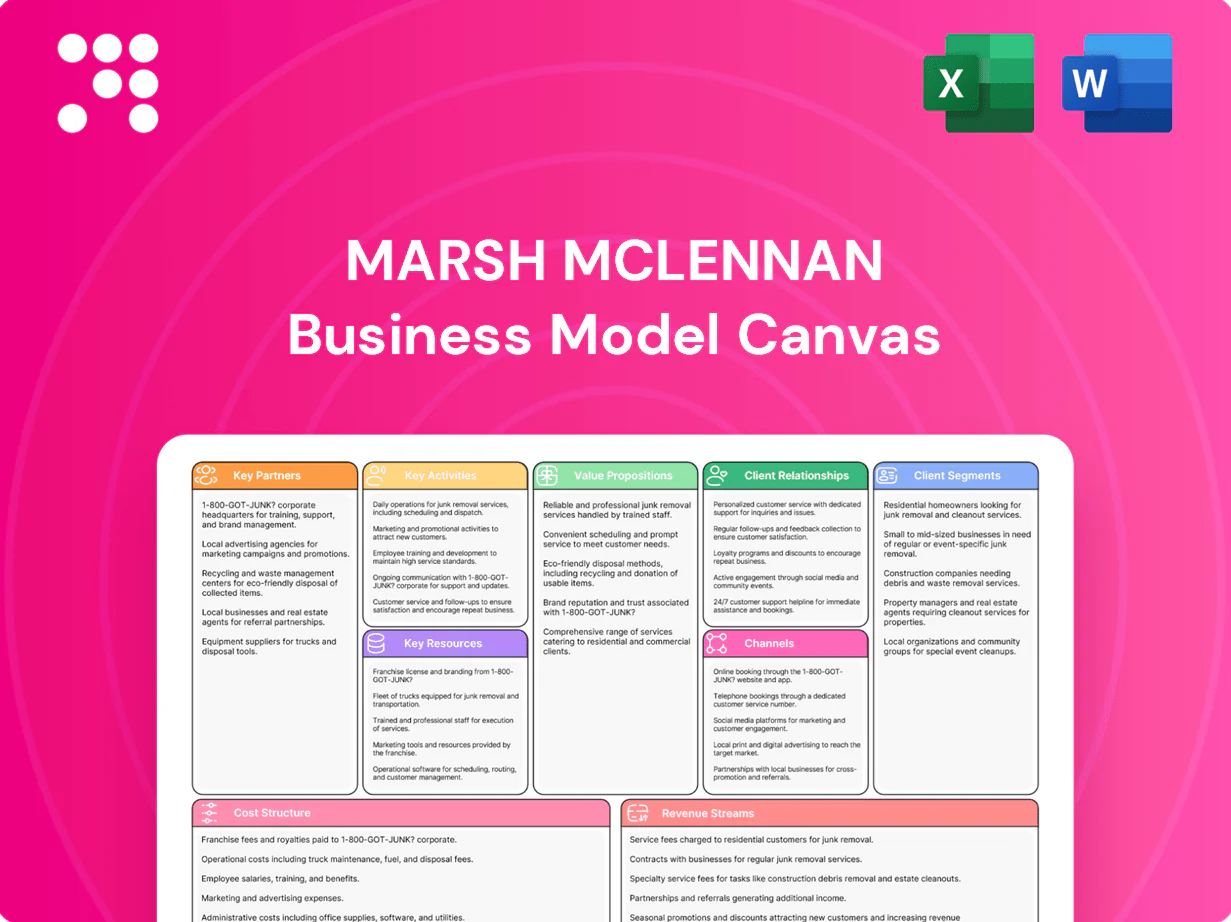
Marsh McLennan Business Model Canvas

Unlock strategic Business Model Canvas: value props, segments, partnerships, revenue
Unlock Marsh McLennan's strategic blueprint with our concise Business Model Canvas overview. Explore its value propositions, customer segments, key partnerships and revenue mechanics to see how the firm scales and sustains competitive advantage. Download the full, editable Canvas in Word and Excel for benchmarking, investor decks, or strategic planning.
Partnerships

Global insurers and reinsurers
Carrier relationships enable competitive placement, capacity access, and tailored policy structures across lines and geographies, leveraging Marsh McLennan’s global reach in 130+ countries (2024). Deep panels with specialty markets improve terms, conditions, and claims responsiveness for complex exposures. Multi-year relationships underpin captives and parametric covers, while joint innovation with carriers accelerates product development.
Capital markets and alternative risk providers
Partnerships with ILS funds, banks and pension investors expand Marsh McLennan’s reinsurance and risk-transfer toolkit, tapping over $100 billion of ILS capital and roughly $17 billion of cat bond issuance in 2023 to support structured solutions. These channels enable balance-sheet optimization and lower clients’ cost of risk through diversified capital sources. Collaboration also strengthens capital advisory and portfolio resilience for large sponsors and insurers.

Data, analytics, and technology vendors
Third-party data sources, modeling tools and cloud platforms power Marsh McLennan’s risk quantification and insights, with Flexera 2024 noting roughly 70% of enterprise workloads in the cloud. Partnerships boost speed, accuracy and scalability of analytics, reducing time-to-insight across teams. Deep integrations enable richer client portals, benchmarking and scenario testing, while joint roadmaps keep capabilities current and differentiated.

Healthcare, benefits, and HR-tech ecosystems
Ties with carriers, PBMs, providers and HR platforms optimize benefits design and cost containment, with the three largest PBMs handling roughly 80% of U.S. prescription claims (2024). Ecosystem partners enable digital enrollment, wellbeing and analytics, improving employee experience and employer ROI. Co-developed solutions accelerate adoption and deliver measurable outcomes.
- Carrier/PBM/provider integration
- Digital enrollment & analytics
- Wellbeing & ROI focus
Industry bodies and regulatory stakeholders
Engagement with regulators and industry associations informs Marsh McLennan’s compliance and market practice, leveraging its 2024 reach across 130+ countries and ~88,000 employees to align standards globally. Participation helps shape resilience frameworks and disclosure norms, giving clients early visibility into rule changes that reduces firm and client risk. Sustained thought leadership strengthens credibility and advocacy with policymakers.
- Regulatory engagement: global 130+ countries presence
- Scale: ~88,000 employees (2024)
130+ countries, $100B+ ILS capital, cloud-first analytics
Carrier, ILS and reinsurer ties secure capacity and tailored programs across 130+ countries and ~88,000 employees (2024), leveraging $100B+ ILS capital and $17B cat bond market (2023). Tech, data and cloud partners (≈70% workloads in cloud, 2024) accelerate analytics and client portals. PBM/provider integrations (top 3 PBMs ≈80% US claims, 2024) cut benefits cost and improve outcomes.
| Partner | Metric |
|---|---|
| Carriers | 130+ countries |
| ILS/Markets | $100B capital |
| Cloud/Data | ≈70% workloads |
What is included in the product
 Detailed Word Document
A comprehensive Business Model Canvas for Marsh McLennan detailing customer segments, value propositions, channels, revenue streams, key activities, partners, resources, cost structure and customer relationships across risk & insurance broking, consulting and analytics. Designed for presentations, investor discussions and strategic planning with insights on competitive advantages and market positioning.

 Customizable Excel Spreadsheet
High-level, editable one-page snapshot of Marsh McLennan’s business model that quickly identifies core components and relieves analysis bottlenecks for teams and advisors.
Activities

Insurance and reinsurance broking
Designing, marketing, and placing P&C and specialty risk programs is core, tailored across industries and geographies; Marsh McLennan operated in 130+ countries in 2024. Negotiation secures pricing, coverage breadth, and service levels with market leverage and analytics. Reinsurance structuring aligns retention, volatility, and capital goals via treaty and facultative solutions. Ongoing stewardship maintains program performance and alignment through regular reviews and claims advocacy.
Risk advisory and analytics
Quantifying exposures with models, benchmarks and scenarios drives decision-making, using inputs such as Swiss Re sigma’s ~USD100bn insured natural catastrophe losses in 2023 to stress-test portfolios and price risk.
Enterprise risk, cyber, climate and supply-chain analytics translate scenario outputs into strategic priorities, with cyber insurance market growth and supply-chain disruption metrics guiding controls and transfer strategies.
Captive feasibility and optimization analyses enhance capital efficiency by modeling retained loss distributions and capital requirements, and those insights feed program design and board reporting for transparent governance.

Health, wealth, and talent consulting
Benefits strategy, actuarial and brokerage services at Marsh McLennan drive cost containment and better outcomes through data-driven modeling and risk transfer. Investment advisory and delegated solutions support retirement plans and institutions with fiduciary oversight and scalable portfolio management. Workforce strategy, rewards and transformation programs lift performance and retention. Administration and managed services deliver continuity and scale across 130+ countries with ~85,000 employees (2024).

Strategy and management consulting
Marsh McLennan delivers end-to-end strategy, operations and digital transformation to boost client competitiveness, leveraging a global network in 130+ countries and ~85,000 employees (2024). Sector experts run growth, pricing and cost programs while risk-informed strategy links resilience to value creation, with implementation focused on measurable impact and KPI-driven outcomes.
Claims advocacy and client servicing
Proactive claims advocacy and client servicing at Marsh McLennan ensure regulatory compliance, seamless renewals, and change management across 130+ countries; centralized claims support accelerates recovery and improves outcomes while continuous monitoring adjusts programs to evolving risks. Client education builds capability and trust, leveraging a global platform of over 85,000 professionals in 2024.
- Compliance & renewals
- Claims acceleration
- Continuous monitoring
- Client education & trust
Global P&C, reinsurance and captive solutions across 130+ countries with ~85,000 experts
Designing, placing and managing P&C, specialty, benefits and advisory solutions across 130+ countries using analytics and market negotiation. Reinsurance structuring, captive optimization and claims advocacy align capital, volatility and recovery. Digital transformation, actuarial modeling and client services leverage ~85,000 professionals (2024) and nat-cat stress inputs (Swiss Re sigma ~USD100bn 2023).
| Metric | Value |
|---|---|
| Countries | 130+ |
| Employees (2024) | ~85,000 |
| Nat‑cat insured losses (2023) | ~USD100bn |
Full Document Unlocks After Purchase
Business Model Canvas
The Marsh McLennan Business Model Canvas you see here is the actual deliverable, not a mockup; it represents the same file you will receive after purchase. When you complete your order, you’ll get this identical Business Model Canvas formatted and ready-to-edit. The final download includes the full document in Word and Excel, with all content and pages included.

Unlock strategic Business Model Canvas: value props, segments, partnerships, revenue
Unlock Marsh McLennan's strategic blueprint with our concise Business Model Canvas overview. Explore its value propositions, customer segments, key partnerships and revenue mechanics to see how the firm scales and sustains competitive advantage. Download the full, editable Canvas in Word and Excel for benchmarking, investor decks, or strategic planning.
Partnerships
Global insurers and reinsurers
Carrier relationships enable competitive placement, capacity access, and tailored policy structures across lines and geographies, leveraging Marsh McLennan’s global reach in 130+ countries (2024). Deep panels with specialty markets improve terms, conditions, and claims responsiveness for complex exposures. Multi-year relationships underpin captives and parametric covers, while joint innovation with carriers accelerates product development.
Capital markets and alternative risk providers
Partnerships with ILS funds, banks and pension investors expand Marsh McLennan’s reinsurance and risk-transfer toolkit, tapping over $100 billion of ILS capital and roughly $17 billion of cat bond issuance in 2023 to support structured solutions. These channels enable balance-sheet optimization and lower clients’ cost of risk through diversified capital sources. Collaboration also strengthens capital advisory and portfolio resilience for large sponsors and insurers.
Data, analytics, and technology vendors
Third-party data sources, modeling tools and cloud platforms power Marsh McLennan’s risk quantification and insights, with Flexera 2024 noting roughly 70% of enterprise workloads in the cloud. Partnerships boost speed, accuracy and scalability of analytics, reducing time-to-insight across teams. Deep integrations enable richer client portals, benchmarking and scenario testing, while joint roadmaps keep capabilities current and differentiated.
Healthcare, benefits, and HR-tech ecosystems
Ties with carriers, PBMs, providers and HR platforms optimize benefits design and cost containment, with the three largest PBMs handling roughly 80% of U.S. prescription claims (2024). Ecosystem partners enable digital enrollment, wellbeing and analytics, improving employee experience and employer ROI. Co-developed solutions accelerate adoption and deliver measurable outcomes.
- Carrier/PBM/provider integration
- Digital enrollment & analytics
- Wellbeing & ROI focus
Industry bodies and regulatory stakeholders
Engagement with regulators and industry associations informs Marsh McLennan’s compliance and market practice, leveraging its 2024 reach across 130+ countries and ~88,000 employees to align standards globally. Participation helps shape resilience frameworks and disclosure norms, giving clients early visibility into rule changes that reduces firm and client risk. Sustained thought leadership strengthens credibility and advocacy with policymakers.
- Regulatory engagement: global 130+ countries presence
- Scale: ~88,000 employees (2024)
130+ countries, $100B+ ILS capital, cloud-first analytics
Carrier, ILS and reinsurer ties secure capacity and tailored programs across 130+ countries and ~88,000 employees (2024), leveraging $100B+ ILS capital and $17B cat bond market (2023). Tech, data and cloud partners (≈70% workloads in cloud, 2024) accelerate analytics and client portals. PBM/provider integrations (top 3 PBMs ≈80% US claims, 2024) cut benefits cost and improve outcomes.
| Partner | Metric |
|---|---|
| Carriers | 130+ countries |
| ILS/Markets | $100B capital |
| Cloud/Data | ≈70% workloads |
What is included in the product
Detailed Word Document
A comprehensive Business Model Canvas for Marsh McLennan detailing customer segments, value propositions, channels, revenue streams, key activities, partners, resources, cost structure and customer relationships across risk & insurance broking, consulting and analytics. Designed for presentations, investor discussions and strategic planning with insights on competitive advantages and market positioning.
Customizable Excel Spreadsheet
High-level, editable one-page snapshot of Marsh McLennan’s business model that quickly identifies core components and relieves analysis bottlenecks for teams and advisors.
Activities
Insurance and reinsurance broking
Designing, marketing, and placing P&C and specialty risk programs is core, tailored across industries and geographies; Marsh McLennan operated in 130+ countries in 2024. Negotiation secures pricing, coverage breadth, and service levels with market leverage and analytics. Reinsurance structuring aligns retention, volatility, and capital goals via treaty and facultative solutions. Ongoing stewardship maintains program performance and alignment through regular reviews and claims advocacy.
Risk advisory and analytics
Quantifying exposures with models, benchmarks and scenarios drives decision-making, using inputs such as Swiss Re sigma’s ~USD100bn insured natural catastrophe losses in 2023 to stress-test portfolios and price risk.
Enterprise risk, cyber, climate and supply-chain analytics translate scenario outputs into strategic priorities, with cyber insurance market growth and supply-chain disruption metrics guiding controls and transfer strategies.
Captive feasibility and optimization analyses enhance capital efficiency by modeling retained loss distributions and capital requirements, and those insights feed program design and board reporting for transparent governance.
Health, wealth, and talent consulting
Benefits strategy, actuarial and brokerage services at Marsh McLennan drive cost containment and better outcomes through data-driven modeling and risk transfer. Investment advisory and delegated solutions support retirement plans and institutions with fiduciary oversight and scalable portfolio management. Workforce strategy, rewards and transformation programs lift performance and retention. Administration and managed services deliver continuity and scale across 130+ countries with ~85,000 employees (2024).
Strategy and management consulting
Marsh McLennan delivers end-to-end strategy, operations and digital transformation to boost client competitiveness, leveraging a global network in 130+ countries and ~85,000 employees (2024). Sector experts run growth, pricing and cost programs while risk-informed strategy links resilience to value creation, with implementation focused on measurable impact and KPI-driven outcomes.
Claims advocacy and client servicing
Proactive claims advocacy and client servicing at Marsh McLennan ensure regulatory compliance, seamless renewals, and change management across 130+ countries; centralized claims support accelerates recovery and improves outcomes while continuous monitoring adjusts programs to evolving risks. Client education builds capability and trust, leveraging a global platform of over 85,000 professionals in 2024.
- Compliance & renewals
- Claims acceleration
- Continuous monitoring
- Client education & trust
Global P&C, reinsurance and captive solutions across 130+ countries with ~85,000 experts
Designing, placing and managing P&C, specialty, benefits and advisory solutions across 130+ countries using analytics and market negotiation. Reinsurance structuring, captive optimization and claims advocacy align capital, volatility and recovery. Digital transformation, actuarial modeling and client services leverage ~85,000 professionals (2024) and nat-cat stress inputs (Swiss Re sigma ~USD100bn 2023).
| Metric | Value |
|---|---|
| Countries | 130+ |
| Employees (2024) | ~85,000 |
| Nat‑cat insured losses (2023) | ~USD100bn |
Full Document Unlocks After Purchase
Business Model Canvas
The Marsh McLennan Business Model Canvas you see here is the actual deliverable, not a mockup; it represents the same file you will receive after purchase. When you complete your order, you’ll get this identical Business Model Canvas formatted and ready-to-edit. The final download includes the full document in Word and Excel, with all content and pages included.
Description
Unlock strategic Business Model Canvas: value props, segments, partnerships, revenue
Unlock Marsh McLennan's strategic blueprint with our concise Business Model Canvas overview. Explore its value propositions, customer segments, key partnerships and revenue mechanics to see how the firm scales and sustains competitive advantage. Download the full, editable Canvas in Word and Excel for benchmarking, investor decks, or strategic planning.
Partnerships
Global insurers and reinsurers
Carrier relationships enable competitive placement, capacity access, and tailored policy structures across lines and geographies, leveraging Marsh McLennan’s global reach in 130+ countries (2024). Deep panels with specialty markets improve terms, conditions, and claims responsiveness for complex exposures. Multi-year relationships underpin captives and parametric covers, while joint innovation with carriers accelerates product development.
Capital markets and alternative risk providers
Partnerships with ILS funds, banks and pension investors expand Marsh McLennan’s reinsurance and risk-transfer toolkit, tapping over $100 billion of ILS capital and roughly $17 billion of cat bond issuance in 2023 to support structured solutions. These channels enable balance-sheet optimization and lower clients’ cost of risk through diversified capital sources. Collaboration also strengthens capital advisory and portfolio resilience for large sponsors and insurers.
Data, analytics, and technology vendors
Third-party data sources, modeling tools and cloud platforms power Marsh McLennan’s risk quantification and insights, with Flexera 2024 noting roughly 70% of enterprise workloads in the cloud. Partnerships boost speed, accuracy and scalability of analytics, reducing time-to-insight across teams. Deep integrations enable richer client portals, benchmarking and scenario testing, while joint roadmaps keep capabilities current and differentiated.
Healthcare, benefits, and HR-tech ecosystems
Ties with carriers, PBMs, providers and HR platforms optimize benefits design and cost containment, with the three largest PBMs handling roughly 80% of U.S. prescription claims (2024). Ecosystem partners enable digital enrollment, wellbeing and analytics, improving employee experience and employer ROI. Co-developed solutions accelerate adoption and deliver measurable outcomes.
- Carrier/PBM/provider integration
- Digital enrollment & analytics
- Wellbeing & ROI focus
Industry bodies and regulatory stakeholders
Engagement with regulators and industry associations informs Marsh McLennan’s compliance and market practice, leveraging its 2024 reach across 130+ countries and ~88,000 employees to align standards globally. Participation helps shape resilience frameworks and disclosure norms, giving clients early visibility into rule changes that reduces firm and client risk. Sustained thought leadership strengthens credibility and advocacy with policymakers.
- Regulatory engagement: global 130+ countries presence
- Scale: ~88,000 employees (2024)
130+ countries, $100B+ ILS capital, cloud-first analytics
Carrier, ILS and reinsurer ties secure capacity and tailored programs across 130+ countries and ~88,000 employees (2024), leveraging $100B+ ILS capital and $17B cat bond market (2023). Tech, data and cloud partners (≈70% workloads in cloud, 2024) accelerate analytics and client portals. PBM/provider integrations (top 3 PBMs ≈80% US claims, 2024) cut benefits cost and improve outcomes.
| Partner | Metric |
|---|---|
| Carriers | 130+ countries |
| ILS/Markets | $100B capital |
| Cloud/Data | ≈70% workloads |
What is included in the product
Detailed Word Document
A comprehensive Business Model Canvas for Marsh McLennan detailing customer segments, value propositions, channels, revenue streams, key activities, partners, resources, cost structure and customer relationships across risk & insurance broking, consulting and analytics. Designed for presentations, investor discussions and strategic planning with insights on competitive advantages and market positioning.
Customizable Excel Spreadsheet
High-level, editable one-page snapshot of Marsh McLennan’s business model that quickly identifies core components and relieves analysis bottlenecks for teams and advisors.
Activities
Insurance and reinsurance broking
Designing, marketing, and placing P&C and specialty risk programs is core, tailored across industries and geographies; Marsh McLennan operated in 130+ countries in 2024. Negotiation secures pricing, coverage breadth, and service levels with market leverage and analytics. Reinsurance structuring aligns retention, volatility, and capital goals via treaty and facultative solutions. Ongoing stewardship maintains program performance and alignment through regular reviews and claims advocacy.
Risk advisory and analytics
Quantifying exposures with models, benchmarks and scenarios drives decision-making, using inputs such as Swiss Re sigma’s ~USD100bn insured natural catastrophe losses in 2023 to stress-test portfolios and price risk.
Enterprise risk, cyber, climate and supply-chain analytics translate scenario outputs into strategic priorities, with cyber insurance market growth and supply-chain disruption metrics guiding controls and transfer strategies.
Captive feasibility and optimization analyses enhance capital efficiency by modeling retained loss distributions and capital requirements, and those insights feed program design and board reporting for transparent governance.
Health, wealth, and talent consulting
Benefits strategy, actuarial and brokerage services at Marsh McLennan drive cost containment and better outcomes through data-driven modeling and risk transfer. Investment advisory and delegated solutions support retirement plans and institutions with fiduciary oversight and scalable portfolio management. Workforce strategy, rewards and transformation programs lift performance and retention. Administration and managed services deliver continuity and scale across 130+ countries with ~85,000 employees (2024).
Strategy and management consulting
Marsh McLennan delivers end-to-end strategy, operations and digital transformation to boost client competitiveness, leveraging a global network in 130+ countries and ~85,000 employees (2024). Sector experts run growth, pricing and cost programs while risk-informed strategy links resilience to value creation, with implementation focused on measurable impact and KPI-driven outcomes.
Claims advocacy and client servicing
Proactive claims advocacy and client servicing at Marsh McLennan ensure regulatory compliance, seamless renewals, and change management across 130+ countries; centralized claims support accelerates recovery and improves outcomes while continuous monitoring adjusts programs to evolving risks. Client education builds capability and trust, leveraging a global platform of over 85,000 professionals in 2024.
- Compliance & renewals
- Claims acceleration
- Continuous monitoring
- Client education & trust
Global P&C, reinsurance and captive solutions across 130+ countries with ~85,000 experts
Designing, placing and managing P&C, specialty, benefits and advisory solutions across 130+ countries using analytics and market negotiation. Reinsurance structuring, captive optimization and claims advocacy align capital, volatility and recovery. Digital transformation, actuarial modeling and client services leverage ~85,000 professionals (2024) and nat-cat stress inputs (Swiss Re sigma ~USD100bn 2023).
| Metric | Value |
|---|---|
| Countries | 130+ |
| Employees (2024) | ~85,000 |
| Nat‑cat insured losses (2023) | ~USD100bn |
Full Document Unlocks After Purchase
Business Model Canvas
The Marsh McLennan Business Model Canvas you see here is the actual deliverable, not a mockup; it represents the same file you will receive after purchase. When you complete your order, you’ll get this identical Business Model Canvas formatted and ready-to-edit. The final download includes the full document in Word and Excel, with all content and pages included.











