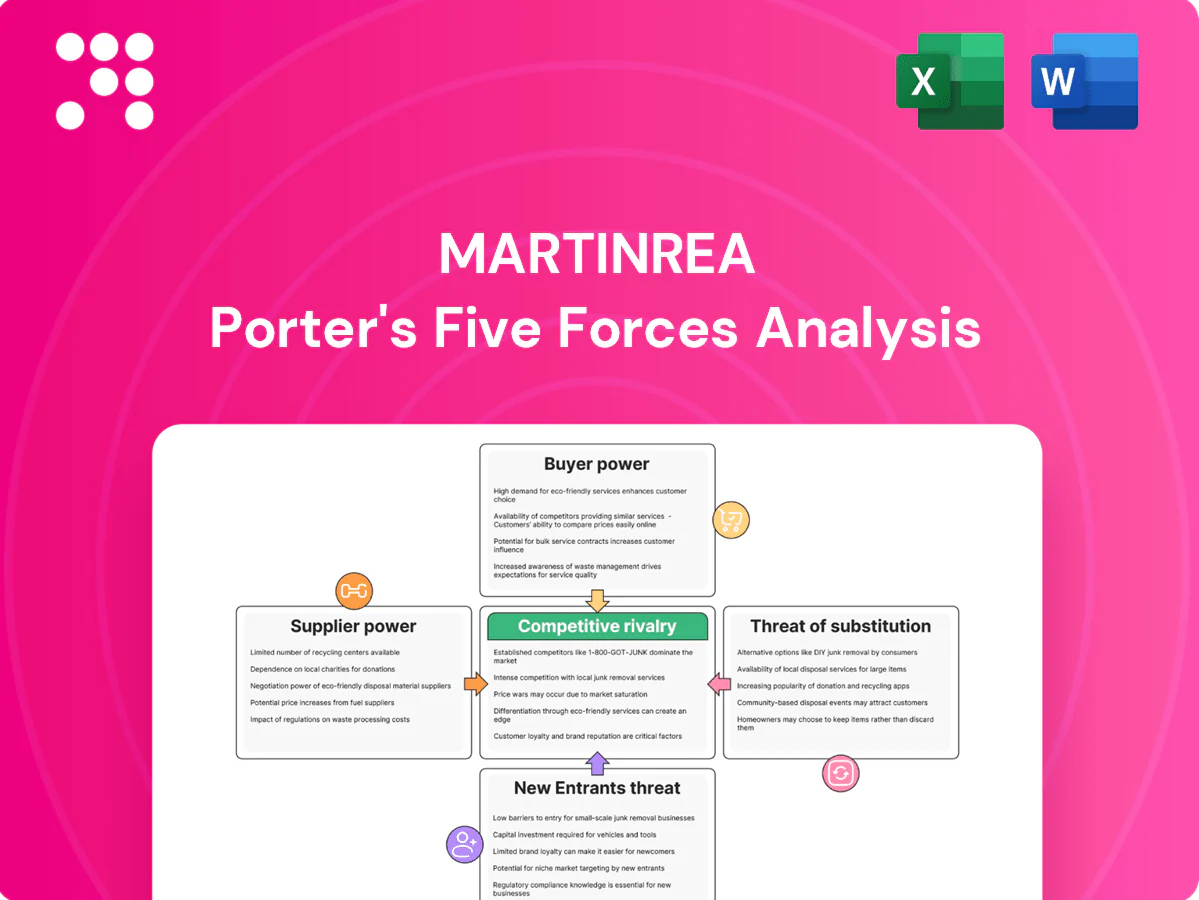
Martinrea Porter's Five Forces Analysis

From Overview to Strategy Blueprint
Martinrea's Porter's Five Forces snapshot highlights supplier bargaining, buyer pressure, rival intensity, new entrant threats, and substitution risks shaping its auto-parts position. This concise view surfaces key strategic tensions and margins. Unlock the full Porter's Five Forces Analysis to access force-by-force ratings, visuals, and actionable recommendations for Martinrea.
Suppliers Bargaining Power

Concentrated metal inputs
Steel and aluminum inputs come from a concentrated group of mills and smelters—in 2024 the top 10 steelmakers account for roughly 55% of capacity and the top 5 aluminum producers about 60%—giving suppliers clear leverage. Energy and tariff-driven price swings, with energy representing about 30–40% of smelting cost, are often passed through unevenly. Martinrea uses multi-year contracts, hedging and dual-sourcing where feasible. Qualification lead-times for new metal suppliers commonly run several months to over a year, sustaining switching frictions.
Capital equipment dependence
Large presses, casting cells, robotics and dies come from niche OEMs with typical lead-times of 9–18 months in 2024, creating supplier leverage over program timing. Tooling amortization over roughly 5 years binds programs to specific vendors and raises switching costs. Preventive maintenance and in-house tool rooms can cut unplanned downtime by up to 40%, but replacement/upgrade cycles every 7–12 years give suppliers timing power.

Spec-driven components
Spec-driven fluid-management parts demand resins, elastomers and fittings to OEM specs, leaving few substitutes and typically 2–4 qualified suppliers on approved vendor lists. Compliance with IATF 16949 and PPAP requirements makes switching costly and validation cycles of 6–12 months common. These constraints limit supplier opportunism but slow re-sourcing and raise switching costs for buyers.

Logistics and location
Logistics and location: JIT/JIS delivery increases the value of proximate suppliers with reliable logistics, boosting supplier leverage when local responsiveness is critical. Global disruptions such as port congestion and geopolitics raise freight surcharges and supplier bargaining power. Martinrea’s multi-country footprint enables local-for-local sourcing to mitigate this risk, while modest nearshoring trends shift some negotiation power back toward buyers.
- Proximate suppliers gain value under JIT/JIS
- Disruptions elevate freight surcharges and supplier power
- Martinrea’s global footprint supports local sourcing
- Nearshoring modestly rebalances power to buyers
Sustainability premiums
Rising demand for low-carbon aluminium and steel in 2024 is creating green premiums—market data shows roughly 5–15% for low‑CO2 aluminium (about $200–600/ton) and 3–10% for green steel ($30–120/ton), strengthening select certified suppliers with limited capacity. Martinrea can co-develop supply roadmaps to secure volumes and improve cost curves, while greater Scope 3 transparency will incrementally boost negotiation leverage.
- Supplier concentration: higher for certified metals
- Premium range: aluminium 5–15%, steel 3–10%
- Mitigation: co-development of roadmaps
- Leverage: Scope 3 transparency over time
Supplier power high: metals 55–60%, tooling 9–18m
Supplier power is elevated: metals concentrated (top10 steel ~55%, top5 aluminium ~60% in 2024), tooling/OEMs 9–18m lead-times, fluids 2–4 qualified suppliers and 6–12m validation, and logistics/JIT gives local suppliers premium; green metal premiums 2024: aluminium 5–15%, steel 3–10%.
| Type | Concentration | Lead time | 2024 premium |
|---|---|---|---|
| Metals | Top10 steel 55%/Top5 Al 60% | months | Al 5–15% / Steel 3–10% |
| Tooling/OEMs | niche | 9–18 months | — |
| Fluids | 2–4 suppliers | 6–12 months | — |
What is included in the product
 Detailed Word Document
Tailored exclusively for Martinrea, this Porter's Five Forces overview uncovers key drivers of competition, supplier and buyer power, substitutes and new-entrant risks, and identifies disruptive threats and market dynamics shaping the company’s pricing, profitability, and strategic positioning.

 Customizable Excel Spreadsheet
A concise one-sheet Porter's Five Forces for Martinrea that visualizes competitive pressure and supplier/customer leverage to ease board decisions and scenario planning; adjust inputs for market shifts and export the radar chart directly into pitch decks.
Customers Bargaining Power

OEM concentration
A handful of OEMs drive buying power: the top 10 global automakers accounted for roughly 65% of light-vehicle production in 2024, concentrating volumes and negotiating leverage. These OEMs mandate annual price-downs typically in the 1–3% range and pursue competitive re-sourcing to shave costs. Supplier scorecards tightly track quality, delivery and cost, while contract terms favor buyers with penalties and charge-backs that can materially affect supplier margins.
Program-based awards
Program-based awards are life-of-program but routinely re-bid at mid-cycle redesigns, allowing OEMs to extract margin concessions; Martinrea reported CAD 6.0 billion revenue in 2024, highlighting scale-dependent exposure. Tooling support is contractually negotiated but often shifts cost-recovery risk to suppliers, compressing margins. Buyers frequently split awards to sustain pricing tension; incumbency improves renewal odds but offers no guarantee.

Switching costs vs revalidation
High switching costs for OEMs arise from tooling often exceeding $500,000 and PPAP revalidation cycles of 3–6 months, but OEMs can schedule phased revalidation to mitigate disruption. Multi-sourcing (commonly used across OEMs) reduces single-supplier risk, while Martinrea’s integration and co-design capabilities raise practical switching costs. Nonetheless, persistent unit-cost gaps continue to prompt competitive RFQs.

EV transition leverage
EV platform rollouts in 2024 reopen supplier selection, boosting buyer leverage as OEMs demand lightweighting and integrated thermal/fluid systems to cut system costs; early engineering engagement secures specs and value-based pricing, while late entrants face commoditization and margin pressure.
- Buyers: more choice, higher leverage
- Demand: lightweighting + thermal solutions
- Early engineering: locks value pricing
- Late entry: price-take risk
Global footprint expectations
OEMs push suppliers for global capacity, regional localization and production resilience; meeting regional rules like USMCA’s 75% North American content (automotive ROO) materially improves award chances. Buyers routinely shift volumes across Mexico, North America and Europe to optimize total landed cost, and compliance with EU CSRD (2024) plus end-to-end traceability is now table stakes.
- Global capacity and localization demanded
- USMCA 75% content gives award preference
- Volumes shifted to optimize landed cost
- CSRD (2024) and traceability required
OEM concentration (65%) and 1–3% price‑downs squeeze margins; 75% ROO raises re‑sourcing risk
OEM concentration (top 10 ≈65% light‑vehicle production in 2024) and typical 1–3% annual price‑downs give buyers strong leverage; scorecards, penalties and charge‑backs compress supplier margins. Program awards re‑bid at mid‑cycle and Martinrea revenue CAD 6.0B (2024) shows scale exposure. EV platforms and USMCA 75% ROO expand buyer choice, raising re‑sourcing risk.
| Metric | 2024 | Impact |
|---|---|---|
| Top10 OEM share | ≈65% | High buyer leverage |
| Price‑downs | 1–3% p.a. | Margin pressure |
| Martinrea revenue | CAD 6.0B | Scale exposure |
Full Version Awaits
Martinrea Porter's Five Forces Analysis
This preview is the exact Martinrea Porter's Five Forces Analysis you’ll receive after purchase—fully formatted, complete, and ready to download. It delivers a professional assessment of supplier power, buyer power, competitive rivalry, threat of substitutes, and barriers to entry. No placeholders or samples—instant access to the final document upon payment.

From Overview to Strategy Blueprint
Martinrea's Porter's Five Forces snapshot highlights supplier bargaining, buyer pressure, rival intensity, new entrant threats, and substitution risks shaping its auto-parts position. This concise view surfaces key strategic tensions and margins. Unlock the full Porter's Five Forces Analysis to access force-by-force ratings, visuals, and actionable recommendations for Martinrea.
Suppliers Bargaining Power
Concentrated metal inputs
Steel and aluminum inputs come from a concentrated group of mills and smelters—in 2024 the top 10 steelmakers account for roughly 55% of capacity and the top 5 aluminum producers about 60%—giving suppliers clear leverage. Energy and tariff-driven price swings, with energy representing about 30–40% of smelting cost, are often passed through unevenly. Martinrea uses multi-year contracts, hedging and dual-sourcing where feasible. Qualification lead-times for new metal suppliers commonly run several months to over a year, sustaining switching frictions.
Capital equipment dependence
Large presses, casting cells, robotics and dies come from niche OEMs with typical lead-times of 9–18 months in 2024, creating supplier leverage over program timing. Tooling amortization over roughly 5 years binds programs to specific vendors and raises switching costs. Preventive maintenance and in-house tool rooms can cut unplanned downtime by up to 40%, but replacement/upgrade cycles every 7–12 years give suppliers timing power.
Spec-driven components
Spec-driven fluid-management parts demand resins, elastomers and fittings to OEM specs, leaving few substitutes and typically 2–4 qualified suppliers on approved vendor lists. Compliance with IATF 16949 and PPAP requirements makes switching costly and validation cycles of 6–12 months common. These constraints limit supplier opportunism but slow re-sourcing and raise switching costs for buyers.
Logistics and location
Logistics and location: JIT/JIS delivery increases the value of proximate suppliers with reliable logistics, boosting supplier leverage when local responsiveness is critical. Global disruptions such as port congestion and geopolitics raise freight surcharges and supplier bargaining power. Martinrea’s multi-country footprint enables local-for-local sourcing to mitigate this risk, while modest nearshoring trends shift some negotiation power back toward buyers.
- Proximate suppliers gain value under JIT/JIS
- Disruptions elevate freight surcharges and supplier power
- Martinrea’s global footprint supports local sourcing
- Nearshoring modestly rebalances power to buyers
Sustainability premiums
Rising demand for low-carbon aluminium and steel in 2024 is creating green premiums—market data shows roughly 5–15% for low‑CO2 aluminium (about $200–600/ton) and 3–10% for green steel ($30–120/ton), strengthening select certified suppliers with limited capacity. Martinrea can co-develop supply roadmaps to secure volumes and improve cost curves, while greater Scope 3 transparency will incrementally boost negotiation leverage.
- Supplier concentration: higher for certified metals
- Premium range: aluminium 5–15%, steel 3–10%
- Mitigation: co-development of roadmaps
- Leverage: Scope 3 transparency over time
Supplier power high: metals 55–60%, tooling 9–18m
Supplier power is elevated: metals concentrated (top10 steel ~55%, top5 aluminium ~60% in 2024), tooling/OEMs 9–18m lead-times, fluids 2–4 qualified suppliers and 6–12m validation, and logistics/JIT gives local suppliers premium; green metal premiums 2024: aluminium 5–15%, steel 3–10%.
| Type | Concentration | Lead time | 2024 premium |
|---|---|---|---|
| Metals | Top10 steel 55%/Top5 Al 60% | months | Al 5–15% / Steel 3–10% |
| Tooling/OEMs | niche | 9–18 months | — |
| Fluids | 2–4 suppliers | 6–12 months | — |
What is included in the product
Detailed Word Document
Tailored exclusively for Martinrea, this Porter's Five Forces overview uncovers key drivers of competition, supplier and buyer power, substitutes and new-entrant risks, and identifies disruptive threats and market dynamics shaping the company’s pricing, profitability, and strategic positioning.
Customizable Excel Spreadsheet
A concise one-sheet Porter's Five Forces for Martinrea that visualizes competitive pressure and supplier/customer leverage to ease board decisions and scenario planning; adjust inputs for market shifts and export the radar chart directly into pitch decks.
Customers Bargaining Power
OEM concentration
A handful of OEMs drive buying power: the top 10 global automakers accounted for roughly 65% of light-vehicle production in 2024, concentrating volumes and negotiating leverage. These OEMs mandate annual price-downs typically in the 1–3% range and pursue competitive re-sourcing to shave costs. Supplier scorecards tightly track quality, delivery and cost, while contract terms favor buyers with penalties and charge-backs that can materially affect supplier margins.
Program-based awards
Program-based awards are life-of-program but routinely re-bid at mid-cycle redesigns, allowing OEMs to extract margin concessions; Martinrea reported CAD 6.0 billion revenue in 2024, highlighting scale-dependent exposure. Tooling support is contractually negotiated but often shifts cost-recovery risk to suppliers, compressing margins. Buyers frequently split awards to sustain pricing tension; incumbency improves renewal odds but offers no guarantee.
Switching costs vs revalidation
High switching costs for OEMs arise from tooling often exceeding $500,000 and PPAP revalidation cycles of 3–6 months, but OEMs can schedule phased revalidation to mitigate disruption. Multi-sourcing (commonly used across OEMs) reduces single-supplier risk, while Martinrea’s integration and co-design capabilities raise practical switching costs. Nonetheless, persistent unit-cost gaps continue to prompt competitive RFQs.
EV transition leverage
EV platform rollouts in 2024 reopen supplier selection, boosting buyer leverage as OEMs demand lightweighting and integrated thermal/fluid systems to cut system costs; early engineering engagement secures specs and value-based pricing, while late entrants face commoditization and margin pressure.
- Buyers: more choice, higher leverage
- Demand: lightweighting + thermal solutions
- Early engineering: locks value pricing
- Late entry: price-take risk
Global footprint expectations
OEMs push suppliers for global capacity, regional localization and production resilience; meeting regional rules like USMCA’s 75% North American content (automotive ROO) materially improves award chances. Buyers routinely shift volumes across Mexico, North America and Europe to optimize total landed cost, and compliance with EU CSRD (2024) plus end-to-end traceability is now table stakes.
- Global capacity and localization demanded
- USMCA 75% content gives award preference
- Volumes shifted to optimize landed cost
- CSRD (2024) and traceability required
OEM concentration (65%) and 1–3% price‑downs squeeze margins; 75% ROO raises re‑sourcing risk
OEM concentration (top 10 ≈65% light‑vehicle production in 2024) and typical 1–3% annual price‑downs give buyers strong leverage; scorecards, penalties and charge‑backs compress supplier margins. Program awards re‑bid at mid‑cycle and Martinrea revenue CAD 6.0B (2024) shows scale exposure. EV platforms and USMCA 75% ROO expand buyer choice, raising re‑sourcing risk.
| Metric | 2024 | Impact |
|---|---|---|
| Top10 OEM share | ≈65% | High buyer leverage |
| Price‑downs | 1–3% p.a. | Margin pressure |
| Martinrea revenue | CAD 6.0B | Scale exposure |
Full Version Awaits
Martinrea Porter's Five Forces Analysis
This preview is the exact Martinrea Porter's Five Forces Analysis you’ll receive after purchase—fully formatted, complete, and ready to download. It delivers a professional assessment of supplier power, buyer power, competitive rivalry, threat of substitutes, and barriers to entry. No placeholders or samples—instant access to the final document upon payment.
Description
From Overview to Strategy Blueprint
Martinrea's Porter's Five Forces snapshot highlights supplier bargaining, buyer pressure, rival intensity, new entrant threats, and substitution risks shaping its auto-parts position. This concise view surfaces key strategic tensions and margins. Unlock the full Porter's Five Forces Analysis to access force-by-force ratings, visuals, and actionable recommendations for Martinrea.
Suppliers Bargaining Power
Concentrated metal inputs
Steel and aluminum inputs come from a concentrated group of mills and smelters—in 2024 the top 10 steelmakers account for roughly 55% of capacity and the top 5 aluminum producers about 60%—giving suppliers clear leverage. Energy and tariff-driven price swings, with energy representing about 30–40% of smelting cost, are often passed through unevenly. Martinrea uses multi-year contracts, hedging and dual-sourcing where feasible. Qualification lead-times for new metal suppliers commonly run several months to over a year, sustaining switching frictions.
Capital equipment dependence
Large presses, casting cells, robotics and dies come from niche OEMs with typical lead-times of 9–18 months in 2024, creating supplier leverage over program timing. Tooling amortization over roughly 5 years binds programs to specific vendors and raises switching costs. Preventive maintenance and in-house tool rooms can cut unplanned downtime by up to 40%, but replacement/upgrade cycles every 7–12 years give suppliers timing power.
Spec-driven components
Spec-driven fluid-management parts demand resins, elastomers and fittings to OEM specs, leaving few substitutes and typically 2–4 qualified suppliers on approved vendor lists. Compliance with IATF 16949 and PPAP requirements makes switching costly and validation cycles of 6–12 months common. These constraints limit supplier opportunism but slow re-sourcing and raise switching costs for buyers.
Logistics and location
Logistics and location: JIT/JIS delivery increases the value of proximate suppliers with reliable logistics, boosting supplier leverage when local responsiveness is critical. Global disruptions such as port congestion and geopolitics raise freight surcharges and supplier bargaining power. Martinrea’s multi-country footprint enables local-for-local sourcing to mitigate this risk, while modest nearshoring trends shift some negotiation power back toward buyers.
- Proximate suppliers gain value under JIT/JIS
- Disruptions elevate freight surcharges and supplier power
- Martinrea’s global footprint supports local sourcing
- Nearshoring modestly rebalances power to buyers
Sustainability premiums
Rising demand for low-carbon aluminium and steel in 2024 is creating green premiums—market data shows roughly 5–15% for low‑CO2 aluminium (about $200–600/ton) and 3–10% for green steel ($30–120/ton), strengthening select certified suppliers with limited capacity. Martinrea can co-develop supply roadmaps to secure volumes and improve cost curves, while greater Scope 3 transparency will incrementally boost negotiation leverage.
- Supplier concentration: higher for certified metals
- Premium range: aluminium 5–15%, steel 3–10%
- Mitigation: co-development of roadmaps
- Leverage: Scope 3 transparency over time
Supplier power high: metals 55–60%, tooling 9–18m
Supplier power is elevated: metals concentrated (top10 steel ~55%, top5 aluminium ~60% in 2024), tooling/OEMs 9–18m lead-times, fluids 2–4 qualified suppliers and 6–12m validation, and logistics/JIT gives local suppliers premium; green metal premiums 2024: aluminium 5–15%, steel 3–10%.
| Type | Concentration | Lead time | 2024 premium |
|---|---|---|---|
| Metals | Top10 steel 55%/Top5 Al 60% | months | Al 5–15% / Steel 3–10% |
| Tooling/OEMs | niche | 9–18 months | — |
| Fluids | 2–4 suppliers | 6–12 months | — |
What is included in the product
Detailed Word Document
Tailored exclusively for Martinrea, this Porter's Five Forces overview uncovers key drivers of competition, supplier and buyer power, substitutes and new-entrant risks, and identifies disruptive threats and market dynamics shaping the company’s pricing, profitability, and strategic positioning.
Customizable Excel Spreadsheet
A concise one-sheet Porter's Five Forces for Martinrea that visualizes competitive pressure and supplier/customer leverage to ease board decisions and scenario planning; adjust inputs for market shifts and export the radar chart directly into pitch decks.
Customers Bargaining Power
OEM concentration
A handful of OEMs drive buying power: the top 10 global automakers accounted for roughly 65% of light-vehicle production in 2024, concentrating volumes and negotiating leverage. These OEMs mandate annual price-downs typically in the 1–3% range and pursue competitive re-sourcing to shave costs. Supplier scorecards tightly track quality, delivery and cost, while contract terms favor buyers with penalties and charge-backs that can materially affect supplier margins.
Program-based awards
Program-based awards are life-of-program but routinely re-bid at mid-cycle redesigns, allowing OEMs to extract margin concessions; Martinrea reported CAD 6.0 billion revenue in 2024, highlighting scale-dependent exposure. Tooling support is contractually negotiated but often shifts cost-recovery risk to suppliers, compressing margins. Buyers frequently split awards to sustain pricing tension; incumbency improves renewal odds but offers no guarantee.
Switching costs vs revalidation
High switching costs for OEMs arise from tooling often exceeding $500,000 and PPAP revalidation cycles of 3–6 months, but OEMs can schedule phased revalidation to mitigate disruption. Multi-sourcing (commonly used across OEMs) reduces single-supplier risk, while Martinrea’s integration and co-design capabilities raise practical switching costs. Nonetheless, persistent unit-cost gaps continue to prompt competitive RFQs.
EV transition leverage
EV platform rollouts in 2024 reopen supplier selection, boosting buyer leverage as OEMs demand lightweighting and integrated thermal/fluid systems to cut system costs; early engineering engagement secures specs and value-based pricing, while late entrants face commoditization and margin pressure.
- Buyers: more choice, higher leverage
- Demand: lightweighting + thermal solutions
- Early engineering: locks value pricing
- Late entry: price-take risk
Global footprint expectations
OEMs push suppliers for global capacity, regional localization and production resilience; meeting regional rules like USMCA’s 75% North American content (automotive ROO) materially improves award chances. Buyers routinely shift volumes across Mexico, North America and Europe to optimize total landed cost, and compliance with EU CSRD (2024) plus end-to-end traceability is now table stakes.
- Global capacity and localization demanded
- USMCA 75% content gives award preference
- Volumes shifted to optimize landed cost
- CSRD (2024) and traceability required
OEM concentration (65%) and 1–3% price‑downs squeeze margins; 75% ROO raises re‑sourcing risk
OEM concentration (top 10 ≈65% light‑vehicle production in 2024) and typical 1–3% annual price‑downs give buyers strong leverage; scorecards, penalties and charge‑backs compress supplier margins. Program awards re‑bid at mid‑cycle and Martinrea revenue CAD 6.0B (2024) shows scale exposure. EV platforms and USMCA 75% ROO expand buyer choice, raising re‑sourcing risk.
| Metric | 2024 | Impact |
|---|---|---|
| Top10 OEM share | ≈65% | High buyer leverage |
| Price‑downs | 1–3% p.a. | Margin pressure |
| Martinrea revenue | CAD 6.0B | Scale exposure |
Full Version Awaits
Martinrea Porter's Five Forces Analysis
This preview is the exact Martinrea Porter's Five Forces Analysis you’ll receive after purchase—fully formatted, complete, and ready to download. It delivers a professional assessment of supplier power, buyer power, competitive rivalry, threat of substitutes, and barriers to entry. No placeholders or samples—instant access to the final document upon payment.











