Marvin Porter's Five Forces Analysis

A Must-Have Tool for Decision-Makers
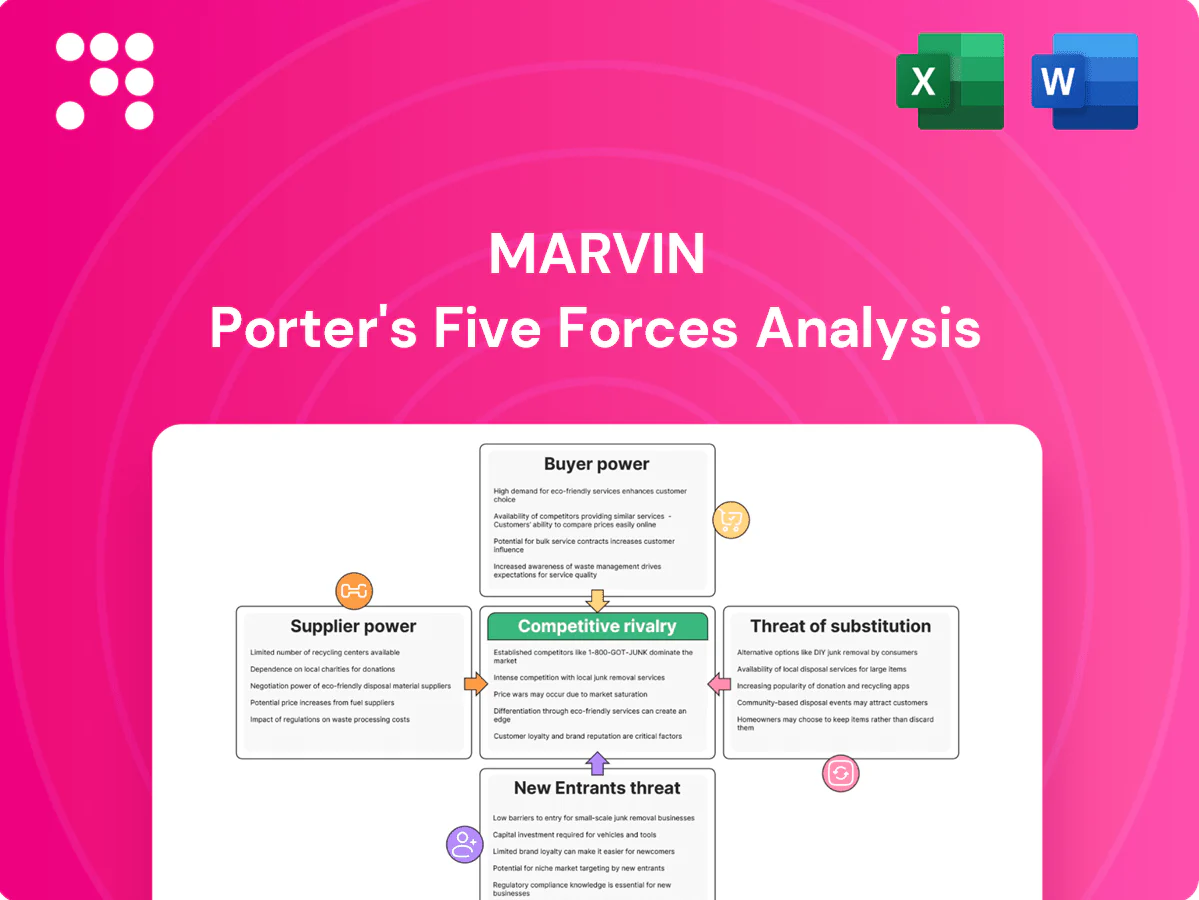
Marvin Porter's Five Forces Analysis reveals competitive intensity, supplier and buyer power, threat of substitutes and new entrants, and overall industry rivalry. This snapshot highlights key pressures shaping profitability and strategic risk. Ready to go deeper? Unlock the full Porter's Five Forces Analysis for force-by-force ratings, visuals, and actionable recommendations.
Suppliers Bargaining Power

Concentrated specialty glass suppliers
High-performance low-E and laminated glass supply is concentrated among global producers AGC, Saint‑Gobain, Guardian and NSG, giving suppliers leverage over price and availability. Certification, tight optical tolerances and tempering capabilities constrain Marvin's ability to switch, so long-term volume contracts are needed to mitigate pricing power. Industry disruptions and surcharges seen during 2022–24 have shown shortages can be passed through, lengthening Marvin's lead times and compressing margins.
Differentiated hardware and coatings inputs
Multipoint locks, hinges and specialized finishes are engineered to tight tolerances, creating quasi-unique supplier dependencies that limit substitution. Requalification and testing typically add months and six-figure costs, raising tangible switching costs for OEMs. Design changes to accept alternative components often ripple through BOMs and manufacturing processes, while long-term partnerships secure priority allocation and co-development advantages.

Commodity materials with cyclical pricing
Wood, aluminum, fiberglass resins and PVC show market-driven volatility—lumber saw swings >50% during 2020–22 while LME aluminum averaged about $2,600/ton in 2024 and PVC/resin spot prices swung roughly 15–30% in 2024. Widely available inputs can still spike from transport and milling bottlenecks. Hedging and multi-sourcing cut exposure but not fully. Marvin’s scale yields measurable negotiating leverage on base commodity pricing.

Logistics and glass fabrication capacity constraints
Tempered/insulated glass units are bulky and freight-sensitive, tying Marvin to regional fabricators and carriers; 2024 industry capacity utilization ran above 80%, boosting supplier leverage in upcycles. Proximity needs limit low-cost alternatives without substantial freight or lead-time penalties. Strategic stocking and vendor-managed inventory can partially blunt this logistical bargaining power.
- Regional fabricators dominant — drives dependency
- Capacity utilization >80% in 2024 — increases supplier power
- Proximity limits alternatives — raises switching costs
- Stocking/VMI — mitigates but does not eliminate leverage
Sustainability and code compliance requirements
Sustainability and code compliance—Energy Star (EPA lists over 3,000 partners), NFRC ratings referenced in model codes, and local specs sharply narrow acceptable supplier lists, while FSC wood, low-VOC finishes and EPDs add qualification hurdles that increase switching costs and documentation burdens.
- Compliance raises switching costs
- Documentation burden increases
- Approved-vendor rosters entrench suppliers
Supplier power tight - glass util >80%, requal costs > $100k
Supplier power is high: top glass makers (AGC, Saint‑Gobain, Guardian, NSG) concentrate supply; tempered/IGU capacity utilization >80% in 2024, lengthening lead times and compressing margins. Component requalification costs (months, >$100k) and certification (Energy Star partners >3,000; NFRC) raise switching costs. Commodities volatile: LME aluminum ~$2,600/ton (2024); PVC/resin ±15–30% (2024).
| Metric | 2024 / Note |
|---|---|
| Glass capacity util. | >80% |
| LME aluminum | ~$2,600/ton |
| PVC/resin volatility | ±15–30% |
| Energy Star partners | >3,000 |
What is included in the product
 Detailed Word Document
Comprehensive Porter’s Five Forces analysis for Marvin, uncovering competitive drivers, supplier and buyer power, entry barriers, substitutes, and emerging disruptors, with data‑driven insights to inform strategy, investor materials, and internal planning.

 Customizable Excel Spreadsheet
A one-sheet Five Forces tool that converts complex competitive dynamics into an actionable spider/radar chart, letting teams customize pressure levels, swap in their own data and labels, and integrate into decks—no macros or finance background required for fast, confident decisions.
Customers Bargaining Power

Dealer-driven channel influence
Independent dealers and showrooms shape product selection and pricing narratives, with dealer-managed retailers accounting for a dominant share of in-store influence in 2024; their ability to switch brands gives them clear bargaining leverage. Co-op marketing and MDF, typically 1–3% of manufacturer revenue in 2024, can align incentives and offset price pressure. Maintaining strong dealer relationships is crucial to defend margin and shelf space, especially where dealers control primary customer touchpoints.
Professional buyers demand performance
Builders, architects and commercial buyers increasingly specify thermal, acoustic and structural ratings, with 2024 commercial projects demanding LEED or equivalent compliance in 40% of U.S. bids. Submittals, mockups and extended warranties are negotiated, raising buyer leverage and compressing supplier margins. Project bundling drives volume discounts often in the 5–12% range and schedule commitments. Value engineering routinely targets 5–10% cost reductions, pressuring suppliers toward lower-cost lines.

End-user price transparency
Homeowners increasingly compare quotes across brands online and in showrooms, with 72% reporting quote comparison before purchase (2024). Visible promotions and easy financing options amplify price sensitivity and shorten conversion windows. Reviews and promised lead-times materially shape perceived value, while customization reduces direct comparability and often extends decision cycles.

Switching costs vary by project stage
Early-stage projects can swap specifications with low friction, raising buyer leverage; industry reports (2024) show change orders often account for 5–10% of contract value, underscoring early bargaining power. Late-stage re-submittals and remeasurements typically add time and 1–3% extra cost, increasing switching costs, while installed-base replacements favor compatible systems; a 2024 B2B survey found 72% of buyers cite service responsiveness as decisive for retention.
- Low early switching costs — higher buyer leverage
- Late-stage rework adds time/cost — softens pressure
- Installed-base favors compatibility — reduces churn
- Service responsiveness (72% in 2024) — key retention factor
Customization vs standard SKUs trade-offs
Custom sizes, finishes, and configurations reduce direct price comparability and weaken buyer power; 2024 McKinsey found 61% of B2B buyers willing to pay more for customization. Long lead times and change-order risks still drive negotiation, while standard SKUs at big-box rivals anchor price expectations. Clear good-better-best tiering preserves perceived value and margins.
- Customization limits price shopping
- Lead times trigger discounts
- Standard SKUs set price anchors
- Tiering manages value perception
Dealers dominate in-store; 72% compare, 40% LEED bids shape pricing
Dealers hold strong leverage in 2024 with dominant in-store influence and low switching costs; MDF/co-op (1–3% of revenue) partially offsets price pressure. Commercial buyers demand LEED in 40% of bids, driving spec negotiation and 5–12% volume discounts. 72% of homeowners compare quotes; 61% of B2B buyers pay more for customization, reducing direct price sensitivity.
| Buyer segment | 2024 metric | Impact |
|---|---|---|
| Dealers | MDF 1–3% | Price leverage |
| Commercial | 40% LEED bids | Spec leverage |
| Consumers | 72% compare | Price sensitive |
Same Document Delivered
Marvin Porter's Five Forces Analysis
This preview shows Marvin Porter's Five Forces Analysis exactly as delivered—no placeholders or samples. The document here is the full, professionally formatted file you’ll receive instantly after purchase. Ready for immediate download and use, it’s the exact analysis you see.

A Must-Have Tool for Decision-Makers
Marvin Porter's Five Forces Analysis reveals competitive intensity, supplier and buyer power, threat of substitutes and new entrants, and overall industry rivalry. This snapshot highlights key pressures shaping profitability and strategic risk. Ready to go deeper? Unlock the full Porter's Five Forces Analysis for force-by-force ratings, visuals, and actionable recommendations.
Suppliers Bargaining Power
Concentrated specialty glass suppliers
High-performance low-E and laminated glass supply is concentrated among global producers AGC, Saint‑Gobain, Guardian and NSG, giving suppliers leverage over price and availability. Certification, tight optical tolerances and tempering capabilities constrain Marvin's ability to switch, so long-term volume contracts are needed to mitigate pricing power. Industry disruptions and surcharges seen during 2022–24 have shown shortages can be passed through, lengthening Marvin's lead times and compressing margins.
Differentiated hardware and coatings inputs
Multipoint locks, hinges and specialized finishes are engineered to tight tolerances, creating quasi-unique supplier dependencies that limit substitution. Requalification and testing typically add months and six-figure costs, raising tangible switching costs for OEMs. Design changes to accept alternative components often ripple through BOMs and manufacturing processes, while long-term partnerships secure priority allocation and co-development advantages.
Commodity materials with cyclical pricing
Wood, aluminum, fiberglass resins and PVC show market-driven volatility—lumber saw swings >50% during 2020–22 while LME aluminum averaged about $2,600/ton in 2024 and PVC/resin spot prices swung roughly 15–30% in 2024. Widely available inputs can still spike from transport and milling bottlenecks. Hedging and multi-sourcing cut exposure but not fully. Marvin’s scale yields measurable negotiating leverage on base commodity pricing.
Logistics and glass fabrication capacity constraints
Tempered/insulated glass units are bulky and freight-sensitive, tying Marvin to regional fabricators and carriers; 2024 industry capacity utilization ran above 80%, boosting supplier leverage in upcycles. Proximity needs limit low-cost alternatives without substantial freight or lead-time penalties. Strategic stocking and vendor-managed inventory can partially blunt this logistical bargaining power.
- Regional fabricators dominant — drives dependency
- Capacity utilization >80% in 2024 — increases supplier power
- Proximity limits alternatives — raises switching costs
- Stocking/VMI — mitigates but does not eliminate leverage
Sustainability and code compliance requirements
Sustainability and code compliance—Energy Star (EPA lists over 3,000 partners), NFRC ratings referenced in model codes, and local specs sharply narrow acceptable supplier lists, while FSC wood, low-VOC finishes and EPDs add qualification hurdles that increase switching costs and documentation burdens.
- Compliance raises switching costs
- Documentation burden increases
- Approved-vendor rosters entrench suppliers
Supplier power tight - glass util >80%, requal costs > $100k
Supplier power is high: top glass makers (AGC, Saint‑Gobain, Guardian, NSG) concentrate supply; tempered/IGU capacity utilization >80% in 2024, lengthening lead times and compressing margins. Component requalification costs (months, >$100k) and certification (Energy Star partners >3,000; NFRC) raise switching costs. Commodities volatile: LME aluminum ~$2,600/ton (2024); PVC/resin ±15–30% (2024).
| Metric | 2024 / Note |
|---|---|
| Glass capacity util. | >80% |
| LME aluminum | ~$2,600/ton |
| PVC/resin volatility | ±15–30% |
| Energy Star partners | >3,000 |
What is included in the product
Detailed Word Document
Comprehensive Porter’s Five Forces analysis for Marvin, uncovering competitive drivers, supplier and buyer power, entry barriers, substitutes, and emerging disruptors, with data‑driven insights to inform strategy, investor materials, and internal planning.
Customizable Excel Spreadsheet
A one-sheet Five Forces tool that converts complex competitive dynamics into an actionable spider/radar chart, letting teams customize pressure levels, swap in their own data and labels, and integrate into decks—no macros or finance background required for fast, confident decisions.
Customers Bargaining Power
Dealer-driven channel influence
Independent dealers and showrooms shape product selection and pricing narratives, with dealer-managed retailers accounting for a dominant share of in-store influence in 2024; their ability to switch brands gives them clear bargaining leverage. Co-op marketing and MDF, typically 1–3% of manufacturer revenue in 2024, can align incentives and offset price pressure. Maintaining strong dealer relationships is crucial to defend margin and shelf space, especially where dealers control primary customer touchpoints.
Professional buyers demand performance
Builders, architects and commercial buyers increasingly specify thermal, acoustic and structural ratings, with 2024 commercial projects demanding LEED or equivalent compliance in 40% of U.S. bids. Submittals, mockups and extended warranties are negotiated, raising buyer leverage and compressing supplier margins. Project bundling drives volume discounts often in the 5–12% range and schedule commitments. Value engineering routinely targets 5–10% cost reductions, pressuring suppliers toward lower-cost lines.
End-user price transparency
Homeowners increasingly compare quotes across brands online and in showrooms, with 72% reporting quote comparison before purchase (2024). Visible promotions and easy financing options amplify price sensitivity and shorten conversion windows. Reviews and promised lead-times materially shape perceived value, while customization reduces direct comparability and often extends decision cycles.
Switching costs vary by project stage
Early-stage projects can swap specifications with low friction, raising buyer leverage; industry reports (2024) show change orders often account for 5–10% of contract value, underscoring early bargaining power. Late-stage re-submittals and remeasurements typically add time and 1–3% extra cost, increasing switching costs, while installed-base replacements favor compatible systems; a 2024 B2B survey found 72% of buyers cite service responsiveness as decisive for retention.
- Low early switching costs — higher buyer leverage
- Late-stage rework adds time/cost — softens pressure
- Installed-base favors compatibility — reduces churn
- Service responsiveness (72% in 2024) — key retention factor
Customization vs standard SKUs trade-offs
Custom sizes, finishes, and configurations reduce direct price comparability and weaken buyer power; 2024 McKinsey found 61% of B2B buyers willing to pay more for customization. Long lead times and change-order risks still drive negotiation, while standard SKUs at big-box rivals anchor price expectations. Clear good-better-best tiering preserves perceived value and margins.
- Customization limits price shopping
- Lead times trigger discounts
- Standard SKUs set price anchors
- Tiering manages value perception
Dealers dominate in-store; 72% compare, 40% LEED bids shape pricing
Dealers hold strong leverage in 2024 with dominant in-store influence and low switching costs; MDF/co-op (1–3% of revenue) partially offsets price pressure. Commercial buyers demand LEED in 40% of bids, driving spec negotiation and 5–12% volume discounts. 72% of homeowners compare quotes; 61% of B2B buyers pay more for customization, reducing direct price sensitivity.
| Buyer segment | 2024 metric | Impact |
|---|---|---|
| Dealers | MDF 1–3% | Price leverage |
| Commercial | 40% LEED bids | Spec leverage |
| Consumers | 72% compare | Price sensitive |
Same Document Delivered
Marvin Porter's Five Forces Analysis
This preview shows Marvin Porter's Five Forces Analysis exactly as delivered—no placeholders or samples. The document here is the full, professionally formatted file you’ll receive instantly after purchase. Ready for immediate download and use, it’s the exact analysis you see.
Original: $10.00
-65%$10.00
$3.50Description
A Must-Have Tool for Decision-Makers
Marvin Porter's Five Forces Analysis reveals competitive intensity, supplier and buyer power, threat of substitutes and new entrants, and overall industry rivalry. This snapshot highlights key pressures shaping profitability and strategic risk. Ready to go deeper? Unlock the full Porter's Five Forces Analysis for force-by-force ratings, visuals, and actionable recommendations.
Suppliers Bargaining Power
Concentrated specialty glass suppliers
High-performance low-E and laminated glass supply is concentrated among global producers AGC, Saint‑Gobain, Guardian and NSG, giving suppliers leverage over price and availability. Certification, tight optical tolerances and tempering capabilities constrain Marvin's ability to switch, so long-term volume contracts are needed to mitigate pricing power. Industry disruptions and surcharges seen during 2022–24 have shown shortages can be passed through, lengthening Marvin's lead times and compressing margins.
Differentiated hardware and coatings inputs
Multipoint locks, hinges and specialized finishes are engineered to tight tolerances, creating quasi-unique supplier dependencies that limit substitution. Requalification and testing typically add months and six-figure costs, raising tangible switching costs for OEMs. Design changes to accept alternative components often ripple through BOMs and manufacturing processes, while long-term partnerships secure priority allocation and co-development advantages.
Commodity materials with cyclical pricing
Wood, aluminum, fiberglass resins and PVC show market-driven volatility—lumber saw swings >50% during 2020–22 while LME aluminum averaged about $2,600/ton in 2024 and PVC/resin spot prices swung roughly 15–30% in 2024. Widely available inputs can still spike from transport and milling bottlenecks. Hedging and multi-sourcing cut exposure but not fully. Marvin’s scale yields measurable negotiating leverage on base commodity pricing.
Logistics and glass fabrication capacity constraints
Tempered/insulated glass units are bulky and freight-sensitive, tying Marvin to regional fabricators and carriers; 2024 industry capacity utilization ran above 80%, boosting supplier leverage in upcycles. Proximity needs limit low-cost alternatives without substantial freight or lead-time penalties. Strategic stocking and vendor-managed inventory can partially blunt this logistical bargaining power.
- Regional fabricators dominant — drives dependency
- Capacity utilization >80% in 2024 — increases supplier power
- Proximity limits alternatives — raises switching costs
- Stocking/VMI — mitigates but does not eliminate leverage
Sustainability and code compliance requirements
Sustainability and code compliance—Energy Star (EPA lists over 3,000 partners), NFRC ratings referenced in model codes, and local specs sharply narrow acceptable supplier lists, while FSC wood, low-VOC finishes and EPDs add qualification hurdles that increase switching costs and documentation burdens.
- Compliance raises switching costs
- Documentation burden increases
- Approved-vendor rosters entrench suppliers
Supplier power tight - glass util >80%, requal costs > $100k
Supplier power is high: top glass makers (AGC, Saint‑Gobain, Guardian, NSG) concentrate supply; tempered/IGU capacity utilization >80% in 2024, lengthening lead times and compressing margins. Component requalification costs (months, >$100k) and certification (Energy Star partners >3,000; NFRC) raise switching costs. Commodities volatile: LME aluminum ~$2,600/ton (2024); PVC/resin ±15–30% (2024).
| Metric | 2024 / Note |
|---|---|
| Glass capacity util. | >80% |
| LME aluminum | ~$2,600/ton |
| PVC/resin volatility | ±15–30% |
| Energy Star partners | >3,000 |
What is included in the product
Detailed Word Document
Comprehensive Porter’s Five Forces analysis for Marvin, uncovering competitive drivers, supplier and buyer power, entry barriers, substitutes, and emerging disruptors, with data‑driven insights to inform strategy, investor materials, and internal planning.
Customizable Excel Spreadsheet
A one-sheet Five Forces tool that converts complex competitive dynamics into an actionable spider/radar chart, letting teams customize pressure levels, swap in their own data and labels, and integrate into decks—no macros or finance background required for fast, confident decisions.
Customers Bargaining Power
Dealer-driven channel influence
Independent dealers and showrooms shape product selection and pricing narratives, with dealer-managed retailers accounting for a dominant share of in-store influence in 2024; their ability to switch brands gives them clear bargaining leverage. Co-op marketing and MDF, typically 1–3% of manufacturer revenue in 2024, can align incentives and offset price pressure. Maintaining strong dealer relationships is crucial to defend margin and shelf space, especially where dealers control primary customer touchpoints.
Professional buyers demand performance
Builders, architects and commercial buyers increasingly specify thermal, acoustic and structural ratings, with 2024 commercial projects demanding LEED or equivalent compliance in 40% of U.S. bids. Submittals, mockups and extended warranties are negotiated, raising buyer leverage and compressing supplier margins. Project bundling drives volume discounts often in the 5–12% range and schedule commitments. Value engineering routinely targets 5–10% cost reductions, pressuring suppliers toward lower-cost lines.
End-user price transparency
Homeowners increasingly compare quotes across brands online and in showrooms, with 72% reporting quote comparison before purchase (2024). Visible promotions and easy financing options amplify price sensitivity and shorten conversion windows. Reviews and promised lead-times materially shape perceived value, while customization reduces direct comparability and often extends decision cycles.
Switching costs vary by project stage
Early-stage projects can swap specifications with low friction, raising buyer leverage; industry reports (2024) show change orders often account for 5–10% of contract value, underscoring early bargaining power. Late-stage re-submittals and remeasurements typically add time and 1–3% extra cost, increasing switching costs, while installed-base replacements favor compatible systems; a 2024 B2B survey found 72% of buyers cite service responsiveness as decisive for retention.
- Low early switching costs — higher buyer leverage
- Late-stage rework adds time/cost — softens pressure
- Installed-base favors compatibility — reduces churn
- Service responsiveness (72% in 2024) — key retention factor
Customization vs standard SKUs trade-offs
Custom sizes, finishes, and configurations reduce direct price comparability and weaken buyer power; 2024 McKinsey found 61% of B2B buyers willing to pay more for customization. Long lead times and change-order risks still drive negotiation, while standard SKUs at big-box rivals anchor price expectations. Clear good-better-best tiering preserves perceived value and margins.
- Customization limits price shopping
- Lead times trigger discounts
- Standard SKUs set price anchors
- Tiering manages value perception
Dealers dominate in-store; 72% compare, 40% LEED bids shape pricing
Dealers hold strong leverage in 2024 with dominant in-store influence and low switching costs; MDF/co-op (1–3% of revenue) partially offsets price pressure. Commercial buyers demand LEED in 40% of bids, driving spec negotiation and 5–12% volume discounts. 72% of homeowners compare quotes; 61% of B2B buyers pay more for customization, reducing direct price sensitivity.
| Buyer segment | 2024 metric | Impact |
|---|---|---|
| Dealers | MDF 1–3% | Price leverage |
| Commercial | 40% LEED bids | Spec leverage |
| Consumers | 72% compare | Price sensitive |
Same Document Delivered
Marvin Porter's Five Forces Analysis
This preview shows Marvin Porter's Five Forces Analysis exactly as delivered—no placeholders or samples. The document here is the full, professionally formatted file you’ll receive instantly after purchase. Ready for immediate download and use, it’s the exact analysis you see.











