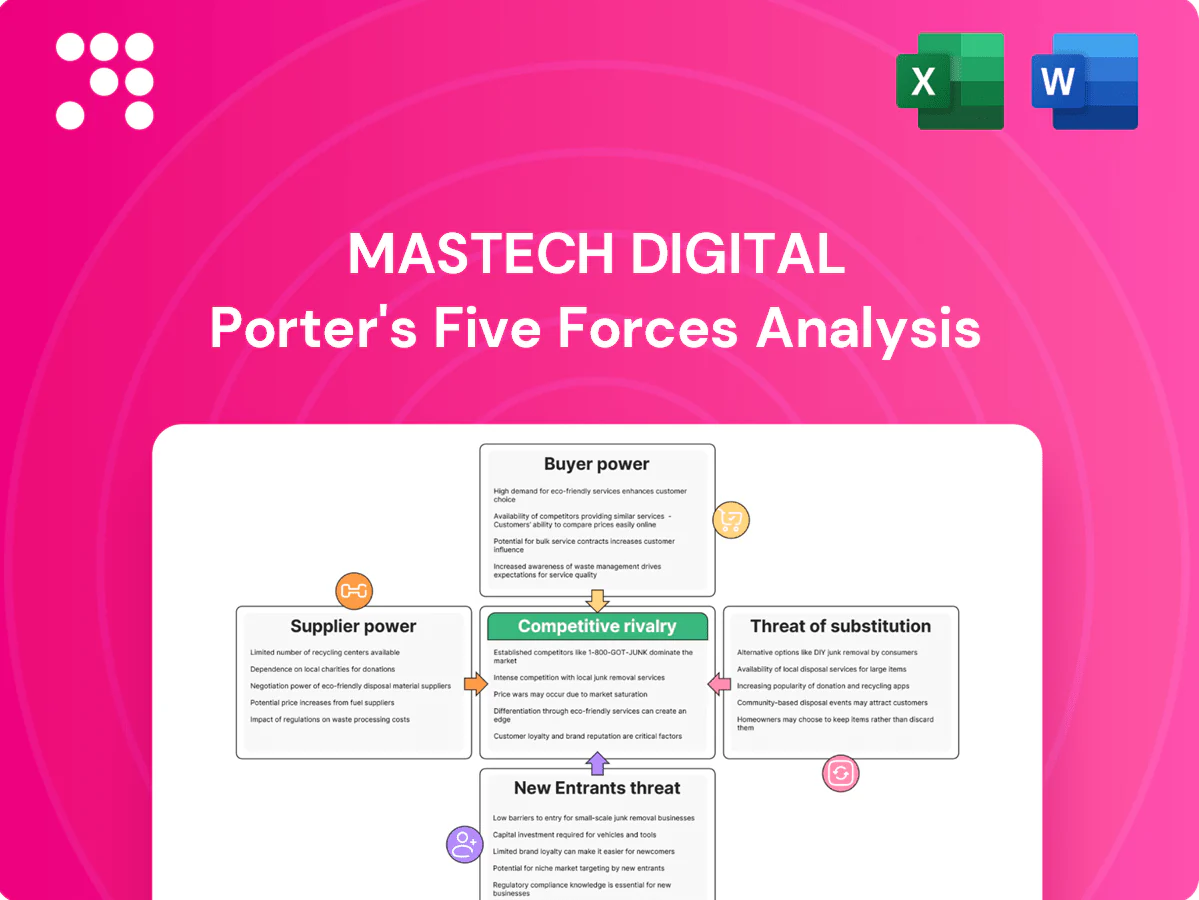
Mastech Digital Porter's Five Forces Analysis

From Overview to Strategy Blueprint
Mastech Digital faces moderate buyer power, niche supplier leverage, intense rivalry from digital services firms, manageable threat of substitutes, and evolving entry barriers driven by tech investments. This snapshot highlights strategic pressure points and growth levers. Unlock the full Porter's Five Forces Analysis for force-by-force ratings, visuals, and actionable recommendations.
Suppliers Bargaining Power

Scarce niche tech talent
Highly skilled data engineers, cloud architects and analytics specialists remain scarce in 2024, increasing supplier leverage; candidates with Snowflake, Databricks, GenAI and MLOps experience command 20–40% premium. This scarcity has pushed time-to-fill for niche roles to roughly 75 days, squeezing project margins. Mastech must invest in talent pipelines and upskilling to reduce dependence.
Dependence on hyperscalers and data platforms
Dependence on hyperscalers (AWS ~32%, Azure ~23%, GCP ~11% of 2024 global cloud IaaS/PaaS) means vendors like AWS, Azure, GCP, Snowflake (FY24 revenue $2.6B) and Databricks drive tooling, pricing and cert paths; partner-program or discount shifts can swing project economics and margins, platform roadmaps create soft lock-in, while strategic partnerships and multi-cloud fluency reduce supplier exposure.

Recruiting channels and job boards power
Aggregators, job boards and LinkedIn mediate access to candidates and have grown reach—LinkedIn surpassed 900 million members and Indeed reports about 250 million monthly visitors—enabling platforms to raise sourcing fees and paid visibility.
Algorithmic visibility now dictates pipeline volume, with employers seeing conversion swings exceeding 30% when placement changes reduce exposure.
Overreliance increases acquisition cost and volatility; building proprietary communities and referral engines can rebalance supplier power.

Offshore/nearshore delivery partners
Offshore/nearshore delivery partners give Mastech Digital scale but create dependency risk; partner performance directly influences SLA attainment and client satisfaction. In 2024 currency swings (roughly 3–6%) and regional wage inflation (approximately 5–8%) pushed rate-card volatility, increasing supplier leverage. Diversified locations (India, Mexico, Philippines) plus outcome-based contracts have reduced that leverage by shifting to variable pay linked to outcomes.
- Dependency risk: partner concentration
- Rate volatility: currency 3–6%, wage inflation 5–8% (2024)
- Operational impact: SLA attainment tied to partner KPIs
- Mitigants: multi-location delivery and outcome-based contracts
Training and certification providers
Access to timely upskilling in new data tools is essential for utilization; certification pricing such as AWS exams at 100–300 USD and limited exam seat availability can bottleneck capability building and create bench time or lost bids when certifications are delayed. Vendor-neutral curricula and internal academies reduce per-learner cost and speed deployment.
- AWS exam fees: 100–300 USD
- Delays → billable utilization loss
- Internal academies lower per-learner cost
Tight margins from 20–40% talent premium and ~75-day hiring
Scarce specialist talent (20–40% premium; 75 days time-to-fill) and hyperscaler dependence (AWS ~32%, Azure ~23%, GCP ~11%) amplify supplier power, squeezing margins; Snowflake FY24 revenue $2.6B underscores platform influence. Aggregators (LinkedIn 900M) raise sourcing costs; currency (3–6%) and wage inflation (5–8%) add rate volatility.
| Metric | Value |
|---|---|
| Talent premium | 20–40% |
| Time-to-fill | ~75 days |
| AWS/Azure/GCP | 32%/23%/11% |
| Snowflake FY24 | $2.6B |
What is included in the product
 Detailed Word Document
Tailored Porter's Five Forces analysis for Mastech Digital uncovering competitive drivers, buyer and supplier power, entry barriers, substitutes and disruptive threats to market share. Detailed, data-backed insights highlight pricing and profitability levers and can be exported/edited for investor decks, strategy plans, or academic use.

 Customizable Excel Spreadsheet
A one-sheet Porter's Five Forces for Mastech Digital—instantly visualizes competitive pressure with an editable spider chart and clean layout for decks or boardrooms.
Customers Bargaining Power

Enterprise procurement and MSP/VMS
Large clients increasingly route spend through MSP/VMS frameworks and standardized rate cards, with adoption among Global 2000 firms estimated at ~65% in 2024, driving rate compression of roughly 10–20%. Competitive bidding via VMS raises transparency and pricing pressure, while preferred supplier lists concentrate spend and heighten vendor switching risk. Vendors defend pricing by demonstrating niche value, outcomes and SLA-backed guarantees.
Moderate switching costs
For staffing, buyers can rotate vendors with limited friction as typical staffing engagements run 6–12 months, enabling frequent re-evaluation; in services switching costs rise sharply once IP, data models and platform implementations are in place. Clear documentation and handover can materially lower perceived lock-in, while Mastech must embed measurable outcomes and governance to increase client stickiness.

Price sensitivity in commoditized roles
Common skill sets face intense rate benchmarking by buyers, with award decisions often driven by 1–3% rate gaps. Small per-hour differences translate to material margin shifts; staffing utilization typically targets 70–80%, so competitive bill-pay spreads directly affect revenue realization. Differentiation via faster delivery, rigorous quality screens, and local availability offsets pure price competition and sustains higher bill rates.

Demand for outcomes over hours
Clients increasingly demand outcome-driven, fixed-fee or milestone analytics deals, shifting delivery risk to vendors and squeezing margins if scopes are weak; in 2024 buyers intensified requirements for clear ROI and accelerators to de-risk purchases. Reusable assets and reference architectures materially lift win rates and profitability by shortening delivery and proving outcomes.
- Outcome-based pricing
- Risk shift to vendors
- ROI and accelerators required
- Reusable assets improve margins
Information-rich buyers
Information-rich buyers use market data, peer benchmarks and reference checks to compress information asymmetry, driving tougher negotiations and shorter contract terms; in 2024 surveys roughly 68% of B2B buyers reported relying on peer benchmarking when evaluating vendors, increasing buyer leverage over pricing and SLAs.
- Buyers leverage: market data, peer benchmarks, references
- Effect: compressed asymmetry, tougher negotiations, shorter terms
- Counter: thought leadership and quantified case studies reframe value
Buyers compress rates; benchmarking, churn and outcome fees drive margin and lock-in
Large buyers (≈65% Global2000 on MSP/VMS in 2024) compress rates ~10–20% and use benchmarking (≈68% reliance) to drive 1–3% rate gaps; staffing churn (6–12m) enables switching while services lock-in raises switching costs. Outcome-based and fixed-fee deals shift risk to vendors; reusable assets and SLA guarantees improve margins and client stickiness.
| Metric | 2024 value | Impact |
|---|---|---|
| MSP/VMS adoption | ≈65% | Rate compression 10–20% |
| Buyer benchmarking | ≈68% | Tougher negotiation |
| Staffing tenure | 6–12 months | High vendor churn |
Same Document Delivered
Mastech Digital Porter's Five Forces Analysis
This preview shows the exact Mastech Digital Porter’s Five Forces analysis you’ll receive—fully formatted, professionally written, and ready for immediate use. No samples or placeholders: the file you see is the same deliverable available for instant download after purchase. Use it as-is for strategy, valuation, or competitive insights.

From Overview to Strategy Blueprint
Mastech Digital faces moderate buyer power, niche supplier leverage, intense rivalry from digital services firms, manageable threat of substitutes, and evolving entry barriers driven by tech investments. This snapshot highlights strategic pressure points and growth levers. Unlock the full Porter's Five Forces Analysis for force-by-force ratings, visuals, and actionable recommendations.
Suppliers Bargaining Power
Scarce niche tech talent
Highly skilled data engineers, cloud architects and analytics specialists remain scarce in 2024, increasing supplier leverage; candidates with Snowflake, Databricks, GenAI and MLOps experience command 20–40% premium. This scarcity has pushed time-to-fill for niche roles to roughly 75 days, squeezing project margins. Mastech must invest in talent pipelines and upskilling to reduce dependence.
Dependence on hyperscalers and data platforms
Dependence on hyperscalers (AWS ~32%, Azure ~23%, GCP ~11% of 2024 global cloud IaaS/PaaS) means vendors like AWS, Azure, GCP, Snowflake (FY24 revenue $2.6B) and Databricks drive tooling, pricing and cert paths; partner-program or discount shifts can swing project economics and margins, platform roadmaps create soft lock-in, while strategic partnerships and multi-cloud fluency reduce supplier exposure.
Recruiting channels and job boards power
Aggregators, job boards and LinkedIn mediate access to candidates and have grown reach—LinkedIn surpassed 900 million members and Indeed reports about 250 million monthly visitors—enabling platforms to raise sourcing fees and paid visibility.
Algorithmic visibility now dictates pipeline volume, with employers seeing conversion swings exceeding 30% when placement changes reduce exposure.
Overreliance increases acquisition cost and volatility; building proprietary communities and referral engines can rebalance supplier power.
Offshore/nearshore delivery partners
Offshore/nearshore delivery partners give Mastech Digital scale but create dependency risk; partner performance directly influences SLA attainment and client satisfaction. In 2024 currency swings (roughly 3–6%) and regional wage inflation (approximately 5–8%) pushed rate-card volatility, increasing supplier leverage. Diversified locations (India, Mexico, Philippines) plus outcome-based contracts have reduced that leverage by shifting to variable pay linked to outcomes.
- Dependency risk: partner concentration
- Rate volatility: currency 3–6%, wage inflation 5–8% (2024)
- Operational impact: SLA attainment tied to partner KPIs
- Mitigants: multi-location delivery and outcome-based contracts
Training and certification providers
Access to timely upskilling in new data tools is essential for utilization; certification pricing such as AWS exams at 100–300 USD and limited exam seat availability can bottleneck capability building and create bench time or lost bids when certifications are delayed. Vendor-neutral curricula and internal academies reduce per-learner cost and speed deployment.
- AWS exam fees: 100–300 USD
- Delays → billable utilization loss
- Internal academies lower per-learner cost
Tight margins from 20–40% talent premium and ~75-day hiring
Scarce specialist talent (20–40% premium; 75 days time-to-fill) and hyperscaler dependence (AWS ~32%, Azure ~23%, GCP ~11%) amplify supplier power, squeezing margins; Snowflake FY24 revenue $2.6B underscores platform influence. Aggregators (LinkedIn 900M) raise sourcing costs; currency (3–6%) and wage inflation (5–8%) add rate volatility.
| Metric | Value |
|---|---|
| Talent premium | 20–40% |
| Time-to-fill | ~75 days |
| AWS/Azure/GCP | 32%/23%/11% |
| Snowflake FY24 | $2.6B |
What is included in the product
Detailed Word Document
Tailored Porter's Five Forces analysis for Mastech Digital uncovering competitive drivers, buyer and supplier power, entry barriers, substitutes and disruptive threats to market share. Detailed, data-backed insights highlight pricing and profitability levers and can be exported/edited for investor decks, strategy plans, or academic use.
Customizable Excel Spreadsheet
A one-sheet Porter's Five Forces for Mastech Digital—instantly visualizes competitive pressure with an editable spider chart and clean layout for decks or boardrooms.
Customers Bargaining Power
Enterprise procurement and MSP/VMS
Large clients increasingly route spend through MSP/VMS frameworks and standardized rate cards, with adoption among Global 2000 firms estimated at ~65% in 2024, driving rate compression of roughly 10–20%. Competitive bidding via VMS raises transparency and pricing pressure, while preferred supplier lists concentrate spend and heighten vendor switching risk. Vendors defend pricing by demonstrating niche value, outcomes and SLA-backed guarantees.
Moderate switching costs
For staffing, buyers can rotate vendors with limited friction as typical staffing engagements run 6–12 months, enabling frequent re-evaluation; in services switching costs rise sharply once IP, data models and platform implementations are in place. Clear documentation and handover can materially lower perceived lock-in, while Mastech must embed measurable outcomes and governance to increase client stickiness.
Price sensitivity in commoditized roles
Common skill sets face intense rate benchmarking by buyers, with award decisions often driven by 1–3% rate gaps. Small per-hour differences translate to material margin shifts; staffing utilization typically targets 70–80%, so competitive bill-pay spreads directly affect revenue realization. Differentiation via faster delivery, rigorous quality screens, and local availability offsets pure price competition and sustains higher bill rates.
Demand for outcomes over hours
Clients increasingly demand outcome-driven, fixed-fee or milestone analytics deals, shifting delivery risk to vendors and squeezing margins if scopes are weak; in 2024 buyers intensified requirements for clear ROI and accelerators to de-risk purchases. Reusable assets and reference architectures materially lift win rates and profitability by shortening delivery and proving outcomes.
- Outcome-based pricing
- Risk shift to vendors
- ROI and accelerators required
- Reusable assets improve margins
Information-rich buyers
Information-rich buyers use market data, peer benchmarks and reference checks to compress information asymmetry, driving tougher negotiations and shorter contract terms; in 2024 surveys roughly 68% of B2B buyers reported relying on peer benchmarking when evaluating vendors, increasing buyer leverage over pricing and SLAs.
- Buyers leverage: market data, peer benchmarks, references
- Effect: compressed asymmetry, tougher negotiations, shorter terms
- Counter: thought leadership and quantified case studies reframe value
Buyers compress rates; benchmarking, churn and outcome fees drive margin and lock-in
Large buyers (≈65% Global2000 on MSP/VMS in 2024) compress rates ~10–20% and use benchmarking (≈68% reliance) to drive 1–3% rate gaps; staffing churn (6–12m) enables switching while services lock-in raises switching costs. Outcome-based and fixed-fee deals shift risk to vendors; reusable assets and SLA guarantees improve margins and client stickiness.
| Metric | 2024 value | Impact |
|---|---|---|
| MSP/VMS adoption | ≈65% | Rate compression 10–20% |
| Buyer benchmarking | ≈68% | Tougher negotiation |
| Staffing tenure | 6–12 months | High vendor churn |
Same Document Delivered
Mastech Digital Porter's Five Forces Analysis
This preview shows the exact Mastech Digital Porter’s Five Forces analysis you’ll receive—fully formatted, professionally written, and ready for immediate use. No samples or placeholders: the file you see is the same deliverable available for instant download after purchase. Use it as-is for strategy, valuation, or competitive insights.
Description
From Overview to Strategy Blueprint
Mastech Digital faces moderate buyer power, niche supplier leverage, intense rivalry from digital services firms, manageable threat of substitutes, and evolving entry barriers driven by tech investments. This snapshot highlights strategic pressure points and growth levers. Unlock the full Porter's Five Forces Analysis for force-by-force ratings, visuals, and actionable recommendations.
Suppliers Bargaining Power
Scarce niche tech talent
Highly skilled data engineers, cloud architects and analytics specialists remain scarce in 2024, increasing supplier leverage; candidates with Snowflake, Databricks, GenAI and MLOps experience command 20–40% premium. This scarcity has pushed time-to-fill for niche roles to roughly 75 days, squeezing project margins. Mastech must invest in talent pipelines and upskilling to reduce dependence.
Dependence on hyperscalers and data platforms
Dependence on hyperscalers (AWS ~32%, Azure ~23%, GCP ~11% of 2024 global cloud IaaS/PaaS) means vendors like AWS, Azure, GCP, Snowflake (FY24 revenue $2.6B) and Databricks drive tooling, pricing and cert paths; partner-program or discount shifts can swing project economics and margins, platform roadmaps create soft lock-in, while strategic partnerships and multi-cloud fluency reduce supplier exposure.
Recruiting channels and job boards power
Aggregators, job boards and LinkedIn mediate access to candidates and have grown reach—LinkedIn surpassed 900 million members and Indeed reports about 250 million monthly visitors—enabling platforms to raise sourcing fees and paid visibility.
Algorithmic visibility now dictates pipeline volume, with employers seeing conversion swings exceeding 30% when placement changes reduce exposure.
Overreliance increases acquisition cost and volatility; building proprietary communities and referral engines can rebalance supplier power.
Offshore/nearshore delivery partners
Offshore/nearshore delivery partners give Mastech Digital scale but create dependency risk; partner performance directly influences SLA attainment and client satisfaction. In 2024 currency swings (roughly 3–6%) and regional wage inflation (approximately 5–8%) pushed rate-card volatility, increasing supplier leverage. Diversified locations (India, Mexico, Philippines) plus outcome-based contracts have reduced that leverage by shifting to variable pay linked to outcomes.
- Dependency risk: partner concentration
- Rate volatility: currency 3–6%, wage inflation 5–8% (2024)
- Operational impact: SLA attainment tied to partner KPIs
- Mitigants: multi-location delivery and outcome-based contracts
Training and certification providers
Access to timely upskilling in new data tools is essential for utilization; certification pricing such as AWS exams at 100–300 USD and limited exam seat availability can bottleneck capability building and create bench time or lost bids when certifications are delayed. Vendor-neutral curricula and internal academies reduce per-learner cost and speed deployment.
- AWS exam fees: 100–300 USD
- Delays → billable utilization loss
- Internal academies lower per-learner cost
Tight margins from 20–40% talent premium and ~75-day hiring
Scarce specialist talent (20–40% premium; 75 days time-to-fill) and hyperscaler dependence (AWS ~32%, Azure ~23%, GCP ~11%) amplify supplier power, squeezing margins; Snowflake FY24 revenue $2.6B underscores platform influence. Aggregators (LinkedIn 900M) raise sourcing costs; currency (3–6%) and wage inflation (5–8%) add rate volatility.
| Metric | Value |
|---|---|
| Talent premium | 20–40% |
| Time-to-fill | ~75 days |
| AWS/Azure/GCP | 32%/23%/11% |
| Snowflake FY24 | $2.6B |
What is included in the product
Detailed Word Document
Tailored Porter's Five Forces analysis for Mastech Digital uncovering competitive drivers, buyer and supplier power, entry barriers, substitutes and disruptive threats to market share. Detailed, data-backed insights highlight pricing and profitability levers and can be exported/edited for investor decks, strategy plans, or academic use.
Customizable Excel Spreadsheet
A one-sheet Porter's Five Forces for Mastech Digital—instantly visualizes competitive pressure with an editable spider chart and clean layout for decks or boardrooms.
Customers Bargaining Power
Enterprise procurement and MSP/VMS
Large clients increasingly route spend through MSP/VMS frameworks and standardized rate cards, with adoption among Global 2000 firms estimated at ~65% in 2024, driving rate compression of roughly 10–20%. Competitive bidding via VMS raises transparency and pricing pressure, while preferred supplier lists concentrate spend and heighten vendor switching risk. Vendors defend pricing by demonstrating niche value, outcomes and SLA-backed guarantees.
Moderate switching costs
For staffing, buyers can rotate vendors with limited friction as typical staffing engagements run 6–12 months, enabling frequent re-evaluation; in services switching costs rise sharply once IP, data models and platform implementations are in place. Clear documentation and handover can materially lower perceived lock-in, while Mastech must embed measurable outcomes and governance to increase client stickiness.
Price sensitivity in commoditized roles
Common skill sets face intense rate benchmarking by buyers, with award decisions often driven by 1–3% rate gaps. Small per-hour differences translate to material margin shifts; staffing utilization typically targets 70–80%, so competitive bill-pay spreads directly affect revenue realization. Differentiation via faster delivery, rigorous quality screens, and local availability offsets pure price competition and sustains higher bill rates.
Demand for outcomes over hours
Clients increasingly demand outcome-driven, fixed-fee or milestone analytics deals, shifting delivery risk to vendors and squeezing margins if scopes are weak; in 2024 buyers intensified requirements for clear ROI and accelerators to de-risk purchases. Reusable assets and reference architectures materially lift win rates and profitability by shortening delivery and proving outcomes.
- Outcome-based pricing
- Risk shift to vendors
- ROI and accelerators required
- Reusable assets improve margins
Information-rich buyers
Information-rich buyers use market data, peer benchmarks and reference checks to compress information asymmetry, driving tougher negotiations and shorter contract terms; in 2024 surveys roughly 68% of B2B buyers reported relying on peer benchmarking when evaluating vendors, increasing buyer leverage over pricing and SLAs.
- Buyers leverage: market data, peer benchmarks, references
- Effect: compressed asymmetry, tougher negotiations, shorter terms
- Counter: thought leadership and quantified case studies reframe value
Buyers compress rates; benchmarking, churn and outcome fees drive margin and lock-in
Large buyers (≈65% Global2000 on MSP/VMS in 2024) compress rates ~10–20% and use benchmarking (≈68% reliance) to drive 1–3% rate gaps; staffing churn (6–12m) enables switching while services lock-in raises switching costs. Outcome-based and fixed-fee deals shift risk to vendors; reusable assets and SLA guarantees improve margins and client stickiness.
| Metric | 2024 value | Impact |
|---|---|---|
| MSP/VMS adoption | ≈65% | Rate compression 10–20% |
| Buyer benchmarking | ≈68% | Tougher negotiation |
| Staffing tenure | 6–12 months | High vendor churn |
Same Document Delivered
Mastech Digital Porter's Five Forces Analysis
This preview shows the exact Mastech Digital Porter’s Five Forces analysis you’ll receive—fully formatted, professionally written, and ready for immediate use. No samples or placeholders: the file you see is the same deliverable available for instant download after purchase. Use it as-is for strategy, valuation, or competitive insights.











