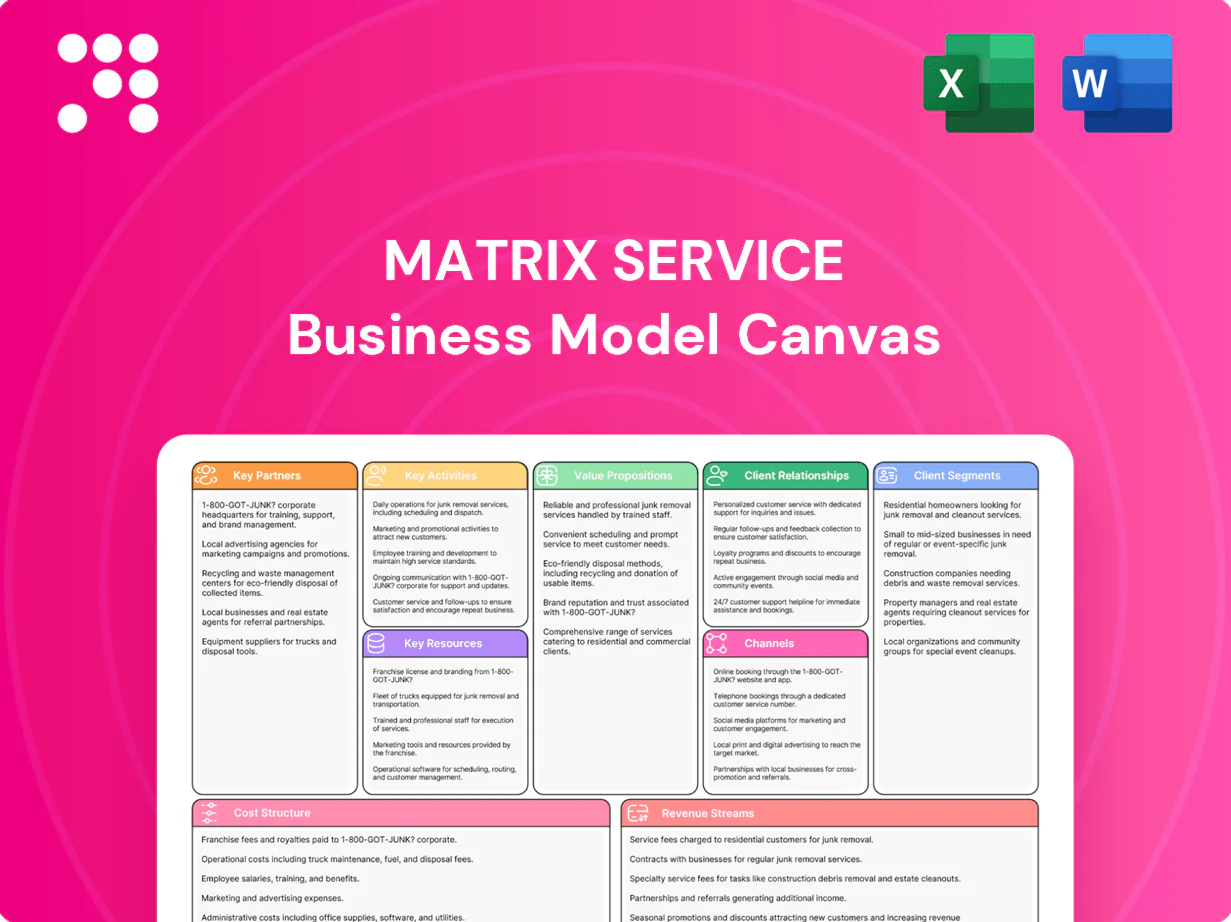
Matrix Service Business Model Canvas

Unlock a concise, actionable Business Model Canvas to benchmark and accelerate strategic growth
Unlock the full strategic blueprint behind Matrix Service’s business model in a concise, actionable Business Model Canvas. This downloadable file laid out section-by-section reveals value propositions, revenue streams, key partners and cost structure. Ideal for investors, consultants, and founders seeking a ready-to-use strategic tool—purchase the full canvas to benchmark, adapt, and accelerate growth.
Partnerships

Technology licensors & OEMs
Partnerships with process technology licensors and critical OEMs enable compliant, efficient facility designs and accelerated FEED packages, often shortening engineering timelines by roughly 20%. These alliances de-risk equipment integration and can reduce EPC change orders and schedule slippage. Preferred supplier status frequently improves pricing by 5–15% and trims lead times by ~20–30%. Co-marketing with licensors/OEMs opens access to complex, high-value projects and joint bids.
Steel & materials suppliers
Strategic agreements with plate steel mills, pipe vendors and specialty alloy suppliers secure availability for tanks and process units and rely on mill certifications such as ASME Section VIII and NACE MR0175 to ensure code compliance. Volume contracts spanning typical industry terms stabilize input costs and schedules while enabling forecasting. Logistics partners provide just-in-time deliveries to sites and shops to minimize on-site inventory and downtime.

Specialty subcontractors
Alliances with civil, electrical, instrumentation, coating, and insulation subcontractors expand Matrix Service’s capacity and capabilities, enabling turnkey scopes on projects often valued up to tens of millions; prequalified networks support rapid mobilization—commonly within 72 hours—for turnarounds that can deploy 200–1,000 workers. Shared safety and QA standards ensure consistency and reduced incident rates, while regional partners satisfy local labor and licensing requirements.

Engineering software & BIM providers
Partnerships with CAD, BIM and project-controls vendors standardize toolsets across Matrix Service, improving constructability and automated clash detection; the global BIM market was valued at about $8.56 billion in 2023 and adoption cuts rework by ~30–40%, accelerating delivery. Integrated models and data interoperability shorten design-to-fabrication cycles by up to ~25%, while vendor support and 99.9% SLA-class uptime bolster cybersecurity and system availability for project-critical systems.
- Standardized toolsets: improve cross-team coordination
- Clash detection: reduces on-site rework ~30–40%
- Interoperability: trims design-to-fab ~25%
- Vendor support: 99.9% uptime, enhanced cybersecurity
Regulatory, safety, and labor bodies
Engagement with OSHA, API, ASME and local authorities ensures Matrix Service meets industry codes and inspection requirements. Union halls and workforce development programs supply skilled craft to a US construction workforce of about 7.5 million, with construction unionization near 12.5% (2023 BLS). Joint safety initiatives raise performance benchmarks and early permitting coordination reduces approval-related schedule risk.
- Regulatory alignment: OSHA/API/ASME
- Skilled labor: 7.5M workforce; ~12.5% union (2023 BLS)
- Safety: joint initiatives raise benchmarks
- Permitting: early coordination lowers schedule risk
Partnerships cut FEED time ~20%, pricing 5-15%
Partnerships with licensors/OEMs accelerate FEED and cut engineering timelines ~20%, reduce change orders and improve pricing 5–15%. Supplier contracts (plate, pipe, alloys) and JIT logistics stabilize costs and shorten lead times ~20–30%. Subcontractor networks enable turnkey mobilization in ~72 hours for 200–1,000 workers; shared QA/safety lowers incident rates.
| Metric | Value |
|---|---|
| Engineering time | -20% |
| Pricing improvement | 5–15% |
| Lead time reduction | 20–30% |
| Mobilization | 72 hrs / 200–1,000 workers |
What is included in the product
 Detailed Word Document
A comprehensive Business Model Canvas tailored to Matrix Service’s engineering and construction strategy, covering customer segments, channels, value propositions and cost/revenue structures in the 9 classic BMC blocks. Ideal for investor presentations and internal planning, it includes competitive advantage analysis and linked SWOT insights to validate growth and operational decisions.

 Customizable Excel Spreadsheet
High-level view of Matrix Service’s business model with editable cells that eliminate hours of formatting and align teams quickly for strategic decisions.
Activities

EPC project delivery
End-to-end EPC delivery for tanks, terminals, and process facilities covers FEED, detailed design, procurement, and field execution to meet client specifications. Scope includes vendor sourcing, quality control, and integrated construction management with strict focus on schedule, safety, and budget adherence. Commissioning and formal handover confirm operational readiness and performance verification.
Fabrication & modularization
Shop fabrication of tank components, pipe spools, and structural modules enables controlled workflows and higher yield rates, supporting throughput targets like industry shop utilization improvements of 15–30% year-over-year. Modular strategies cut on-site hours and risk—McKinsey reports schedule reductions up to 50%—and lower rework rates. Rigorous QA/QC and code stamping (ASME/API standards) ensure compliance. Detailed logistics planning assures on-time site integration and sequence control.

Maintenance, repair & turnarounds
Planned and emergent maintenance, inspections, repairs, retrofits and outage execution across energy and industrial sites deliver both routine and emergency services; rapid mobilization can reduce asset downtime by up to 40% in similar turnarounds. Typical turnaround teams restore operations within 24–72 hours for critical outages, cutting lost-production costs that can exceed hundreds of thousands per day. Reliability-focused interventions extend asset life by 5–15 years through targeted retrofits and repairs.

Project controls & QHSE
Robust planning, estimating, scheduling and cost control underpin delivery, with project controls shown to reduce schedule variance by up to 20% and contain industry-average cost overruns of ~29% in 2024. Integrated safety and quality systems drive near-zero incidents and lower total recordable incident rates. Active risk management mitigates change, limiting claims that can erode margins. Transparent reporting supports client governance and auditability.
- Planning: schedule variance -20%
- Cost: 2024 avg overruns ~29%
- QHSE: drives near-zero incidents
- Risk: reduces claims exposure
- Reporting: enables client governance
Business development & client management
Business development focuses RFP pursuit, strategic alliances and negotiated work, with a 12% RFP pipeline growth in 2024 guiding target selection. Early solutioning with constructability input raised win rates by as much as 25% on major EPC bids, while key account management deepens relationships and increases repeat revenue. Ongoing market intelligence in 2024 shifted capacity allocation and pricing to higher-margin segments.
- Pursuit strategy: prioritize RFPs, alliances, negotiated deals
- Solutioning: constructability input → +25% win rate
- Key accounts: deeper share of wallet
- Market intel 2024: reallocates capacity, informs pricing
EPC drives efficiency: schedule variance -20%, shop use +20%, downtime -40%
End-to-end EPC (FEED→commissioning) delivers tanks, terminals, process facilities with strict schedule, safety, budget controls; project controls cut schedule variance ~20% in 2024. Shop fabrication and modular construction raised shop utilization ~20% and cut onsite hours ~30%. Turnaround and maintenance reduce downtime up to 40% and extend asset life 5–15 years. BD/solutioning lifted win rates ~25% in 2024.
| Metric | 2024 Value |
|---|---|
| Schedule variance | -20% |
| Cost overruns (avg) | ~29% |
| Shop utilization | +20% |
| Downtime reduction | up to 40% |
| Win-rate uplift | +25% |
Full Document Unlocks After Purchase
Business Model Canvas
The document previewed here is the exact Matrix Service Business Model Canvas you will receive—no mockups or samples. Upon purchase you’ll get the complete, editable file formatted exactly as shown, ready for presentation or editing in Word and Excel. No hidden content, instant download access.

Unlock a concise, actionable Business Model Canvas to benchmark and accelerate strategic growth
Unlock the full strategic blueprint behind Matrix Service’s business model in a concise, actionable Business Model Canvas. This downloadable file laid out section-by-section reveals value propositions, revenue streams, key partners and cost structure. Ideal for investors, consultants, and founders seeking a ready-to-use strategic tool—purchase the full canvas to benchmark, adapt, and accelerate growth.
Partnerships
Technology licensors & OEMs
Partnerships with process technology licensors and critical OEMs enable compliant, efficient facility designs and accelerated FEED packages, often shortening engineering timelines by roughly 20%. These alliances de-risk equipment integration and can reduce EPC change orders and schedule slippage. Preferred supplier status frequently improves pricing by 5–15% and trims lead times by ~20–30%. Co-marketing with licensors/OEMs opens access to complex, high-value projects and joint bids.
Steel & materials suppliers
Strategic agreements with plate steel mills, pipe vendors and specialty alloy suppliers secure availability for tanks and process units and rely on mill certifications such as ASME Section VIII and NACE MR0175 to ensure code compliance. Volume contracts spanning typical industry terms stabilize input costs and schedules while enabling forecasting. Logistics partners provide just-in-time deliveries to sites and shops to minimize on-site inventory and downtime.
Specialty subcontractors
Alliances with civil, electrical, instrumentation, coating, and insulation subcontractors expand Matrix Service’s capacity and capabilities, enabling turnkey scopes on projects often valued up to tens of millions; prequalified networks support rapid mobilization—commonly within 72 hours—for turnarounds that can deploy 200–1,000 workers. Shared safety and QA standards ensure consistency and reduced incident rates, while regional partners satisfy local labor and licensing requirements.
Engineering software & BIM providers
Partnerships with CAD, BIM and project-controls vendors standardize toolsets across Matrix Service, improving constructability and automated clash detection; the global BIM market was valued at about $8.56 billion in 2023 and adoption cuts rework by ~30–40%, accelerating delivery. Integrated models and data interoperability shorten design-to-fabrication cycles by up to ~25%, while vendor support and 99.9% SLA-class uptime bolster cybersecurity and system availability for project-critical systems.
- Standardized toolsets: improve cross-team coordination
- Clash detection: reduces on-site rework ~30–40%
- Interoperability: trims design-to-fab ~25%
- Vendor support: 99.9% uptime, enhanced cybersecurity
Regulatory, safety, and labor bodies
Engagement with OSHA, API, ASME and local authorities ensures Matrix Service meets industry codes and inspection requirements. Union halls and workforce development programs supply skilled craft to a US construction workforce of about 7.5 million, with construction unionization near 12.5% (2023 BLS). Joint safety initiatives raise performance benchmarks and early permitting coordination reduces approval-related schedule risk.
- Regulatory alignment: OSHA/API/ASME
- Skilled labor: 7.5M workforce; ~12.5% union (2023 BLS)
- Safety: joint initiatives raise benchmarks
- Permitting: early coordination lowers schedule risk
Partnerships cut FEED time ~20%, pricing 5-15%
Partnerships with licensors/OEMs accelerate FEED and cut engineering timelines ~20%, reduce change orders and improve pricing 5–15%. Supplier contracts (plate, pipe, alloys) and JIT logistics stabilize costs and shorten lead times ~20–30%. Subcontractor networks enable turnkey mobilization in ~72 hours for 200–1,000 workers; shared QA/safety lowers incident rates.
| Metric | Value |
|---|---|
| Engineering time | -20% |
| Pricing improvement | 5–15% |
| Lead time reduction | 20–30% |
| Mobilization | 72 hrs / 200–1,000 workers |
What is included in the product
Detailed Word Document
A comprehensive Business Model Canvas tailored to Matrix Service’s engineering and construction strategy, covering customer segments, channels, value propositions and cost/revenue structures in the 9 classic BMC blocks. Ideal for investor presentations and internal planning, it includes competitive advantage analysis and linked SWOT insights to validate growth and operational decisions.
Customizable Excel Spreadsheet
High-level view of Matrix Service’s business model with editable cells that eliminate hours of formatting and align teams quickly for strategic decisions.
Activities
EPC project delivery
End-to-end EPC delivery for tanks, terminals, and process facilities covers FEED, detailed design, procurement, and field execution to meet client specifications. Scope includes vendor sourcing, quality control, and integrated construction management with strict focus on schedule, safety, and budget adherence. Commissioning and formal handover confirm operational readiness and performance verification.
Fabrication & modularization
Shop fabrication of tank components, pipe spools, and structural modules enables controlled workflows and higher yield rates, supporting throughput targets like industry shop utilization improvements of 15–30% year-over-year. Modular strategies cut on-site hours and risk—McKinsey reports schedule reductions up to 50%—and lower rework rates. Rigorous QA/QC and code stamping (ASME/API standards) ensure compliance. Detailed logistics planning assures on-time site integration and sequence control.
Maintenance, repair & turnarounds
Planned and emergent maintenance, inspections, repairs, retrofits and outage execution across energy and industrial sites deliver both routine and emergency services; rapid mobilization can reduce asset downtime by up to 40% in similar turnarounds. Typical turnaround teams restore operations within 24–72 hours for critical outages, cutting lost-production costs that can exceed hundreds of thousands per day. Reliability-focused interventions extend asset life by 5–15 years through targeted retrofits and repairs.
Project controls & QHSE
Robust planning, estimating, scheduling and cost control underpin delivery, with project controls shown to reduce schedule variance by up to 20% and contain industry-average cost overruns of ~29% in 2024. Integrated safety and quality systems drive near-zero incidents and lower total recordable incident rates. Active risk management mitigates change, limiting claims that can erode margins. Transparent reporting supports client governance and auditability.
- Planning: schedule variance -20%
- Cost: 2024 avg overruns ~29%
- QHSE: drives near-zero incidents
- Risk: reduces claims exposure
- Reporting: enables client governance
Business development & client management
Business development focuses RFP pursuit, strategic alliances and negotiated work, with a 12% RFP pipeline growth in 2024 guiding target selection. Early solutioning with constructability input raised win rates by as much as 25% on major EPC bids, while key account management deepens relationships and increases repeat revenue. Ongoing market intelligence in 2024 shifted capacity allocation and pricing to higher-margin segments.
- Pursuit strategy: prioritize RFPs, alliances, negotiated deals
- Solutioning: constructability input → +25% win rate
- Key accounts: deeper share of wallet
- Market intel 2024: reallocates capacity, informs pricing
EPC drives efficiency: schedule variance -20%, shop use +20%, downtime -40%
End-to-end EPC (FEED→commissioning) delivers tanks, terminals, process facilities with strict schedule, safety, budget controls; project controls cut schedule variance ~20% in 2024. Shop fabrication and modular construction raised shop utilization ~20% and cut onsite hours ~30%. Turnaround and maintenance reduce downtime up to 40% and extend asset life 5–15 years. BD/solutioning lifted win rates ~25% in 2024.
| Metric | 2024 Value |
|---|---|
| Schedule variance | -20% |
| Cost overruns (avg) | ~29% |
| Shop utilization | +20% |
| Downtime reduction | up to 40% |
| Win-rate uplift | +25% |
Full Document Unlocks After Purchase
Business Model Canvas
The document previewed here is the exact Matrix Service Business Model Canvas you will receive—no mockups or samples. Upon purchase you’ll get the complete, editable file formatted exactly as shown, ready for presentation or editing in Word and Excel. No hidden content, instant download access.
Original: $10.00
-65%$10.00
$3.50Description
Unlock a concise, actionable Business Model Canvas to benchmark and accelerate strategic growth
Unlock the full strategic blueprint behind Matrix Service’s business model in a concise, actionable Business Model Canvas. This downloadable file laid out section-by-section reveals value propositions, revenue streams, key partners and cost structure. Ideal for investors, consultants, and founders seeking a ready-to-use strategic tool—purchase the full canvas to benchmark, adapt, and accelerate growth.
Partnerships
Technology licensors & OEMs
Partnerships with process technology licensors and critical OEMs enable compliant, efficient facility designs and accelerated FEED packages, often shortening engineering timelines by roughly 20%. These alliances de-risk equipment integration and can reduce EPC change orders and schedule slippage. Preferred supplier status frequently improves pricing by 5–15% and trims lead times by ~20–30%. Co-marketing with licensors/OEMs opens access to complex, high-value projects and joint bids.
Steel & materials suppliers
Strategic agreements with plate steel mills, pipe vendors and specialty alloy suppliers secure availability for tanks and process units and rely on mill certifications such as ASME Section VIII and NACE MR0175 to ensure code compliance. Volume contracts spanning typical industry terms stabilize input costs and schedules while enabling forecasting. Logistics partners provide just-in-time deliveries to sites and shops to minimize on-site inventory and downtime.
Specialty subcontractors
Alliances with civil, electrical, instrumentation, coating, and insulation subcontractors expand Matrix Service’s capacity and capabilities, enabling turnkey scopes on projects often valued up to tens of millions; prequalified networks support rapid mobilization—commonly within 72 hours—for turnarounds that can deploy 200–1,000 workers. Shared safety and QA standards ensure consistency and reduced incident rates, while regional partners satisfy local labor and licensing requirements.
Engineering software & BIM providers
Partnerships with CAD, BIM and project-controls vendors standardize toolsets across Matrix Service, improving constructability and automated clash detection; the global BIM market was valued at about $8.56 billion in 2023 and adoption cuts rework by ~30–40%, accelerating delivery. Integrated models and data interoperability shorten design-to-fabrication cycles by up to ~25%, while vendor support and 99.9% SLA-class uptime bolster cybersecurity and system availability for project-critical systems.
- Standardized toolsets: improve cross-team coordination
- Clash detection: reduces on-site rework ~30–40%
- Interoperability: trims design-to-fab ~25%
- Vendor support: 99.9% uptime, enhanced cybersecurity
Regulatory, safety, and labor bodies
Engagement with OSHA, API, ASME and local authorities ensures Matrix Service meets industry codes and inspection requirements. Union halls and workforce development programs supply skilled craft to a US construction workforce of about 7.5 million, with construction unionization near 12.5% (2023 BLS). Joint safety initiatives raise performance benchmarks and early permitting coordination reduces approval-related schedule risk.
- Regulatory alignment: OSHA/API/ASME
- Skilled labor: 7.5M workforce; ~12.5% union (2023 BLS)
- Safety: joint initiatives raise benchmarks
- Permitting: early coordination lowers schedule risk
Partnerships cut FEED time ~20%, pricing 5-15%
Partnerships with licensors/OEMs accelerate FEED and cut engineering timelines ~20%, reduce change orders and improve pricing 5–15%. Supplier contracts (plate, pipe, alloys) and JIT logistics stabilize costs and shorten lead times ~20–30%. Subcontractor networks enable turnkey mobilization in ~72 hours for 200–1,000 workers; shared QA/safety lowers incident rates.
| Metric | Value |
|---|---|
| Engineering time | -20% |
| Pricing improvement | 5–15% |
| Lead time reduction | 20–30% |
| Mobilization | 72 hrs / 200–1,000 workers |
What is included in the product
Detailed Word Document
A comprehensive Business Model Canvas tailored to Matrix Service’s engineering and construction strategy, covering customer segments, channels, value propositions and cost/revenue structures in the 9 classic BMC blocks. Ideal for investor presentations and internal planning, it includes competitive advantage analysis and linked SWOT insights to validate growth and operational decisions.
Customizable Excel Spreadsheet
High-level view of Matrix Service’s business model with editable cells that eliminate hours of formatting and align teams quickly for strategic decisions.
Activities
EPC project delivery
End-to-end EPC delivery for tanks, terminals, and process facilities covers FEED, detailed design, procurement, and field execution to meet client specifications. Scope includes vendor sourcing, quality control, and integrated construction management with strict focus on schedule, safety, and budget adherence. Commissioning and formal handover confirm operational readiness and performance verification.
Fabrication & modularization
Shop fabrication of tank components, pipe spools, and structural modules enables controlled workflows and higher yield rates, supporting throughput targets like industry shop utilization improvements of 15–30% year-over-year. Modular strategies cut on-site hours and risk—McKinsey reports schedule reductions up to 50%—and lower rework rates. Rigorous QA/QC and code stamping (ASME/API standards) ensure compliance. Detailed logistics planning assures on-time site integration and sequence control.
Maintenance, repair & turnarounds
Planned and emergent maintenance, inspections, repairs, retrofits and outage execution across energy and industrial sites deliver both routine and emergency services; rapid mobilization can reduce asset downtime by up to 40% in similar turnarounds. Typical turnaround teams restore operations within 24–72 hours for critical outages, cutting lost-production costs that can exceed hundreds of thousands per day. Reliability-focused interventions extend asset life by 5–15 years through targeted retrofits and repairs.
Project controls & QHSE
Robust planning, estimating, scheduling and cost control underpin delivery, with project controls shown to reduce schedule variance by up to 20% and contain industry-average cost overruns of ~29% in 2024. Integrated safety and quality systems drive near-zero incidents and lower total recordable incident rates. Active risk management mitigates change, limiting claims that can erode margins. Transparent reporting supports client governance and auditability.
- Planning: schedule variance -20%
- Cost: 2024 avg overruns ~29%
- QHSE: drives near-zero incidents
- Risk: reduces claims exposure
- Reporting: enables client governance
Business development & client management
Business development focuses RFP pursuit, strategic alliances and negotiated work, with a 12% RFP pipeline growth in 2024 guiding target selection. Early solutioning with constructability input raised win rates by as much as 25% on major EPC bids, while key account management deepens relationships and increases repeat revenue. Ongoing market intelligence in 2024 shifted capacity allocation and pricing to higher-margin segments.
- Pursuit strategy: prioritize RFPs, alliances, negotiated deals
- Solutioning: constructability input → +25% win rate
- Key accounts: deeper share of wallet
- Market intel 2024: reallocates capacity, informs pricing
EPC drives efficiency: schedule variance -20%, shop use +20%, downtime -40%
End-to-end EPC (FEED→commissioning) delivers tanks, terminals, process facilities with strict schedule, safety, budget controls; project controls cut schedule variance ~20% in 2024. Shop fabrication and modular construction raised shop utilization ~20% and cut onsite hours ~30%. Turnaround and maintenance reduce downtime up to 40% and extend asset life 5–15 years. BD/solutioning lifted win rates ~25% in 2024.
| Metric | 2024 Value |
|---|---|
| Schedule variance | -20% |
| Cost overruns (avg) | ~29% |
| Shop utilization | +20% |
| Downtime reduction | up to 40% |
| Win-rate uplift | +25% |
Full Document Unlocks After Purchase
Business Model Canvas
The document previewed here is the exact Matrix Service Business Model Canvas you will receive—no mockups or samples. Upon purchase you’ll get the complete, editable file formatted exactly as shown, ready for presentation or editing in Word and Excel. No hidden content, instant download access.











