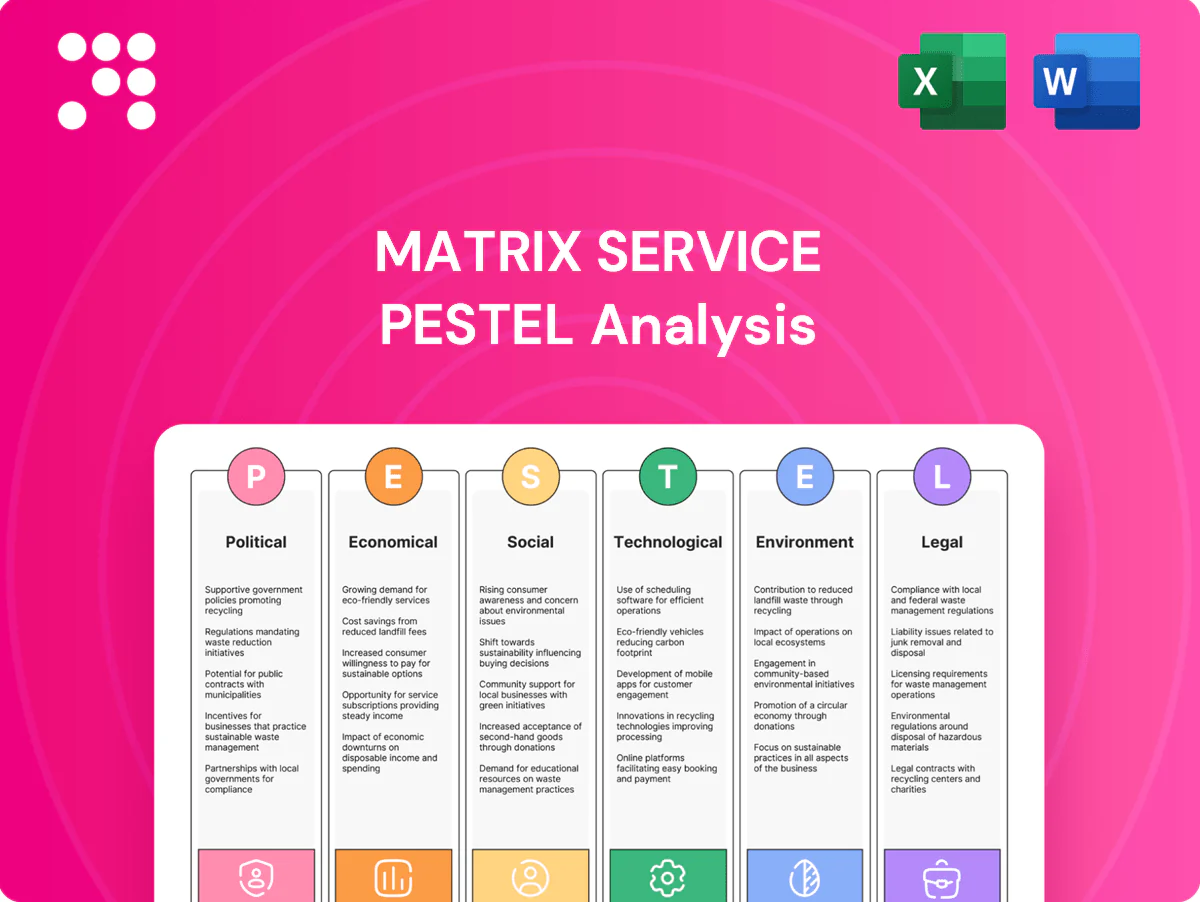
Matrix Service PESTLE Analysis

Plan Smarter. Present Sharper. Compete Stronger.
Unlock critical insights with our PESTLE analysis of Matrix Service—three concise sections reveal how political shifts, economic cycles, and tech trends affect operations. This actionable intelligence is ideal for investors and strategists. Purchase the full report to access the complete, editable breakdown and make confident decisions today.
Political factors

Energy policy direction and incentives
Shifts in federal and state energy policy—notably the Inflation Reduction Act's roughly $369 billion climate package and credits like 45V (clean hydrogen, up to $3/kg) and 45Q (carbon capture, phased to about $85/ton)—drive demand for storage, terminals, LNG, hydrogen and CCUS EPC work. Tax credits and grants accelerate low‑carbon EPC pipelines while fossil‑fuel restrictions can reduce thermal projects and redirect spend. Monitoring policy cycles aligns bidding and capability deployment.
Infrastructure funding and public works
Government infrastructure bills such as the 2021 Bipartisan Infrastructure Law promise $1.2 trillion in total spending, including about $550 billion in new federal investment, which can unlock terminal, power, and industrial project pipelines for Matrix Service. Public-private partnerships broaden EPC and maintenance addressable markets by leveraging private capital and federal incentives. Timing and strict eligibility criteria influence how quickly funded projects convert into backlog. Compliance with funding conditions increases administrative overhead but lowers counterparty and payment risk.

Trade policy and tariffs on steel
Tariffs such as the Section 232 25% steel tariff and periodic quotas raise plate and specialty component costs, directly inflating tank and terminal project margins. Volatile import rules—U.S. finished steel imports were about 24 million tons in 2023—complicate procurement and bid accuracy. Strategic sourcing, long-term contracts and price hedging can blunt price shocks, while Buy America and IRA domestic-content preferences are shifting supplier networks toward U.S. mills.

Permitting reform and timelines
Political momentum for permitting reform can compress project timelines—pilot programs in several states cut review times by roughly 20–30%, accelerating mobilization and expanding throughput for fabricators like Matrix Service; conversely, permitting bottlenecks can push mobilization from ~60–90 days to 150+ days, delaying revenue recognition by quarters. Early engagement with agencies reduces rework and idle costs, and a robust permitting playbook is a clear competitive differentiator in complex facilities.
- Reduced review times: ~20–30%
- Delay risk: mobilization can exceed 150 days
- Competitive edge: standardized permitting playbook
Geopolitical stability and energy security
Global tensions reshape North American energy strategy, driving higher storage and contingency investments as clients advance terminals and strategic reserves; US Strategic Petroleum Reserve stood near 350 million barrels in 2024, underscoring storage focus. Sanctions and export controls have forced re‑sourcing and narrowed project scopes, so risk‑aware planning preserves schedule certainty and margin protection.
- storage: US SPR ≈350M bbl (2024)
- capacity: US LNG export ≈13.5 Bcf/d (2024)
- supply risk: sanctions alter sourcing
- planning: contingency capex to protect margins
Federal incentives and tariffs reshape EPC pipelines: IRA $369B, BIL $1.2T, steel 25%
Federal policies—notably the Inflation Reduction Act (≈$369B) and credits like 45V (~$3/kg) and 45Q (~$85/ton)—accelerate storage, hydrogen, CCUS and LNG EPC pipelines, while fossil‑fuel constraints redirect spend. Infrastructure funding (Bipartisan Infrastructure Law ≈$1.2T total, $550B new) and permitting reform (±20–30% review time) affect backlog timing and mobilization. Tariffs (Section 232 steel 25%) and 2023 U.S. steel imports ≈24M tons raise input costs and reshape sourcing.
| Metric | Value |
|---|---|
| IRA package | $369B |
| 45V / 45Q | $3/kg; $85/ton |
| BIL | $1.2T total; $550B new |
| US SPR (2024) | ≈350M bbl |
| US LNG (2024) | ≈13.5 Bcf/d |
| US steel imports (2023) | ≈24M tons |
| Section 232 tariff | 25% |
What is included in the product
 Detailed Word Document
Explores how Political, Economic, Social, Technological, Environmental and Legal forces uniquely affect Matrix Service, combining data-driven trends and regional industry context to surface risks, opportunities and strategic implications for executives and investors.

 Customizable Excel Spreadsheet
Provides a clean, summarized PESTLE of Matrix Service to quickly align teams in meetings or presentations, with visually segmented external risks and opportunities for easy interpretation and on-the-go decision-making.
Economic factors

Commodity and energy price cycles
Oil, gas and petrochemical price swings directly drive client capex for tanks, terminals and process facilities; Brent briefly exceeded 100 USD/bbl in 2024, prompting expansion projects, while later dips shifted spending to maintenance and turnarounds. Diversification across power, water and industrial markets smooths revenue volatility. Scenario-based bidding and fixed-price hedges preserved margins during 2024–25 cycles.
Interest rates and project financing
Elevated interest rates (Federal Reserve target 5.25–5.50% in mid‑2025) raise client hurdle returns and can defer large EPC awards. Higher financing costs increase Matrix’s working capital needs and bonding expenses. Milestone billing and favorable contract terms help preserve cash flow. Aggressive value engineering reduces project capital intensity and offsets cost‑of‑capital pressure.

Inflation and labor/material costs
Inflation in steel, valves and specialty services compresses fixed-price margins for Matrix Service as material and input costs rise faster than contracted rates; labor scarcity elevates wages and subcontractor rates, particularly in construction and field services. Escalation clauses and indexed pricing in contracts reduce exposure to raw-material swings. Strategic procurement timing and maintaining targeted inventory levels improve cost control and margin stability.

Backlog visibility and client capex cycles
Industrial clients plan multi-year capex programs that create sizable backlog but introduce cancellation and deferment risk; turnarounds and maintenance (MRO) provide countercyclical revenue that stabilizes utilization. A balanced mix of EPC and MRO smooths peaks and troughs in staffing and margin pressure. Robust pre-construction services increase bid-to-award conversion and shorten sales cycles.
- Backlog: multi-year programs, cancellation risk
- Countercyclical: turnarounds/MRO stabilize revenue
- Portfolio: EPC + MRO smooths utilization
- Pre-construction: raises conversion rates
Supply chain resilience and FX
Global sourcing of long-lead items introduces currency and logistics risk — lead times of 6–18 months expose projects to FX swings of 5–10% seen in 2023–24, affecting imported components and margins on cross-border work. Dual-sourcing and nearshoring improve reliability and can cut transit times substantially. Early purchase commitments lock pricing and schedule, hedging against future FX and freight spikes.
Federal incentives and tariffs reshape EPC pipelines: IRA $369B, BIL $1.2T, steel 25%
Oil swings (Brent ~100 USD/bbl in 2024) drive capex vs MRO; Fed funds 5.25–5.50% (mid‑2025) raises financing and bonding costs. Inflation and rising steel/valve prices compress fixed‑price margins; escalation clauses and pre‑purchases mitigate. FX volatility 5–10% (2023–24) and 6–18 month lead times strain procurement; nearshoring cuts transit 30–50%.
| Metric | 2023–25 | Impact |
|---|---|---|
| Brent | ~100 USD/bbl (2024) | Capex swings |
| Fed funds | 5.25–5.50% (mid‑2025) | Higher financing |
| FX vol | 5–10% | Imported cost risk |
| Lead times | 6–18 months | Schedule risk |
What You See Is What You Get
Matrix Service PESTLE Analysis
The preview shown here is the exact Matrix Service PESTLE Analysis you’ll receive after purchase—fully formatted, professionally structured, and ready to use. This is a real snapshot of the final file delivered exactly as shown, with no placeholders or surprises. After checkout you’ll be able to download this same complete document instantly.

Plan Smarter. Present Sharper. Compete Stronger.
Unlock critical insights with our PESTLE analysis of Matrix Service—three concise sections reveal how political shifts, economic cycles, and tech trends affect operations. This actionable intelligence is ideal for investors and strategists. Purchase the full report to access the complete, editable breakdown and make confident decisions today.
Political factors
Energy policy direction and incentives
Shifts in federal and state energy policy—notably the Inflation Reduction Act's roughly $369 billion climate package and credits like 45V (clean hydrogen, up to $3/kg) and 45Q (carbon capture, phased to about $85/ton)—drive demand for storage, terminals, LNG, hydrogen and CCUS EPC work. Tax credits and grants accelerate low‑carbon EPC pipelines while fossil‑fuel restrictions can reduce thermal projects and redirect spend. Monitoring policy cycles aligns bidding and capability deployment.
Infrastructure funding and public works
Government infrastructure bills such as the 2021 Bipartisan Infrastructure Law promise $1.2 trillion in total spending, including about $550 billion in new federal investment, which can unlock terminal, power, and industrial project pipelines for Matrix Service. Public-private partnerships broaden EPC and maintenance addressable markets by leveraging private capital and federal incentives. Timing and strict eligibility criteria influence how quickly funded projects convert into backlog. Compliance with funding conditions increases administrative overhead but lowers counterparty and payment risk.
Trade policy and tariffs on steel
Tariffs such as the Section 232 25% steel tariff and periodic quotas raise plate and specialty component costs, directly inflating tank and terminal project margins. Volatile import rules—U.S. finished steel imports were about 24 million tons in 2023—complicate procurement and bid accuracy. Strategic sourcing, long-term contracts and price hedging can blunt price shocks, while Buy America and IRA domestic-content preferences are shifting supplier networks toward U.S. mills.
Permitting reform and timelines
Political momentum for permitting reform can compress project timelines—pilot programs in several states cut review times by roughly 20–30%, accelerating mobilization and expanding throughput for fabricators like Matrix Service; conversely, permitting bottlenecks can push mobilization from ~60–90 days to 150+ days, delaying revenue recognition by quarters. Early engagement with agencies reduces rework and idle costs, and a robust permitting playbook is a clear competitive differentiator in complex facilities.
- Reduced review times: ~20–30%
- Delay risk: mobilization can exceed 150 days
- Competitive edge: standardized permitting playbook
Geopolitical stability and energy security
Global tensions reshape North American energy strategy, driving higher storage and contingency investments as clients advance terminals and strategic reserves; US Strategic Petroleum Reserve stood near 350 million barrels in 2024, underscoring storage focus. Sanctions and export controls have forced re‑sourcing and narrowed project scopes, so risk‑aware planning preserves schedule certainty and margin protection.
- storage: US SPR ≈350M bbl (2024)
- capacity: US LNG export ≈13.5 Bcf/d (2024)
- supply risk: sanctions alter sourcing
- planning: contingency capex to protect margins
Federal incentives and tariffs reshape EPC pipelines: IRA $369B, BIL $1.2T, steel 25%
Federal policies—notably the Inflation Reduction Act (≈$369B) and credits like 45V (~$3/kg) and 45Q (~$85/ton)—accelerate storage, hydrogen, CCUS and LNG EPC pipelines, while fossil‑fuel constraints redirect spend. Infrastructure funding (Bipartisan Infrastructure Law ≈$1.2T total, $550B new) and permitting reform (±20–30% review time) affect backlog timing and mobilization. Tariffs (Section 232 steel 25%) and 2023 U.S. steel imports ≈24M tons raise input costs and reshape sourcing.
| Metric | Value |
|---|---|
| IRA package | $369B |
| 45V / 45Q | $3/kg; $85/ton |
| BIL | $1.2T total; $550B new |
| US SPR (2024) | ≈350M bbl |
| US LNG (2024) | ≈13.5 Bcf/d |
| US steel imports (2023) | ≈24M tons |
| Section 232 tariff | 25% |
What is included in the product
Detailed Word Document
Explores how Political, Economic, Social, Technological, Environmental and Legal forces uniquely affect Matrix Service, combining data-driven trends and regional industry context to surface risks, opportunities and strategic implications for executives and investors.
Customizable Excel Spreadsheet
Provides a clean, summarized PESTLE of Matrix Service to quickly align teams in meetings or presentations, with visually segmented external risks and opportunities for easy interpretation and on-the-go decision-making.
Economic factors
Commodity and energy price cycles
Oil, gas and petrochemical price swings directly drive client capex for tanks, terminals and process facilities; Brent briefly exceeded 100 USD/bbl in 2024, prompting expansion projects, while later dips shifted spending to maintenance and turnarounds. Diversification across power, water and industrial markets smooths revenue volatility. Scenario-based bidding and fixed-price hedges preserved margins during 2024–25 cycles.
Interest rates and project financing
Elevated interest rates (Federal Reserve target 5.25–5.50% in mid‑2025) raise client hurdle returns and can defer large EPC awards. Higher financing costs increase Matrix’s working capital needs and bonding expenses. Milestone billing and favorable contract terms help preserve cash flow. Aggressive value engineering reduces project capital intensity and offsets cost‑of‑capital pressure.
Inflation and labor/material costs
Inflation in steel, valves and specialty services compresses fixed-price margins for Matrix Service as material and input costs rise faster than contracted rates; labor scarcity elevates wages and subcontractor rates, particularly in construction and field services. Escalation clauses and indexed pricing in contracts reduce exposure to raw-material swings. Strategic procurement timing and maintaining targeted inventory levels improve cost control and margin stability.
Backlog visibility and client capex cycles
Industrial clients plan multi-year capex programs that create sizable backlog but introduce cancellation and deferment risk; turnarounds and maintenance (MRO) provide countercyclical revenue that stabilizes utilization. A balanced mix of EPC and MRO smooths peaks and troughs in staffing and margin pressure. Robust pre-construction services increase bid-to-award conversion and shorten sales cycles.
- Backlog: multi-year programs, cancellation risk
- Countercyclical: turnarounds/MRO stabilize revenue
- Portfolio: EPC + MRO smooths utilization
- Pre-construction: raises conversion rates
Supply chain resilience and FX
Global sourcing of long-lead items introduces currency and logistics risk — lead times of 6–18 months expose projects to FX swings of 5–10% seen in 2023–24, affecting imported components and margins on cross-border work. Dual-sourcing and nearshoring improve reliability and can cut transit times substantially. Early purchase commitments lock pricing and schedule, hedging against future FX and freight spikes.
Federal incentives and tariffs reshape EPC pipelines: IRA $369B, BIL $1.2T, steel 25%
Oil swings (Brent ~100 USD/bbl in 2024) drive capex vs MRO; Fed funds 5.25–5.50% (mid‑2025) raises financing and bonding costs. Inflation and rising steel/valve prices compress fixed‑price margins; escalation clauses and pre‑purchases mitigate. FX volatility 5–10% (2023–24) and 6–18 month lead times strain procurement; nearshoring cuts transit 30–50%.
| Metric | 2023–25 | Impact |
|---|---|---|
| Brent | ~100 USD/bbl (2024) | Capex swings |
| Fed funds | 5.25–5.50% (mid‑2025) | Higher financing |
| FX vol | 5–10% | Imported cost risk |
| Lead times | 6–18 months | Schedule risk |
What You See Is What You Get
Matrix Service PESTLE Analysis
The preview shown here is the exact Matrix Service PESTLE Analysis you’ll receive after purchase—fully formatted, professionally structured, and ready to use. This is a real snapshot of the final file delivered exactly as shown, with no placeholders or surprises. After checkout you’ll be able to download this same complete document instantly.
Description
Plan Smarter. Present Sharper. Compete Stronger.
Unlock critical insights with our PESTLE analysis of Matrix Service—three concise sections reveal how political shifts, economic cycles, and tech trends affect operations. This actionable intelligence is ideal for investors and strategists. Purchase the full report to access the complete, editable breakdown and make confident decisions today.
Political factors
Energy policy direction and incentives
Shifts in federal and state energy policy—notably the Inflation Reduction Act's roughly $369 billion climate package and credits like 45V (clean hydrogen, up to $3/kg) and 45Q (carbon capture, phased to about $85/ton)—drive demand for storage, terminals, LNG, hydrogen and CCUS EPC work. Tax credits and grants accelerate low‑carbon EPC pipelines while fossil‑fuel restrictions can reduce thermal projects and redirect spend. Monitoring policy cycles aligns bidding and capability deployment.
Infrastructure funding and public works
Government infrastructure bills such as the 2021 Bipartisan Infrastructure Law promise $1.2 trillion in total spending, including about $550 billion in new federal investment, which can unlock terminal, power, and industrial project pipelines for Matrix Service. Public-private partnerships broaden EPC and maintenance addressable markets by leveraging private capital and federal incentives. Timing and strict eligibility criteria influence how quickly funded projects convert into backlog. Compliance with funding conditions increases administrative overhead but lowers counterparty and payment risk.
Trade policy and tariffs on steel
Tariffs such as the Section 232 25% steel tariff and periodic quotas raise plate and specialty component costs, directly inflating tank and terminal project margins. Volatile import rules—U.S. finished steel imports were about 24 million tons in 2023—complicate procurement and bid accuracy. Strategic sourcing, long-term contracts and price hedging can blunt price shocks, while Buy America and IRA domestic-content preferences are shifting supplier networks toward U.S. mills.
Permitting reform and timelines
Political momentum for permitting reform can compress project timelines—pilot programs in several states cut review times by roughly 20–30%, accelerating mobilization and expanding throughput for fabricators like Matrix Service; conversely, permitting bottlenecks can push mobilization from ~60–90 days to 150+ days, delaying revenue recognition by quarters. Early engagement with agencies reduces rework and idle costs, and a robust permitting playbook is a clear competitive differentiator in complex facilities.
- Reduced review times: ~20–30%
- Delay risk: mobilization can exceed 150 days
- Competitive edge: standardized permitting playbook
Geopolitical stability and energy security
Global tensions reshape North American energy strategy, driving higher storage and contingency investments as clients advance terminals and strategic reserves; US Strategic Petroleum Reserve stood near 350 million barrels in 2024, underscoring storage focus. Sanctions and export controls have forced re‑sourcing and narrowed project scopes, so risk‑aware planning preserves schedule certainty and margin protection.
- storage: US SPR ≈350M bbl (2024)
- capacity: US LNG export ≈13.5 Bcf/d (2024)
- supply risk: sanctions alter sourcing
- planning: contingency capex to protect margins
Federal incentives and tariffs reshape EPC pipelines: IRA $369B, BIL $1.2T, steel 25%
Federal policies—notably the Inflation Reduction Act (≈$369B) and credits like 45V (~$3/kg) and 45Q (~$85/ton)—accelerate storage, hydrogen, CCUS and LNG EPC pipelines, while fossil‑fuel constraints redirect spend. Infrastructure funding (Bipartisan Infrastructure Law ≈$1.2T total, $550B new) and permitting reform (±20–30% review time) affect backlog timing and mobilization. Tariffs (Section 232 steel 25%) and 2023 U.S. steel imports ≈24M tons raise input costs and reshape sourcing.
| Metric | Value |
|---|---|
| IRA package | $369B |
| 45V / 45Q | $3/kg; $85/ton |
| BIL | $1.2T total; $550B new |
| US SPR (2024) | ≈350M bbl |
| US LNG (2024) | ≈13.5 Bcf/d |
| US steel imports (2023) | ≈24M tons |
| Section 232 tariff | 25% |
What is included in the product
Detailed Word Document
Explores how Political, Economic, Social, Technological, Environmental and Legal forces uniquely affect Matrix Service, combining data-driven trends and regional industry context to surface risks, opportunities and strategic implications for executives and investors.
Customizable Excel Spreadsheet
Provides a clean, summarized PESTLE of Matrix Service to quickly align teams in meetings or presentations, with visually segmented external risks and opportunities for easy interpretation and on-the-go decision-making.
Economic factors
Commodity and energy price cycles
Oil, gas and petrochemical price swings directly drive client capex for tanks, terminals and process facilities; Brent briefly exceeded 100 USD/bbl in 2024, prompting expansion projects, while later dips shifted spending to maintenance and turnarounds. Diversification across power, water and industrial markets smooths revenue volatility. Scenario-based bidding and fixed-price hedges preserved margins during 2024–25 cycles.
Interest rates and project financing
Elevated interest rates (Federal Reserve target 5.25–5.50% in mid‑2025) raise client hurdle returns and can defer large EPC awards. Higher financing costs increase Matrix’s working capital needs and bonding expenses. Milestone billing and favorable contract terms help preserve cash flow. Aggressive value engineering reduces project capital intensity and offsets cost‑of‑capital pressure.
Inflation and labor/material costs
Inflation in steel, valves and specialty services compresses fixed-price margins for Matrix Service as material and input costs rise faster than contracted rates; labor scarcity elevates wages and subcontractor rates, particularly in construction and field services. Escalation clauses and indexed pricing in contracts reduce exposure to raw-material swings. Strategic procurement timing and maintaining targeted inventory levels improve cost control and margin stability.
Backlog visibility and client capex cycles
Industrial clients plan multi-year capex programs that create sizable backlog but introduce cancellation and deferment risk; turnarounds and maintenance (MRO) provide countercyclical revenue that stabilizes utilization. A balanced mix of EPC and MRO smooths peaks and troughs in staffing and margin pressure. Robust pre-construction services increase bid-to-award conversion and shorten sales cycles.
- Backlog: multi-year programs, cancellation risk
- Countercyclical: turnarounds/MRO stabilize revenue
- Portfolio: EPC + MRO smooths utilization
- Pre-construction: raises conversion rates
Supply chain resilience and FX
Global sourcing of long-lead items introduces currency and logistics risk — lead times of 6–18 months expose projects to FX swings of 5–10% seen in 2023–24, affecting imported components and margins on cross-border work. Dual-sourcing and nearshoring improve reliability and can cut transit times substantially. Early purchase commitments lock pricing and schedule, hedging against future FX and freight spikes.
Federal incentives and tariffs reshape EPC pipelines: IRA $369B, BIL $1.2T, steel 25%
Oil swings (Brent ~100 USD/bbl in 2024) drive capex vs MRO; Fed funds 5.25–5.50% (mid‑2025) raises financing and bonding costs. Inflation and rising steel/valve prices compress fixed‑price margins; escalation clauses and pre‑purchases mitigate. FX volatility 5–10% (2023–24) and 6–18 month lead times strain procurement; nearshoring cuts transit 30–50%.
| Metric | 2023–25 | Impact |
|---|---|---|
| Brent | ~100 USD/bbl (2024) | Capex swings |
| Fed funds | 5.25–5.50% (mid‑2025) | Higher financing |
| FX vol | 5–10% | Imported cost risk |
| Lead times | 6–18 months | Schedule risk |
What You See Is What You Get
Matrix Service PESTLE Analysis
The preview shown here is the exact Matrix Service PESTLE Analysis you’ll receive after purchase—fully formatted, professionally structured, and ready to use. This is a real snapshot of the final file delivered exactly as shown, with no placeholders or surprises. After checkout you’ll be able to download this same complete document instantly.











