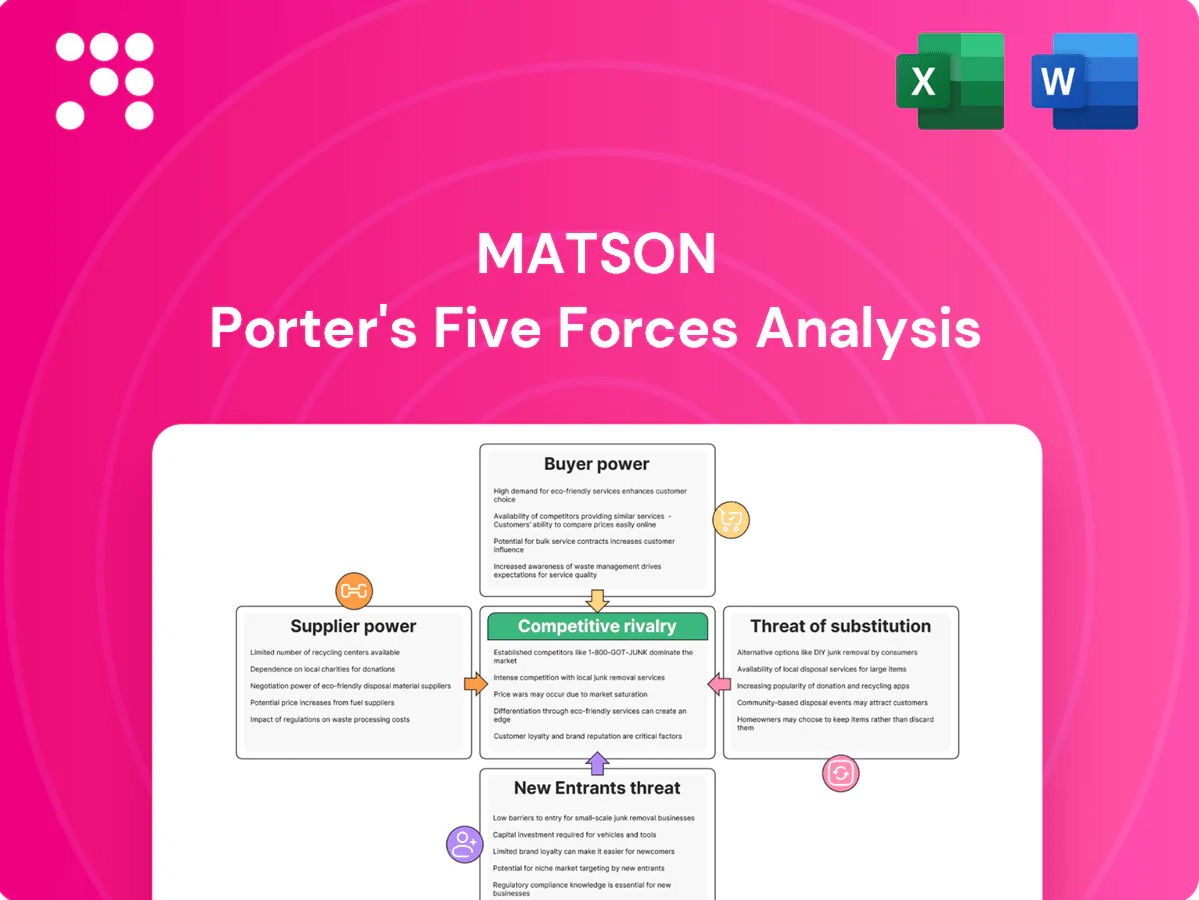
Matson Porter's Five Forces Analysis

Go Beyond the Preview—Access the Full Strategic Report
Matson’s Porter’s Five Forces snapshot highlights how container shipping economics, route-specific barriers, and rising fuel and labor costs shape competitive intensity. Buyer and supplier leverage, plus regulation and substitute transport options, create nuanced strategic pressures. Our full analysis quantifies each force and explains business implications. This brief only scratches the surface—unlock the full Porter’s Five Forces report for detailed ratings, visuals, and actionable insights.
Suppliers Bargaining Power

Concentrated vessel and engine suppliers
Ocean-going ships and main engines come from a few global yards and OEMs, concentrating supplier leverage; in 2024 China, South Korea and Japan still held over 90% of the global shipyard orderbook. Long lead times and heavy customization raise switching costs for Matson, often inflating capex and extending delivery schedules. Matson mitigates this by placing early orders and using lifecycle maintenance planning to smooth capex and availability.
Fuel bunkering dependence
Marine fuel is a major cost for Matson, linked to volatile oil markets (Brent averaged about $86.5/bbl in 2024), and limited Pacific bunkering hubs concentrate supply. Supplier concentration at ports like Singapore and Fujairah compresses bargaining power and can drive local price spikes and shortages. Fuel surcharges shift some volatility to customers but with timing lag. Hedging programs and vessel efficiency upgrades reduce net exposure.

Port terminals and stevedoring
Access to berths, cranes and yard space is tightly controlled by port authorities and terminal operators; LA/LB handled roughly 9–10 million TEU in 2024, with vessel turns often 3–5 days and crane productivity around 20–30 moves/hour, which strengthens supplier leverage. Congestion spikes and limited labor availability (notably during peak season) tighten supplier power. Long-term leases and Matson’s dedicated Honolulu terminal reduce exposure but lock in rates and capacity. Operational coordination remains critical in peak months.

Unionized maritime labor
- Union coverage: ~22,000 longshore workers
- Market exposure: ~40% US container trade via West Coast
- Risk: episodic strikes can cause multi-week delays
- Mitigant: labor collaboration + contingency routing
Equipment and tech vendors
Equipment and tech vendors supplying containers, chassis and TOS/IT systems hold leverage because specialized hardware and integrations create switching frictions; global container fleet ~27.5M TEU (2024) and ports' annual capex exceeds $30B (2024), increasing vendor dependence. SLAs cap exposure but need active oversight; standardization and multi-sourcing preserve flexibility.
- Vendor concentration
- Integration lock-in
- SLA risk control
- Standardize/multi-source
Concentrated shipyard power, fuel volatility and port bottlenecks raise shipping risk
Supplier power is high: shipyards/OEMs in China, South Korea, Japan held over 90% of the 2024 orderbook, raising capex and lead-time risk. Fuel volatility (Brent ~ $86.5/bbl in 2024) and concentrated bunkering amplify costs despite surcharges and hedges. Port infrastructure concentration (LA/LB 9–10M TEU; ports capex > $30B) and unionized labor (~22,000 longshore) create bargaining leverage; multi-sourcing and long leases mitigate some exposure.
| Supplier | 2024 Metric |
|---|---|
| Shipyards/OEMs | >90% orderbook China/KR/JP |
| Fuel | Brent ~ $86.5/bbl |
| Ports | LA/LB 9–10M TEU; capex > $30B |
| Labor | ~22,000 longshore |
| Containers | Global fleet ~27.5M TEU |
What is included in the product
 Detailed Word Document
Comprehensive Porter's Five Forces analysis for Matson, uncovering competitive intensity, supplier and buyer power, entry barriers, substitutes, and disruptive risks shaping its Pacific shipping and logistics profitability. Actionable insights highlight pricing leverage, modal competition, terminal access constraints, and strategic defenses to protect market share and margins.

 Customizable Excel Spreadsheet
Matson Porter's Five Forces Analysis as a one-sheet quickly reveals competitive pressures and strategic levers—cutting analysis time and clarifying priorities for faster, confident decision-making.
Customers Bargaining Power

Large shippers and forwarders
Major retailers, consumer-goods firms and 3PLs aggregate volumes in Hawaii, Alaska and Guam, giving them scale to negotiate rates and service commitments; global 3PL market size is estimated near $1.3 trillion in 2024, concentrating purchasing power. Contracted volumes stabilize Matson’s lane utilization but exert downward pressure on margins, often compressing EBITDA by mid-single digits; value-added logistics services increase customer stickiness and raise lifetime revenue per shipper.
Limited modal alternatives
On island routes ocean freight is often the only economical option, which sharply reduces buyer leverage compared with continental lanes and concentrates dependency on carriers like Matson. Time-sensitive cargo can still migrate to air freight at the margin, giving shippers limited alternative for urgent shipments. Consequently service reliability and schedule integrity become Matson’s primary bargaining chips in negotiations.

Seasonality and demand swings
Tourism and retail seasons in Pacific islands drive peak loads, with ports reporting seasonal surges up to 40–50% during high months; buyers increasingly demand space guarantees and rate caps for peak-season shipments. In off-peak periods shippers push for discounts or flexible terms to fill idle capacity. Matson balances yield and relationships via dynamic capacity management, rolling inventory nudges and peak pricing windows.

Price transparency and surcharges
Public tariffs and fuel/port surcharges are widely benchmarked in 2024, prompting buyers to routinely contest surcharges and ancillary fees; index-linked contracts reduce disputes but cap carrier upside. Clear, itemized communication on cost drivers preserves trust and eases negotiations.
- Benchmarking common; disputes frequent
- Index-linked contracts: fewer disputes, limited upside
- Transparent cost breakdowns sustain trust
Service quality sensitivity
On-time arrival, equipment availability and low damage rates are primary drivers of buyer choice, and high reliability reduces propensity to switch even when competitors offer lower rates. Premium expedited services justify meaningful pricing uplifts, while recurring disruptions rapidly erode customer leverage and increase churn risk.
- On-time arrival — key retention factor
- Equipment availability — lowers switching
- Damage rates — affect trust
- Expedited premium — commands higher pricing
- Persistent disruptions — erode bargaining power
3PL buying power compresses margins; reliability key amid 40–50% surges
Large retailers and 3PLs (global 3PL market ~1.3 trillion USD in 2024) concentrate buying power, squeezing Matson margins (EBITDA compression mid-single digits) despite contracted volumes; island routes limit alternatives so service reliability is Matson’s leverage. Seasonal peaks inject 40–50% surge risk; surcharges are routinely benchmarked and contested.
| Metric | 2024 value | Impact |
|---|---|---|
| 3PL market | $1.3T | High buyer scale |
| EBITDA squeeze | 3–6% | Margin pressure |
| Peak surge | 40–50% | Capacity strain |
Preview the Actual Deliverable
Matson Porter's Five Forces Analysis
This preview shows the exact Matson Porter's Five Forces Analysis you'll receive immediately after purchase—no placeholders or samples. The document is fully formatted and ready for download and use the moment you buy. What you see here is the final, complete analysis file delivered instantly upon payment.

Go Beyond the Preview—Access the Full Strategic Report
Matson’s Porter’s Five Forces snapshot highlights how container shipping economics, route-specific barriers, and rising fuel and labor costs shape competitive intensity. Buyer and supplier leverage, plus regulation and substitute transport options, create nuanced strategic pressures. Our full analysis quantifies each force and explains business implications. This brief only scratches the surface—unlock the full Porter’s Five Forces report for detailed ratings, visuals, and actionable insights.
Suppliers Bargaining Power
Concentrated vessel and engine suppliers
Ocean-going ships and main engines come from a few global yards and OEMs, concentrating supplier leverage; in 2024 China, South Korea and Japan still held over 90% of the global shipyard orderbook. Long lead times and heavy customization raise switching costs for Matson, often inflating capex and extending delivery schedules. Matson mitigates this by placing early orders and using lifecycle maintenance planning to smooth capex and availability.
Fuel bunkering dependence
Marine fuel is a major cost for Matson, linked to volatile oil markets (Brent averaged about $86.5/bbl in 2024), and limited Pacific bunkering hubs concentrate supply. Supplier concentration at ports like Singapore and Fujairah compresses bargaining power and can drive local price spikes and shortages. Fuel surcharges shift some volatility to customers but with timing lag. Hedging programs and vessel efficiency upgrades reduce net exposure.
Port terminals and stevedoring
Access to berths, cranes and yard space is tightly controlled by port authorities and terminal operators; LA/LB handled roughly 9–10 million TEU in 2024, with vessel turns often 3–5 days and crane productivity around 20–30 moves/hour, which strengthens supplier leverage. Congestion spikes and limited labor availability (notably during peak season) tighten supplier power. Long-term leases and Matson’s dedicated Honolulu terminal reduce exposure but lock in rates and capacity. Operational coordination remains critical in peak months.
Unionized maritime labor
- Union coverage: ~22,000 longshore workers
- Market exposure: ~40% US container trade via West Coast
- Risk: episodic strikes can cause multi-week delays
- Mitigant: labor collaboration + contingency routing
Equipment and tech vendors
Equipment and tech vendors supplying containers, chassis and TOS/IT systems hold leverage because specialized hardware and integrations create switching frictions; global container fleet ~27.5M TEU (2024) and ports' annual capex exceeds $30B (2024), increasing vendor dependence. SLAs cap exposure but need active oversight; standardization and multi-sourcing preserve flexibility.
- Vendor concentration
- Integration lock-in
- SLA risk control
- Standardize/multi-source
Concentrated shipyard power, fuel volatility and port bottlenecks raise shipping risk
Supplier power is high: shipyards/OEMs in China, South Korea, Japan held over 90% of the 2024 orderbook, raising capex and lead-time risk. Fuel volatility (Brent ~ $86.5/bbl in 2024) and concentrated bunkering amplify costs despite surcharges and hedges. Port infrastructure concentration (LA/LB 9–10M TEU; ports capex > $30B) and unionized labor (~22,000 longshore) create bargaining leverage; multi-sourcing and long leases mitigate some exposure.
| Supplier | 2024 Metric |
|---|---|
| Shipyards/OEMs | >90% orderbook China/KR/JP |
| Fuel | Brent ~ $86.5/bbl |
| Ports | LA/LB 9–10M TEU; capex > $30B |
| Labor | ~22,000 longshore |
| Containers | Global fleet ~27.5M TEU |
What is included in the product
Detailed Word Document
Comprehensive Porter's Five Forces analysis for Matson, uncovering competitive intensity, supplier and buyer power, entry barriers, substitutes, and disruptive risks shaping its Pacific shipping and logistics profitability. Actionable insights highlight pricing leverage, modal competition, terminal access constraints, and strategic defenses to protect market share and margins.
Customizable Excel Spreadsheet
Matson Porter's Five Forces Analysis as a one-sheet quickly reveals competitive pressures and strategic levers—cutting analysis time and clarifying priorities for faster, confident decision-making.
Customers Bargaining Power
Large shippers and forwarders
Major retailers, consumer-goods firms and 3PLs aggregate volumes in Hawaii, Alaska and Guam, giving them scale to negotiate rates and service commitments; global 3PL market size is estimated near $1.3 trillion in 2024, concentrating purchasing power. Contracted volumes stabilize Matson’s lane utilization but exert downward pressure on margins, often compressing EBITDA by mid-single digits; value-added logistics services increase customer stickiness and raise lifetime revenue per shipper.
Limited modal alternatives
On island routes ocean freight is often the only economical option, which sharply reduces buyer leverage compared with continental lanes and concentrates dependency on carriers like Matson. Time-sensitive cargo can still migrate to air freight at the margin, giving shippers limited alternative for urgent shipments. Consequently service reliability and schedule integrity become Matson’s primary bargaining chips in negotiations.
Seasonality and demand swings
Tourism and retail seasons in Pacific islands drive peak loads, with ports reporting seasonal surges up to 40–50% during high months; buyers increasingly demand space guarantees and rate caps for peak-season shipments. In off-peak periods shippers push for discounts or flexible terms to fill idle capacity. Matson balances yield and relationships via dynamic capacity management, rolling inventory nudges and peak pricing windows.
Price transparency and surcharges
Public tariffs and fuel/port surcharges are widely benchmarked in 2024, prompting buyers to routinely contest surcharges and ancillary fees; index-linked contracts reduce disputes but cap carrier upside. Clear, itemized communication on cost drivers preserves trust and eases negotiations.
- Benchmarking common; disputes frequent
- Index-linked contracts: fewer disputes, limited upside
- Transparent cost breakdowns sustain trust
Service quality sensitivity
On-time arrival, equipment availability and low damage rates are primary drivers of buyer choice, and high reliability reduces propensity to switch even when competitors offer lower rates. Premium expedited services justify meaningful pricing uplifts, while recurring disruptions rapidly erode customer leverage and increase churn risk.
- On-time arrival — key retention factor
- Equipment availability — lowers switching
- Damage rates — affect trust
- Expedited premium — commands higher pricing
- Persistent disruptions — erode bargaining power
3PL buying power compresses margins; reliability key amid 40–50% surges
Large retailers and 3PLs (global 3PL market ~1.3 trillion USD in 2024) concentrate buying power, squeezing Matson margins (EBITDA compression mid-single digits) despite contracted volumes; island routes limit alternatives so service reliability is Matson’s leverage. Seasonal peaks inject 40–50% surge risk; surcharges are routinely benchmarked and contested.
| Metric | 2024 value | Impact |
|---|---|---|
| 3PL market | $1.3T | High buyer scale |
| EBITDA squeeze | 3–6% | Margin pressure |
| Peak surge | 40–50% | Capacity strain |
Preview the Actual Deliverable
Matson Porter's Five Forces Analysis
This preview shows the exact Matson Porter's Five Forces Analysis you'll receive immediately after purchase—no placeholders or samples. The document is fully formatted and ready for download and use the moment you buy. What you see here is the final, complete analysis file delivered instantly upon payment.
Original: $10.00
-65%$10.00
$3.50Description
Go Beyond the Preview—Access the Full Strategic Report
Matson’s Porter’s Five Forces snapshot highlights how container shipping economics, route-specific barriers, and rising fuel and labor costs shape competitive intensity. Buyer and supplier leverage, plus regulation and substitute transport options, create nuanced strategic pressures. Our full analysis quantifies each force and explains business implications. This brief only scratches the surface—unlock the full Porter’s Five Forces report for detailed ratings, visuals, and actionable insights.
Suppliers Bargaining Power
Concentrated vessel and engine suppliers
Ocean-going ships and main engines come from a few global yards and OEMs, concentrating supplier leverage; in 2024 China, South Korea and Japan still held over 90% of the global shipyard orderbook. Long lead times and heavy customization raise switching costs for Matson, often inflating capex and extending delivery schedules. Matson mitigates this by placing early orders and using lifecycle maintenance planning to smooth capex and availability.
Fuel bunkering dependence
Marine fuel is a major cost for Matson, linked to volatile oil markets (Brent averaged about $86.5/bbl in 2024), and limited Pacific bunkering hubs concentrate supply. Supplier concentration at ports like Singapore and Fujairah compresses bargaining power and can drive local price spikes and shortages. Fuel surcharges shift some volatility to customers but with timing lag. Hedging programs and vessel efficiency upgrades reduce net exposure.
Port terminals and stevedoring
Access to berths, cranes and yard space is tightly controlled by port authorities and terminal operators; LA/LB handled roughly 9–10 million TEU in 2024, with vessel turns often 3–5 days and crane productivity around 20–30 moves/hour, which strengthens supplier leverage. Congestion spikes and limited labor availability (notably during peak season) tighten supplier power. Long-term leases and Matson’s dedicated Honolulu terminal reduce exposure but lock in rates and capacity. Operational coordination remains critical in peak months.
Unionized maritime labor
- Union coverage: ~22,000 longshore workers
- Market exposure: ~40% US container trade via West Coast
- Risk: episodic strikes can cause multi-week delays
- Mitigant: labor collaboration + contingency routing
Equipment and tech vendors
Equipment and tech vendors supplying containers, chassis and TOS/IT systems hold leverage because specialized hardware and integrations create switching frictions; global container fleet ~27.5M TEU (2024) and ports' annual capex exceeds $30B (2024), increasing vendor dependence. SLAs cap exposure but need active oversight; standardization and multi-sourcing preserve flexibility.
- Vendor concentration
- Integration lock-in
- SLA risk control
- Standardize/multi-source
Concentrated shipyard power, fuel volatility and port bottlenecks raise shipping risk
Supplier power is high: shipyards/OEMs in China, South Korea, Japan held over 90% of the 2024 orderbook, raising capex and lead-time risk. Fuel volatility (Brent ~ $86.5/bbl in 2024) and concentrated bunkering amplify costs despite surcharges and hedges. Port infrastructure concentration (LA/LB 9–10M TEU; ports capex > $30B) and unionized labor (~22,000 longshore) create bargaining leverage; multi-sourcing and long leases mitigate some exposure.
| Supplier | 2024 Metric |
|---|---|
| Shipyards/OEMs | >90% orderbook China/KR/JP |
| Fuel | Brent ~ $86.5/bbl |
| Ports | LA/LB 9–10M TEU; capex > $30B |
| Labor | ~22,000 longshore |
| Containers | Global fleet ~27.5M TEU |
What is included in the product
Detailed Word Document
Comprehensive Porter's Five Forces analysis for Matson, uncovering competitive intensity, supplier and buyer power, entry barriers, substitutes, and disruptive risks shaping its Pacific shipping and logistics profitability. Actionable insights highlight pricing leverage, modal competition, terminal access constraints, and strategic defenses to protect market share and margins.
Customizable Excel Spreadsheet
Matson Porter's Five Forces Analysis as a one-sheet quickly reveals competitive pressures and strategic levers—cutting analysis time and clarifying priorities for faster, confident decision-making.
Customers Bargaining Power
Large shippers and forwarders
Major retailers, consumer-goods firms and 3PLs aggregate volumes in Hawaii, Alaska and Guam, giving them scale to negotiate rates and service commitments; global 3PL market size is estimated near $1.3 trillion in 2024, concentrating purchasing power. Contracted volumes stabilize Matson’s lane utilization but exert downward pressure on margins, often compressing EBITDA by mid-single digits; value-added logistics services increase customer stickiness and raise lifetime revenue per shipper.
Limited modal alternatives
On island routes ocean freight is often the only economical option, which sharply reduces buyer leverage compared with continental lanes and concentrates dependency on carriers like Matson. Time-sensitive cargo can still migrate to air freight at the margin, giving shippers limited alternative for urgent shipments. Consequently service reliability and schedule integrity become Matson’s primary bargaining chips in negotiations.
Seasonality and demand swings
Tourism and retail seasons in Pacific islands drive peak loads, with ports reporting seasonal surges up to 40–50% during high months; buyers increasingly demand space guarantees and rate caps for peak-season shipments. In off-peak periods shippers push for discounts or flexible terms to fill idle capacity. Matson balances yield and relationships via dynamic capacity management, rolling inventory nudges and peak pricing windows.
Price transparency and surcharges
Public tariffs and fuel/port surcharges are widely benchmarked in 2024, prompting buyers to routinely contest surcharges and ancillary fees; index-linked contracts reduce disputes but cap carrier upside. Clear, itemized communication on cost drivers preserves trust and eases negotiations.
- Benchmarking common; disputes frequent
- Index-linked contracts: fewer disputes, limited upside
- Transparent cost breakdowns sustain trust
Service quality sensitivity
On-time arrival, equipment availability and low damage rates are primary drivers of buyer choice, and high reliability reduces propensity to switch even when competitors offer lower rates. Premium expedited services justify meaningful pricing uplifts, while recurring disruptions rapidly erode customer leverage and increase churn risk.
- On-time arrival — key retention factor
- Equipment availability — lowers switching
- Damage rates — affect trust
- Expedited premium — commands higher pricing
- Persistent disruptions — erode bargaining power
3PL buying power compresses margins; reliability key amid 40–50% surges
Large retailers and 3PLs (global 3PL market ~1.3 trillion USD in 2024) concentrate buying power, squeezing Matson margins (EBITDA compression mid-single digits) despite contracted volumes; island routes limit alternatives so service reliability is Matson’s leverage. Seasonal peaks inject 40–50% surge risk; surcharges are routinely benchmarked and contested.
| Metric | 2024 value | Impact |
|---|---|---|
| 3PL market | $1.3T | High buyer scale |
| EBITDA squeeze | 3–6% | Margin pressure |
| Peak surge | 40–50% | Capacity strain |
Preview the Actual Deliverable
Matson Porter's Five Forces Analysis
This preview shows the exact Matson Porter's Five Forces Analysis you'll receive immediately after purchase—no placeholders or samples. The document is fully formatted and ready for download and use the moment you buy. What you see here is the final, complete analysis file delivered instantly upon payment.











