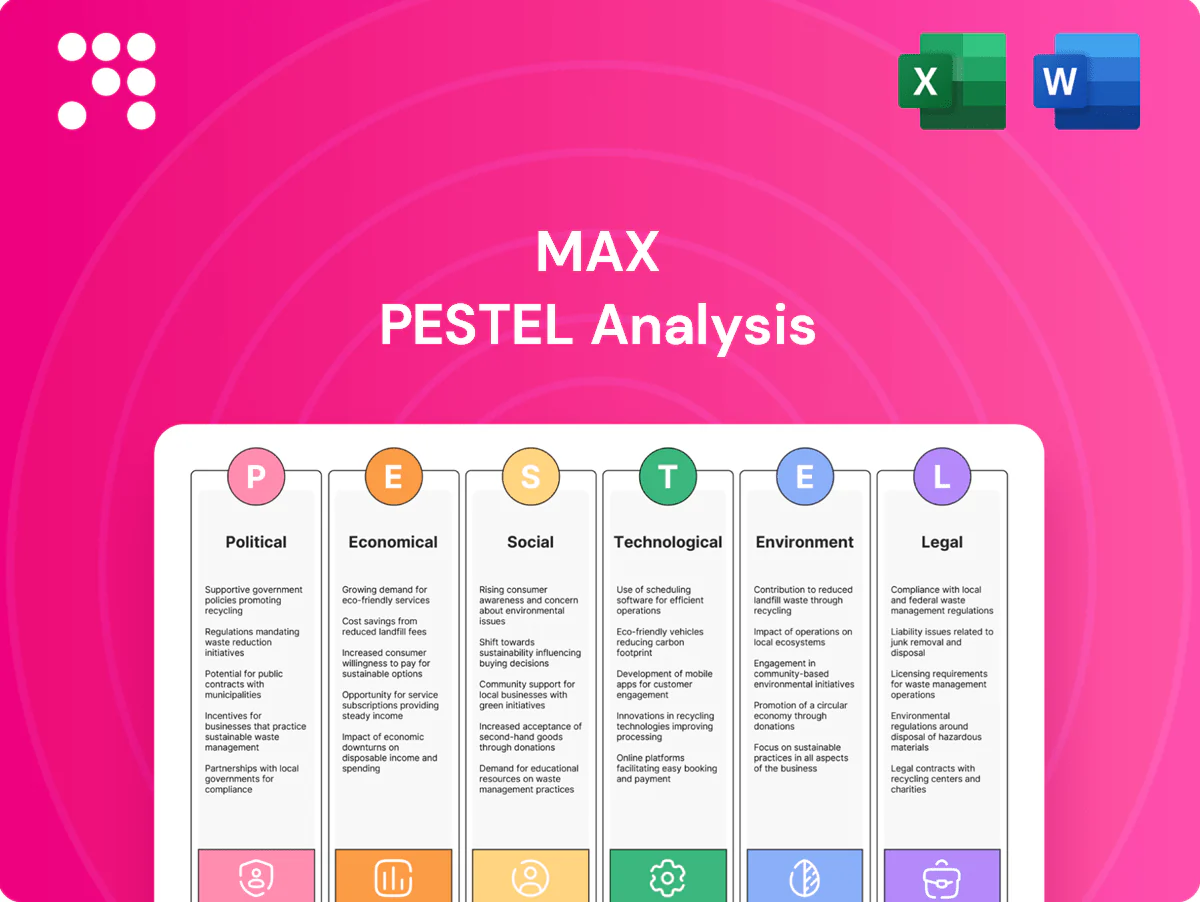
Max PESTLE Analysis

Plan Smarter. Present Sharper. Compete Stronger.
Gain a strategic advantage with our targeted PESTLE Analysis of Max—concise, data-driven and focused on the external forces shaping its future. Understand political, economic, social and technological risks and opportunities that matter to investors and strategists. Ready-to-use and fully editable, it’s built for decision-making. Purchase the full report now to unlock the complete, actionable intelligence.
Political factors

Security tensions and geopolitical risk
Regional instability can disrupt store operations, supply chains and footfall, compounding risks to sales in a year when IMF projected global growth at about 3.2% for 2024. Heightened security incidents drive higher insurance and contingency costs, nudging risk budgets upward and compressing margins. The company should keep flexible inventory buffers and crisis response plans and contract multiple logistics providers to avoid single-point failures.
Import policy, tariffs, and customs
As a value retailer reliant on imports, tariff shifts—such as US duties up to 25% on selected Chinese products—directly squeeze margins and can raise landed costs materially; global applied tariffs average roughly mid-single digits, amplifying risk on thin-margin items. Streamlined digital customs and single-window adoption (120+ countries) can cut clearance times and lower landed cost. Tightened import controls or standards slow assortment refresh cycles and inventory turns. Active vendor diversification across suppliers and regions reduces exposure to policy shocks.

Consumer price oversight and subsidies
Heightened government scrutiny on cost of living — with US CPI at about 3.4% in 2024 and energy price caps covering roughly 22 million UK households — increases pressure to sustain discount pricing. Inquiries into retail markups push retailers toward transparent pricing and audit-ready margin reporting. Targeted subsidies or VAT cuts on essentials in 2024 shifted demand toward staple categories, altering basket mix. Proactive compliance and clear consumer communication preserve brand trust and reduce regulatory risk.

Municipal zoning and permitting
Large-format stores depend on local approvals for sites, signage and parking. NAIOP 2024 found 62% of developers cite zoning/permitting delays; Urban Land Institute 2023 reports average commercial permitting takes 4–9 months. Delays or restrictions raise expansion timing and can increase build-out costs by 5–12%. Early municipal engagement secures terms and retrofits may be needed to meet local standards.
- 62% developers report zoning delays (NAIOP 2024)
- 4–9 months average permitting (ULI 2023)
- Build-out cost uplift 5–12% for retrofits
Public procurement and local sourcing signals
Government encouragement of local manufacturing influences assortment strategy by shifting buy-decisions toward domestic suppliers, lowering exposure to USD/ILS swings (USD/ILS averaged about 3.70 in 2024) and cutting overseas lead times often measured in weeks. Favoring Israeli-made goods strengthens community brand perception and can qualify firms for public procurement programs, but requires careful sourcing to maintain price competitiveness.
- Local sourcing lowers currency risk — USD/ILS ~3.70 (2024)
- Shorter lead times vs global imports
- Positive community brand impact
- Must balance cost to stay competitive
Tariffs, permitting delays and FX squeeze margins amid ~3.2% global growth
Political risks—regional instability, tariffs and cost-of-living interventions—raise operating and inventory costs while pressuring margins; IMF 2024 global growth ~3.2% and US duties up to 25% on some Chinese goods exacerbate margin risk. Zoning delays (62% developers, NAIOP 2024) and 4–9 month permitting (ULI 2023) slow expansion; USD/ILS ~3.70 (2024) affects import costs.
| Metric | Value (2023–24) |
|---|---|
| Global growth (IMF) | ~3.2% (2024) |
| US tariffs | Up to 25% (selected) |
| Avg applied tariffs | ~5% (mid-single) |
| Permitting | 4–9 months (ULI 2023) |
| Zoning delays | 62% developers (NAIOP 2024) |
| USD/ILS | ~3.70 (2024) |
What is included in the product
 Detailed Word Document
Explores how macro-environmental forces uniquely impact the Max across Political, Economic, Social, Technological, Environmental and Legal dimensions, with each category expanded into specific sub-points and examples tied to the relevant region and industry; data-driven, forward-looking insights support scenario planning and help executives, consultants and entrepreneurs identify risks, opportunities and investor-ready strategic actions.

 Customizable Excel Spreadsheet
A concise, visually segmented PESTLE summary that’s easily editable and shareable—ideal for slide decks, team alignment, and client reports—using simple language to surface external risks and market positioning for faster decision-making.
Economic factors

Household purchasing power and inflation
Inflation shrank basket sizes and drove trade-downs, with US CPI peaking at 9.1% in June 2022 and averaging about 3.4% in 2024, often boosting discount formats and private label uptake. Persistent price rises compress margins when cost inflation outpaces pricing power, forcing tighter cost controls. Monitoring category elasticity supports targeted promotions; private label and operational savings defend perceived value.
Exchange rate volatility (ILS vs USD/CNY)
Most imports are USD- or CNY-linked: USD/ILS traded roughly 3.45–3.95 in 2024 while USD/CNY hovered near 7.2–7.4, so shekel weakness raised input costs materially. Active hedging programs (commonly costing ~0.5–1.5% annually) can stabilise gross margins but eat into EBITDA. Rapid swings complicate price-setting and markdown timing, while supplier renegotiations and mixed-currency contracts have trimmed net FX exposure.

Wage growth and labor availability
Tight U.S. labor markets pushed average hourly earnings up about 4.1% year‑over‑year in 2024 (BLS), raising store and DC payrolls and compressing margins. Higher state and local minimum wages and expanded benefits further increase operating expenses for retailers. Adoption of productivity tools and optimized scheduling has been shown to cut unit labor costs roughly 10–15% (industry studies). Strong employer branding can reduce frontline turnover by about 20%, lowering recruitment and training spend.

Freight, ports, and logistics costs
Ocean rates, port congestion and inland transport directly raise landed costs and slow inventory turns; Drewry's World Container Index fell from 2021 peaks toward near‑prepandemic levels by 2024, but volatility persists. Disruptions extend lead times and increase stockout risk. Multi‑port routing and nearshoring improve resilience while demand forecasting aligns containers with replenishment cycles.
- Ocean rates: Drewry WCI normalized by 2024
- Routing: multi‑port cuts single‑point risk
- Strategy: nearshoring + forecasting reduce lead times
Cyclicality and downturn resilience
Cyclicality and downturn resilience: discount retailers typically gain share as consumers trade down, shown during the 2008–09 crisis and the 2020 shock when global GDP fell 3.1% (IMF) and US retail sales plunged 16.4% in April 2020 (US Census), yet severe recessions can still cut total discretionary spend. Assortment agility across essentials and seasonal goods drives outperformance; strict cash-flow discipline enables opportunistic bulk buying and margin protection.
- gain-share: proven in 2008–09 and 2020 downturns
- risk: discretionary spend still vulnerable
- strategy: agile assortment across essentials/seasonal
- finance: cash-flow discipline for opportunistic buying
Tariffs, permitting delays and FX squeeze margins amid ~3.2% global growth
Inflation averaged ~3.4% in 2024, shrinking baskets and boosting private labels and discount formats.
USD/ILS ~3.45–3.95 and USD/CNY ~7.2–7.4 in 2024 raised import costs; hedging costs ~0.5–1.5% pa.
Avg hourly earnings rose ~4.1% in 2024, lifting payrolls; container rates normalized vs 2021 peaks per Drewry.
| Metric | 2024 |
|---|---|
| CPI (US) | ~3.4% |
| USD/ILS | 3.45–3.95 |
| Wages | +4.1% |
Preview the Actual Deliverable
Max PESTLE Analysis
The preview shown here is the exact Max PESTLE Analysis document you’ll receive after purchase—fully formatted and ready to use. The layout, content, and structure visible are the final version with no placeholders or teasers. After checkout you’ll instantly download this same professional, ready-to-use file.

Plan Smarter. Present Sharper. Compete Stronger.
Gain a strategic advantage with our targeted PESTLE Analysis of Max—concise, data-driven and focused on the external forces shaping its future. Understand political, economic, social and technological risks and opportunities that matter to investors and strategists. Ready-to-use and fully editable, it’s built for decision-making. Purchase the full report now to unlock the complete, actionable intelligence.
Political factors
Security tensions and geopolitical risk
Regional instability can disrupt store operations, supply chains and footfall, compounding risks to sales in a year when IMF projected global growth at about 3.2% for 2024. Heightened security incidents drive higher insurance and contingency costs, nudging risk budgets upward and compressing margins. The company should keep flexible inventory buffers and crisis response plans and contract multiple logistics providers to avoid single-point failures.
Import policy, tariffs, and customs
As a value retailer reliant on imports, tariff shifts—such as US duties up to 25% on selected Chinese products—directly squeeze margins and can raise landed costs materially; global applied tariffs average roughly mid-single digits, amplifying risk on thin-margin items. Streamlined digital customs and single-window adoption (120+ countries) can cut clearance times and lower landed cost. Tightened import controls or standards slow assortment refresh cycles and inventory turns. Active vendor diversification across suppliers and regions reduces exposure to policy shocks.
Consumer price oversight and subsidies
Heightened government scrutiny on cost of living — with US CPI at about 3.4% in 2024 and energy price caps covering roughly 22 million UK households — increases pressure to sustain discount pricing. Inquiries into retail markups push retailers toward transparent pricing and audit-ready margin reporting. Targeted subsidies or VAT cuts on essentials in 2024 shifted demand toward staple categories, altering basket mix. Proactive compliance and clear consumer communication preserve brand trust and reduce regulatory risk.
Municipal zoning and permitting
Large-format stores depend on local approvals for sites, signage and parking. NAIOP 2024 found 62% of developers cite zoning/permitting delays; Urban Land Institute 2023 reports average commercial permitting takes 4–9 months. Delays or restrictions raise expansion timing and can increase build-out costs by 5–12%. Early municipal engagement secures terms and retrofits may be needed to meet local standards.
- 62% developers report zoning delays (NAIOP 2024)
- 4–9 months average permitting (ULI 2023)
- Build-out cost uplift 5–12% for retrofits
Public procurement and local sourcing signals
Government encouragement of local manufacturing influences assortment strategy by shifting buy-decisions toward domestic suppliers, lowering exposure to USD/ILS swings (USD/ILS averaged about 3.70 in 2024) and cutting overseas lead times often measured in weeks. Favoring Israeli-made goods strengthens community brand perception and can qualify firms for public procurement programs, but requires careful sourcing to maintain price competitiveness.
- Local sourcing lowers currency risk — USD/ILS ~3.70 (2024)
- Shorter lead times vs global imports
- Positive community brand impact
- Must balance cost to stay competitive
Tariffs, permitting delays and FX squeeze margins amid ~3.2% global growth
Political risks—regional instability, tariffs and cost-of-living interventions—raise operating and inventory costs while pressuring margins; IMF 2024 global growth ~3.2% and US duties up to 25% on some Chinese goods exacerbate margin risk. Zoning delays (62% developers, NAIOP 2024) and 4–9 month permitting (ULI 2023) slow expansion; USD/ILS ~3.70 (2024) affects import costs.
| Metric | Value (2023–24) |
|---|---|
| Global growth (IMF) | ~3.2% (2024) |
| US tariffs | Up to 25% (selected) |
| Avg applied tariffs | ~5% (mid-single) |
| Permitting | 4–9 months (ULI 2023) |
| Zoning delays | 62% developers (NAIOP 2024) |
| USD/ILS | ~3.70 (2024) |
What is included in the product
Detailed Word Document
Explores how macro-environmental forces uniquely impact the Max across Political, Economic, Social, Technological, Environmental and Legal dimensions, with each category expanded into specific sub-points and examples tied to the relevant region and industry; data-driven, forward-looking insights support scenario planning and help executives, consultants and entrepreneurs identify risks, opportunities and investor-ready strategic actions.
Customizable Excel Spreadsheet
A concise, visually segmented PESTLE summary that’s easily editable and shareable—ideal for slide decks, team alignment, and client reports—using simple language to surface external risks and market positioning for faster decision-making.
Economic factors
Household purchasing power and inflation
Inflation shrank basket sizes and drove trade-downs, with US CPI peaking at 9.1% in June 2022 and averaging about 3.4% in 2024, often boosting discount formats and private label uptake. Persistent price rises compress margins when cost inflation outpaces pricing power, forcing tighter cost controls. Monitoring category elasticity supports targeted promotions; private label and operational savings defend perceived value.
Exchange rate volatility (ILS vs USD/CNY)
Most imports are USD- or CNY-linked: USD/ILS traded roughly 3.45–3.95 in 2024 while USD/CNY hovered near 7.2–7.4, so shekel weakness raised input costs materially. Active hedging programs (commonly costing ~0.5–1.5% annually) can stabilise gross margins but eat into EBITDA. Rapid swings complicate price-setting and markdown timing, while supplier renegotiations and mixed-currency contracts have trimmed net FX exposure.
Wage growth and labor availability
Tight U.S. labor markets pushed average hourly earnings up about 4.1% year‑over‑year in 2024 (BLS), raising store and DC payrolls and compressing margins. Higher state and local minimum wages and expanded benefits further increase operating expenses for retailers. Adoption of productivity tools and optimized scheduling has been shown to cut unit labor costs roughly 10–15% (industry studies). Strong employer branding can reduce frontline turnover by about 20%, lowering recruitment and training spend.
Freight, ports, and logistics costs
Ocean rates, port congestion and inland transport directly raise landed costs and slow inventory turns; Drewry's World Container Index fell from 2021 peaks toward near‑prepandemic levels by 2024, but volatility persists. Disruptions extend lead times and increase stockout risk. Multi‑port routing and nearshoring improve resilience while demand forecasting aligns containers with replenishment cycles.
- Ocean rates: Drewry WCI normalized by 2024
- Routing: multi‑port cuts single‑point risk
- Strategy: nearshoring + forecasting reduce lead times
Cyclicality and downturn resilience
Cyclicality and downturn resilience: discount retailers typically gain share as consumers trade down, shown during the 2008–09 crisis and the 2020 shock when global GDP fell 3.1% (IMF) and US retail sales plunged 16.4% in April 2020 (US Census), yet severe recessions can still cut total discretionary spend. Assortment agility across essentials and seasonal goods drives outperformance; strict cash-flow discipline enables opportunistic bulk buying and margin protection.
- gain-share: proven in 2008–09 and 2020 downturns
- risk: discretionary spend still vulnerable
- strategy: agile assortment across essentials/seasonal
- finance: cash-flow discipline for opportunistic buying
Tariffs, permitting delays and FX squeeze margins amid ~3.2% global growth
Inflation averaged ~3.4% in 2024, shrinking baskets and boosting private labels and discount formats.
USD/ILS ~3.45–3.95 and USD/CNY ~7.2–7.4 in 2024 raised import costs; hedging costs ~0.5–1.5% pa.
Avg hourly earnings rose ~4.1% in 2024, lifting payrolls; container rates normalized vs 2021 peaks per Drewry.
| Metric | 2024 |
|---|---|
| CPI (US) | ~3.4% |
| USD/ILS | 3.45–3.95 |
| Wages | +4.1% |
Preview the Actual Deliverable
Max PESTLE Analysis
The preview shown here is the exact Max PESTLE Analysis document you’ll receive after purchase—fully formatted and ready to use. The layout, content, and structure visible are the final version with no placeholders or teasers. After checkout you’ll instantly download this same professional, ready-to-use file.
Description
Plan Smarter. Present Sharper. Compete Stronger.
Gain a strategic advantage with our targeted PESTLE Analysis of Max—concise, data-driven and focused on the external forces shaping its future. Understand political, economic, social and technological risks and opportunities that matter to investors and strategists. Ready-to-use and fully editable, it’s built for decision-making. Purchase the full report now to unlock the complete, actionable intelligence.
Political factors
Security tensions and geopolitical risk
Regional instability can disrupt store operations, supply chains and footfall, compounding risks to sales in a year when IMF projected global growth at about 3.2% for 2024. Heightened security incidents drive higher insurance and contingency costs, nudging risk budgets upward and compressing margins. The company should keep flexible inventory buffers and crisis response plans and contract multiple logistics providers to avoid single-point failures.
Import policy, tariffs, and customs
As a value retailer reliant on imports, tariff shifts—such as US duties up to 25% on selected Chinese products—directly squeeze margins and can raise landed costs materially; global applied tariffs average roughly mid-single digits, amplifying risk on thin-margin items. Streamlined digital customs and single-window adoption (120+ countries) can cut clearance times and lower landed cost. Tightened import controls or standards slow assortment refresh cycles and inventory turns. Active vendor diversification across suppliers and regions reduces exposure to policy shocks.
Consumer price oversight and subsidies
Heightened government scrutiny on cost of living — with US CPI at about 3.4% in 2024 and energy price caps covering roughly 22 million UK households — increases pressure to sustain discount pricing. Inquiries into retail markups push retailers toward transparent pricing and audit-ready margin reporting. Targeted subsidies or VAT cuts on essentials in 2024 shifted demand toward staple categories, altering basket mix. Proactive compliance and clear consumer communication preserve brand trust and reduce regulatory risk.
Municipal zoning and permitting
Large-format stores depend on local approvals for sites, signage and parking. NAIOP 2024 found 62% of developers cite zoning/permitting delays; Urban Land Institute 2023 reports average commercial permitting takes 4–9 months. Delays or restrictions raise expansion timing and can increase build-out costs by 5–12%. Early municipal engagement secures terms and retrofits may be needed to meet local standards.
- 62% developers report zoning delays (NAIOP 2024)
- 4–9 months average permitting (ULI 2023)
- Build-out cost uplift 5–12% for retrofits
Public procurement and local sourcing signals
Government encouragement of local manufacturing influences assortment strategy by shifting buy-decisions toward domestic suppliers, lowering exposure to USD/ILS swings (USD/ILS averaged about 3.70 in 2024) and cutting overseas lead times often measured in weeks. Favoring Israeli-made goods strengthens community brand perception and can qualify firms for public procurement programs, but requires careful sourcing to maintain price competitiveness.
- Local sourcing lowers currency risk — USD/ILS ~3.70 (2024)
- Shorter lead times vs global imports
- Positive community brand impact
- Must balance cost to stay competitive
Tariffs, permitting delays and FX squeeze margins amid ~3.2% global growth
Political risks—regional instability, tariffs and cost-of-living interventions—raise operating and inventory costs while pressuring margins; IMF 2024 global growth ~3.2% and US duties up to 25% on some Chinese goods exacerbate margin risk. Zoning delays (62% developers, NAIOP 2024) and 4–9 month permitting (ULI 2023) slow expansion; USD/ILS ~3.70 (2024) affects import costs.
| Metric | Value (2023–24) |
|---|---|
| Global growth (IMF) | ~3.2% (2024) |
| US tariffs | Up to 25% (selected) |
| Avg applied tariffs | ~5% (mid-single) |
| Permitting | 4–9 months (ULI 2023) |
| Zoning delays | 62% developers (NAIOP 2024) |
| USD/ILS | ~3.70 (2024) |
What is included in the product
Detailed Word Document
Explores how macro-environmental forces uniquely impact the Max across Political, Economic, Social, Technological, Environmental and Legal dimensions, with each category expanded into specific sub-points and examples tied to the relevant region and industry; data-driven, forward-looking insights support scenario planning and help executives, consultants and entrepreneurs identify risks, opportunities and investor-ready strategic actions.
Customizable Excel Spreadsheet
A concise, visually segmented PESTLE summary that’s easily editable and shareable—ideal for slide decks, team alignment, and client reports—using simple language to surface external risks and market positioning for faster decision-making.
Economic factors
Household purchasing power and inflation
Inflation shrank basket sizes and drove trade-downs, with US CPI peaking at 9.1% in June 2022 and averaging about 3.4% in 2024, often boosting discount formats and private label uptake. Persistent price rises compress margins when cost inflation outpaces pricing power, forcing tighter cost controls. Monitoring category elasticity supports targeted promotions; private label and operational savings defend perceived value.
Exchange rate volatility (ILS vs USD/CNY)
Most imports are USD- or CNY-linked: USD/ILS traded roughly 3.45–3.95 in 2024 while USD/CNY hovered near 7.2–7.4, so shekel weakness raised input costs materially. Active hedging programs (commonly costing ~0.5–1.5% annually) can stabilise gross margins but eat into EBITDA. Rapid swings complicate price-setting and markdown timing, while supplier renegotiations and mixed-currency contracts have trimmed net FX exposure.
Wage growth and labor availability
Tight U.S. labor markets pushed average hourly earnings up about 4.1% year‑over‑year in 2024 (BLS), raising store and DC payrolls and compressing margins. Higher state and local minimum wages and expanded benefits further increase operating expenses for retailers. Adoption of productivity tools and optimized scheduling has been shown to cut unit labor costs roughly 10–15% (industry studies). Strong employer branding can reduce frontline turnover by about 20%, lowering recruitment and training spend.
Freight, ports, and logistics costs
Ocean rates, port congestion and inland transport directly raise landed costs and slow inventory turns; Drewry's World Container Index fell from 2021 peaks toward near‑prepandemic levels by 2024, but volatility persists. Disruptions extend lead times and increase stockout risk. Multi‑port routing and nearshoring improve resilience while demand forecasting aligns containers with replenishment cycles.
- Ocean rates: Drewry WCI normalized by 2024
- Routing: multi‑port cuts single‑point risk
- Strategy: nearshoring + forecasting reduce lead times
Cyclicality and downturn resilience
Cyclicality and downturn resilience: discount retailers typically gain share as consumers trade down, shown during the 2008–09 crisis and the 2020 shock when global GDP fell 3.1% (IMF) and US retail sales plunged 16.4% in April 2020 (US Census), yet severe recessions can still cut total discretionary spend. Assortment agility across essentials and seasonal goods drives outperformance; strict cash-flow discipline enables opportunistic bulk buying and margin protection.
- gain-share: proven in 2008–09 and 2020 downturns
- risk: discretionary spend still vulnerable
- strategy: agile assortment across essentials/seasonal
- finance: cash-flow discipline for opportunistic buying
Tariffs, permitting delays and FX squeeze margins amid ~3.2% global growth
Inflation averaged ~3.4% in 2024, shrinking baskets and boosting private labels and discount formats.
USD/ILS ~3.45–3.95 and USD/CNY ~7.2–7.4 in 2024 raised import costs; hedging costs ~0.5–1.5% pa.
Avg hourly earnings rose ~4.1% in 2024, lifting payrolls; container rates normalized vs 2021 peaks per Drewry.
| Metric | 2024 |
|---|---|
| CPI (US) | ~3.4% |
| USD/ILS | 3.45–3.95 |
| Wages | +4.1% |
Preview the Actual Deliverable
Max PESTLE Analysis
The preview shown here is the exact Max PESTLE Analysis document you’ll receive after purchase—fully formatted and ready to use. The layout, content, and structure visible are the final version with no placeholders or teasers. After checkout you’ll instantly download this same professional, ready-to-use file.











