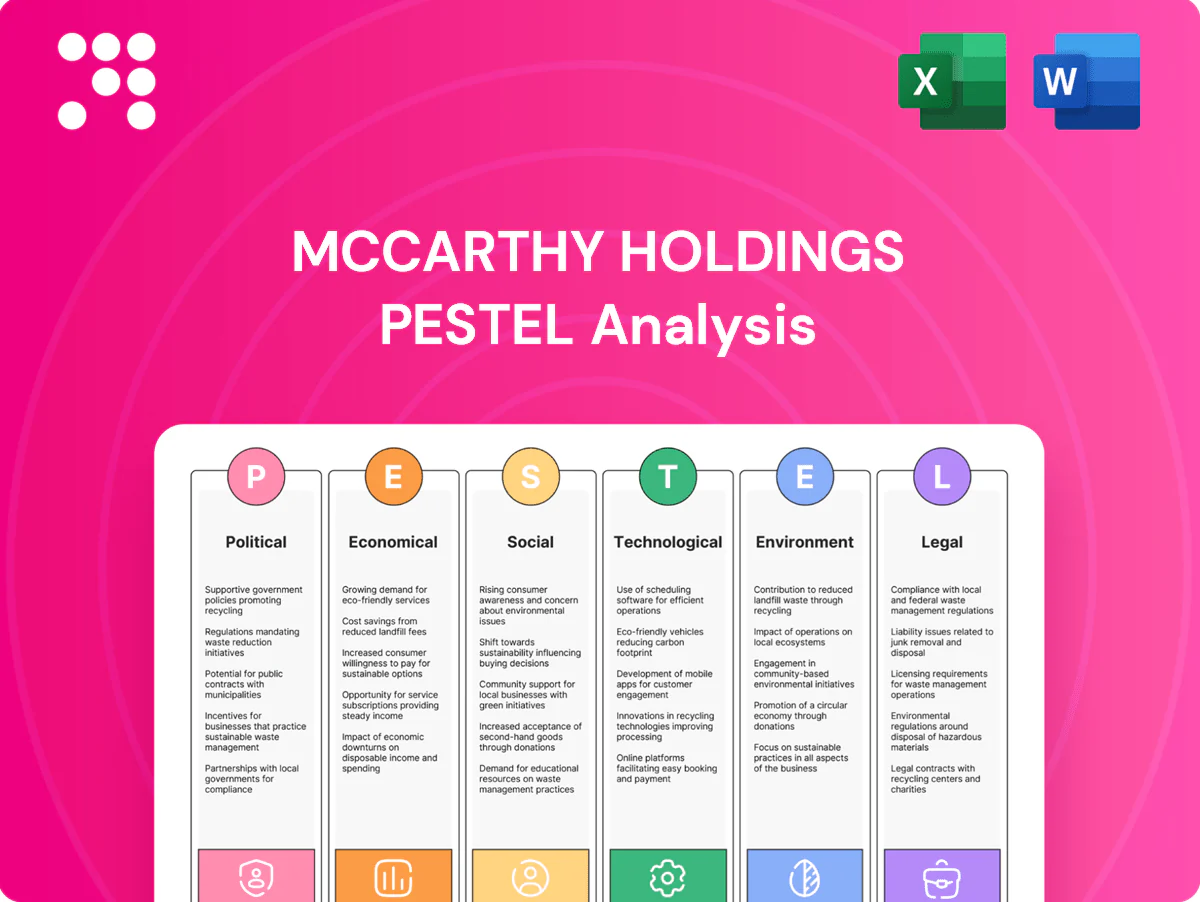
McCarthy Holdings PESTLE Analysis

Make Smarter Strategic Decisions with a Complete PESTEL View
Discover how political shifts, economic cycles, social trends, technological advances, legal changes, and environmental pressures are reshaping McCarthy Holdings’ strategic landscape in our targeted PESTLE analysis. Packed with actionable insights for investors, advisors, and executives, this concise briefing highlights risks and growth levers you can act on today. Purchase the full report to get the complete, editable analysis for immediate use.
Political factors

Federal infrastructure priorities
Since the 2021 Bipartisan Infrastructure Law committed roughly $1.2 trillion total, including about $550 billion in new federal investment, shifts in federal bills and appropriations strongly affect McCarthy’s backlog visibility across healthcare, civil and education projects. Increased public spending expands funded opportunities and can ease competitive pressure, while continuing resolutions and budget gridlock—seen in FY2023–24—delay awards and stretch receivable cycles. McCarthy must align pursuit strategy to earmarks, grant timelines and agency priorities to capture accelerated bids.
State and local procurement dynamics
State and local procurement rules, bonding requirements and best-value vs low-bid policies vary widely across jurisdictions, shaping bid strategy and cash needs; federal IIJA’s $550 billion infrastructure package continues to flow funds to states and municipalities. Changes in local leadership can quickly reset project pipelines, so local prequalification and relationship-building are critical to predict win rates. Design-build friendly jurisdictions favor McCarthy’s integrated delivery capability.

Permitting and approvals cadence
Political will around zoning, CEQA and NEPA reviews and community approvals materially affects McCarthy Holdings project start dates: CEQA EIRs typically take 18–36 months and NEPA EIS 2–5 years, pushing construction out and tying up capital. Jurisdictions with accelerated permitting have reported timeline cuts of ~20–30%, compressing preconstruction and improving cash conversion. Opposition or policy reversals can force costly scope changes and delays. Early stakeholder engagement reduces entitlement risk and litigation exposure.

Energy policy and incentives
The Inflation Reduction Act's roughly $369 billion in clean-energy incentives and extended ITC/PTC frameworks have boosted demand for solar, storage and transmission; recent PTC eligibility for standalone storage and enhanced ITC rates through the 2030s increase project returns. Policy stability drives owner and financier commitments, while interconnection and regional transmission rules remain political chokepoints; McCarthy can time bids to incentive windows and regulatory clarity.
- IRA funding ~369 billion — expands ITC/PTC reach
- PTC now applies to standalone storage — lifts economics
- Interconnection queues/regional transmission policy are chokepoints
- McCarthy can align pursuits with credit windows and regulatory guidance
Workforce and immigration stance
Federal and state immigration stances and public-works labor rules are tightening, and BLS/DOL data show construction vacancies remained elevated through 2023–24, constraining craft availability and lifting wage pressure for McCarthy on mega-projects.
Stronger apprenticeship standards and workforce-development funding—including DOL grants for training—can expand capacity but require proactive engagement with unions, apprenticeship programs, and policymakers to secure labor pipelines for projects exceeding $100m.
Strategy: deepen union partnerships, scale internal training, and lobby for pragmatic immigration and apprenticeship policy to mitigate rising labor costs and schedule risk.
- Elevated vacancies — sustained wage inflation risk
- Apprenticeship funding can expand capacity for mega-projects
- Engage unions, training programs, policymakers
Pursue $1.2T IIJA and $369B IRA windows; plan for permitting delays
Federal infrastructure (IIJA $1.2T, $550B new) and IRA ($369B) funding materially expand funded opportunities and shorten competitive pressure windows, while budget gridlock and permitting (CEQA 18–36 months; NEPA 2–5 years) lengthen start dates. State/local procurement, bonding and shifting leadership alter bid/cash needs; construction labor shortages keep wage pressure elevated. McCarthy should align pursuits to incentive windows, agency priorities and local prequalification.
| Metric | Value |
|---|---|
| IIJA total | $1.2T |
| IIJA new | $550B |
| IRA funding | $369B |
| CEQA/NEPA timelines | 18–36m / 2–5y |
What is included in the product
 Detailed Word Document
Provides a concise PESTLE review of how Political, Economic, Social, Technological, Environmental, and Legal forces uniquely affect McCarthy Holdings, with data-driven trends and region-specific examples. Designed for executives and investors, it highlights strategic risks and opportunities to inform planning, funding, and competitive positioning.

 Customizable Excel Spreadsheet
Condensed McCarthy Holdings PESTLE delivers a visually segmented, editable summary that eases meeting prep and stakeholder alignment by distilling regulatory, economic, social, technological, environmental and legal risks into slide-ready, shareable notes.
Economic factors

Interest rates and capital costs
Higher rates raise owners’ WACC, with the Fed funds rate about 5.25–5.50% and the 10-year Treasury near 4.4% as of July 2025, prompting deferral of private developments and some P3s while favoring essential public projects. Financing costs increase bonding and working capital requirements. Rate volatility complicates GMP and escalation assumptions. Hedging and escalation clauses are used to protect margins.
Construction input inflation
Material cost moves for steel, concrete, electrical gear and equipment rentals materially drive McCarthy project pricing, with contingencies typically sized at 5–10% to protect margins. Supply-chain normalization remains uneven by category, creating bid risk and schedule exposure. Accurate cost indexing and strategic supplier alliances improve estimate fidelity, while procurement timing and contingency drawdowns are critical margin levers.

Labor market tightness
Skilled trades scarcity—reported by the ABC 2024 survey as affecting roughly 81% of contractors—pushes wages and subcontractor premiums higher (construction wages up about 5.2% YoY in 2024 per BLS), driving overtime and margins pressure; productivity losses can delay schedules and raise liquidated-damage risk, while investments in self-perform, training and predictive staffing align crews to peak workloads and stabilize delivery.

Public vs private demand mix
Public countercyclical spending in healthcare, education and civil infrastructure—supported by the $1.2 trillion IIJA—can offset private commercial slowdowns, stabilizing McCarthy’s project intake. Corporate capex cycles drive variability: labs and data centers rise with tech spending while offices lag. A balanced end-market portfolio smooths revenue and keeps backlog resilient.
Owner solvency and payment risk
Macro slowdowns heighten collection risk and change-order disputes, as seen industry-wide when project delays push payment cycles; McCarthy reported roughly $5.5B revenue in 2023, underscoring scale exposure. Strong credit vetting and rigorous lien-rights enforcement have protected cash flow and reduced bad-debt write-offs. Negotiating milestone payments shifts risk off WIP and stabilizes liquidity. A diversified client base mitigates concentration risk across sectors.
- Collection risk: higher during slowdowns
- Credit vetting: protects cash flow
- Milestone payments: reduce WIP exposure
- Diversification: lowers client concentration risk
Pursue $1.2T IIJA and $369B IRA windows; plan for permitting delays
Higher rates (Fed funds 5.25–5.50%, 10y Treasury ~4.4% July 2025) raise WACC, slow private builds and boost public essential projects; financing, bonding and escalation clauses increasingly shape bids. Material cost swings (contingencies 5–10%) and uneven supply chains drive bid risk. Skilled-trade scarcity (ABC 2024: ~81%) and construction wages +5.2% YoY (BLS 2024) pressure margins; IIJA $1.2T supports public backlog.
| Metric | Value (latest) |
|---|---|
| Fed funds | 5.25–5.50% |
| 10y Treasury | ~4.4% |
| McCarthy revenue (2023) | $5.5B |
| IIJA | $1.2T |
| Skilled trades shortage | ~81% (ABC 2024) |
| Construction wages YoY | +5.2% (BLS 2024) |
| Contingency sizing | 5–10% |
What You See Is What You Get
McCarthy Holdings PESTLE Analysis
The McCarthy Holdings PESTLE Analysis shown here is the exact document you’ll receive after purchase—fully formatted and ready to use. It provides a concise review of political, economic, social, technological, legal and environmental factors affecting McCarthy. No placeholders or teasers—this is the real, finished file available for immediate download.

Make Smarter Strategic Decisions with a Complete PESTEL View
Discover how political shifts, economic cycles, social trends, technological advances, legal changes, and environmental pressures are reshaping McCarthy Holdings’ strategic landscape in our targeted PESTLE analysis. Packed with actionable insights for investors, advisors, and executives, this concise briefing highlights risks and growth levers you can act on today. Purchase the full report to get the complete, editable analysis for immediate use.
Political factors
Federal infrastructure priorities
Since the 2021 Bipartisan Infrastructure Law committed roughly $1.2 trillion total, including about $550 billion in new federal investment, shifts in federal bills and appropriations strongly affect McCarthy’s backlog visibility across healthcare, civil and education projects. Increased public spending expands funded opportunities and can ease competitive pressure, while continuing resolutions and budget gridlock—seen in FY2023–24—delay awards and stretch receivable cycles. McCarthy must align pursuit strategy to earmarks, grant timelines and agency priorities to capture accelerated bids.
State and local procurement dynamics
State and local procurement rules, bonding requirements and best-value vs low-bid policies vary widely across jurisdictions, shaping bid strategy and cash needs; federal IIJA’s $550 billion infrastructure package continues to flow funds to states and municipalities. Changes in local leadership can quickly reset project pipelines, so local prequalification and relationship-building are critical to predict win rates. Design-build friendly jurisdictions favor McCarthy’s integrated delivery capability.
Permitting and approvals cadence
Political will around zoning, CEQA and NEPA reviews and community approvals materially affects McCarthy Holdings project start dates: CEQA EIRs typically take 18–36 months and NEPA EIS 2–5 years, pushing construction out and tying up capital. Jurisdictions with accelerated permitting have reported timeline cuts of ~20–30%, compressing preconstruction and improving cash conversion. Opposition or policy reversals can force costly scope changes and delays. Early stakeholder engagement reduces entitlement risk and litigation exposure.
Energy policy and incentives
The Inflation Reduction Act's roughly $369 billion in clean-energy incentives and extended ITC/PTC frameworks have boosted demand for solar, storage and transmission; recent PTC eligibility for standalone storage and enhanced ITC rates through the 2030s increase project returns. Policy stability drives owner and financier commitments, while interconnection and regional transmission rules remain political chokepoints; McCarthy can time bids to incentive windows and regulatory clarity.
- IRA funding ~369 billion — expands ITC/PTC reach
- PTC now applies to standalone storage — lifts economics
- Interconnection queues/regional transmission policy are chokepoints
- McCarthy can align pursuits with credit windows and regulatory guidance
Workforce and immigration stance
Federal and state immigration stances and public-works labor rules are tightening, and BLS/DOL data show construction vacancies remained elevated through 2023–24, constraining craft availability and lifting wage pressure for McCarthy on mega-projects.
Stronger apprenticeship standards and workforce-development funding—including DOL grants for training—can expand capacity but require proactive engagement with unions, apprenticeship programs, and policymakers to secure labor pipelines for projects exceeding $100m.
Strategy: deepen union partnerships, scale internal training, and lobby for pragmatic immigration and apprenticeship policy to mitigate rising labor costs and schedule risk.
- Elevated vacancies — sustained wage inflation risk
- Apprenticeship funding can expand capacity for mega-projects
- Engage unions, training programs, policymakers
Pursue $1.2T IIJA and $369B IRA windows; plan for permitting delays
Federal infrastructure (IIJA $1.2T, $550B new) and IRA ($369B) funding materially expand funded opportunities and shorten competitive pressure windows, while budget gridlock and permitting (CEQA 18–36 months; NEPA 2–5 years) lengthen start dates. State/local procurement, bonding and shifting leadership alter bid/cash needs; construction labor shortages keep wage pressure elevated. McCarthy should align pursuits to incentive windows, agency priorities and local prequalification.
| Metric | Value |
|---|---|
| IIJA total | $1.2T |
| IIJA new | $550B |
| IRA funding | $369B |
| CEQA/NEPA timelines | 18–36m / 2–5y |
What is included in the product
Detailed Word Document
Provides a concise PESTLE review of how Political, Economic, Social, Technological, Environmental, and Legal forces uniquely affect McCarthy Holdings, with data-driven trends and region-specific examples. Designed for executives and investors, it highlights strategic risks and opportunities to inform planning, funding, and competitive positioning.
Customizable Excel Spreadsheet
Condensed McCarthy Holdings PESTLE delivers a visually segmented, editable summary that eases meeting prep and stakeholder alignment by distilling regulatory, economic, social, technological, environmental and legal risks into slide-ready, shareable notes.
Economic factors
Interest rates and capital costs
Higher rates raise owners’ WACC, with the Fed funds rate about 5.25–5.50% and the 10-year Treasury near 4.4% as of July 2025, prompting deferral of private developments and some P3s while favoring essential public projects. Financing costs increase bonding and working capital requirements. Rate volatility complicates GMP and escalation assumptions. Hedging and escalation clauses are used to protect margins.
Construction input inflation
Material cost moves for steel, concrete, electrical gear and equipment rentals materially drive McCarthy project pricing, with contingencies typically sized at 5–10% to protect margins. Supply-chain normalization remains uneven by category, creating bid risk and schedule exposure. Accurate cost indexing and strategic supplier alliances improve estimate fidelity, while procurement timing and contingency drawdowns are critical margin levers.
Labor market tightness
Skilled trades scarcity—reported by the ABC 2024 survey as affecting roughly 81% of contractors—pushes wages and subcontractor premiums higher (construction wages up about 5.2% YoY in 2024 per BLS), driving overtime and margins pressure; productivity losses can delay schedules and raise liquidated-damage risk, while investments in self-perform, training and predictive staffing align crews to peak workloads and stabilize delivery.
Public vs private demand mix
Public countercyclical spending in healthcare, education and civil infrastructure—supported by the $1.2 trillion IIJA—can offset private commercial slowdowns, stabilizing McCarthy’s project intake. Corporate capex cycles drive variability: labs and data centers rise with tech spending while offices lag. A balanced end-market portfolio smooths revenue and keeps backlog resilient.
Owner solvency and payment risk
Macro slowdowns heighten collection risk and change-order disputes, as seen industry-wide when project delays push payment cycles; McCarthy reported roughly $5.5B revenue in 2023, underscoring scale exposure. Strong credit vetting and rigorous lien-rights enforcement have protected cash flow and reduced bad-debt write-offs. Negotiating milestone payments shifts risk off WIP and stabilizes liquidity. A diversified client base mitigates concentration risk across sectors.
- Collection risk: higher during slowdowns
- Credit vetting: protects cash flow
- Milestone payments: reduce WIP exposure
- Diversification: lowers client concentration risk
Pursue $1.2T IIJA and $369B IRA windows; plan for permitting delays
Higher rates (Fed funds 5.25–5.50%, 10y Treasury ~4.4% July 2025) raise WACC, slow private builds and boost public essential projects; financing, bonding and escalation clauses increasingly shape bids. Material cost swings (contingencies 5–10%) and uneven supply chains drive bid risk. Skilled-trade scarcity (ABC 2024: ~81%) and construction wages +5.2% YoY (BLS 2024) pressure margins; IIJA $1.2T supports public backlog.
| Metric | Value (latest) |
|---|---|
| Fed funds | 5.25–5.50% |
| 10y Treasury | ~4.4% |
| McCarthy revenue (2023) | $5.5B |
| IIJA | $1.2T |
| Skilled trades shortage | ~81% (ABC 2024) |
| Construction wages YoY | +5.2% (BLS 2024) |
| Contingency sizing | 5–10% |
What You See Is What You Get
McCarthy Holdings PESTLE Analysis
The McCarthy Holdings PESTLE Analysis shown here is the exact document you’ll receive after purchase—fully formatted and ready to use. It provides a concise review of political, economic, social, technological, legal and environmental factors affecting McCarthy. No placeholders or teasers—this is the real, finished file available for immediate download.
Original: $10.00
-65%$10.00
$3.50Description
Make Smarter Strategic Decisions with a Complete PESTEL View
Discover how political shifts, economic cycles, social trends, technological advances, legal changes, and environmental pressures are reshaping McCarthy Holdings’ strategic landscape in our targeted PESTLE analysis. Packed with actionable insights for investors, advisors, and executives, this concise briefing highlights risks and growth levers you can act on today. Purchase the full report to get the complete, editable analysis for immediate use.
Political factors
Federal infrastructure priorities
Since the 2021 Bipartisan Infrastructure Law committed roughly $1.2 trillion total, including about $550 billion in new federal investment, shifts in federal bills and appropriations strongly affect McCarthy’s backlog visibility across healthcare, civil and education projects. Increased public spending expands funded opportunities and can ease competitive pressure, while continuing resolutions and budget gridlock—seen in FY2023–24—delay awards and stretch receivable cycles. McCarthy must align pursuit strategy to earmarks, grant timelines and agency priorities to capture accelerated bids.
State and local procurement dynamics
State and local procurement rules, bonding requirements and best-value vs low-bid policies vary widely across jurisdictions, shaping bid strategy and cash needs; federal IIJA’s $550 billion infrastructure package continues to flow funds to states and municipalities. Changes in local leadership can quickly reset project pipelines, so local prequalification and relationship-building are critical to predict win rates. Design-build friendly jurisdictions favor McCarthy’s integrated delivery capability.
Permitting and approvals cadence
Political will around zoning, CEQA and NEPA reviews and community approvals materially affects McCarthy Holdings project start dates: CEQA EIRs typically take 18–36 months and NEPA EIS 2–5 years, pushing construction out and tying up capital. Jurisdictions with accelerated permitting have reported timeline cuts of ~20–30%, compressing preconstruction and improving cash conversion. Opposition or policy reversals can force costly scope changes and delays. Early stakeholder engagement reduces entitlement risk and litigation exposure.
Energy policy and incentives
The Inflation Reduction Act's roughly $369 billion in clean-energy incentives and extended ITC/PTC frameworks have boosted demand for solar, storage and transmission; recent PTC eligibility for standalone storage and enhanced ITC rates through the 2030s increase project returns. Policy stability drives owner and financier commitments, while interconnection and regional transmission rules remain political chokepoints; McCarthy can time bids to incentive windows and regulatory clarity.
- IRA funding ~369 billion — expands ITC/PTC reach
- PTC now applies to standalone storage — lifts economics
- Interconnection queues/regional transmission policy are chokepoints
- McCarthy can align pursuits with credit windows and regulatory guidance
Workforce and immigration stance
Federal and state immigration stances and public-works labor rules are tightening, and BLS/DOL data show construction vacancies remained elevated through 2023–24, constraining craft availability and lifting wage pressure for McCarthy on mega-projects.
Stronger apprenticeship standards and workforce-development funding—including DOL grants for training—can expand capacity but require proactive engagement with unions, apprenticeship programs, and policymakers to secure labor pipelines for projects exceeding $100m.
Strategy: deepen union partnerships, scale internal training, and lobby for pragmatic immigration and apprenticeship policy to mitigate rising labor costs and schedule risk.
- Elevated vacancies — sustained wage inflation risk
- Apprenticeship funding can expand capacity for mega-projects
- Engage unions, training programs, policymakers
Pursue $1.2T IIJA and $369B IRA windows; plan for permitting delays
Federal infrastructure (IIJA $1.2T, $550B new) and IRA ($369B) funding materially expand funded opportunities and shorten competitive pressure windows, while budget gridlock and permitting (CEQA 18–36 months; NEPA 2–5 years) lengthen start dates. State/local procurement, bonding and shifting leadership alter bid/cash needs; construction labor shortages keep wage pressure elevated. McCarthy should align pursuits to incentive windows, agency priorities and local prequalification.
| Metric | Value |
|---|---|
| IIJA total | $1.2T |
| IIJA new | $550B |
| IRA funding | $369B |
| CEQA/NEPA timelines | 18–36m / 2–5y |
What is included in the product
Detailed Word Document
Provides a concise PESTLE review of how Political, Economic, Social, Technological, Environmental, and Legal forces uniquely affect McCarthy Holdings, with data-driven trends and region-specific examples. Designed for executives and investors, it highlights strategic risks and opportunities to inform planning, funding, and competitive positioning.
Customizable Excel Spreadsheet
Condensed McCarthy Holdings PESTLE delivers a visually segmented, editable summary that eases meeting prep and stakeholder alignment by distilling regulatory, economic, social, technological, environmental and legal risks into slide-ready, shareable notes.
Economic factors
Interest rates and capital costs
Higher rates raise owners’ WACC, with the Fed funds rate about 5.25–5.50% and the 10-year Treasury near 4.4% as of July 2025, prompting deferral of private developments and some P3s while favoring essential public projects. Financing costs increase bonding and working capital requirements. Rate volatility complicates GMP and escalation assumptions. Hedging and escalation clauses are used to protect margins.
Construction input inflation
Material cost moves for steel, concrete, electrical gear and equipment rentals materially drive McCarthy project pricing, with contingencies typically sized at 5–10% to protect margins. Supply-chain normalization remains uneven by category, creating bid risk and schedule exposure. Accurate cost indexing and strategic supplier alliances improve estimate fidelity, while procurement timing and contingency drawdowns are critical margin levers.
Labor market tightness
Skilled trades scarcity—reported by the ABC 2024 survey as affecting roughly 81% of contractors—pushes wages and subcontractor premiums higher (construction wages up about 5.2% YoY in 2024 per BLS), driving overtime and margins pressure; productivity losses can delay schedules and raise liquidated-damage risk, while investments in self-perform, training and predictive staffing align crews to peak workloads and stabilize delivery.
Public vs private demand mix
Public countercyclical spending in healthcare, education and civil infrastructure—supported by the $1.2 trillion IIJA—can offset private commercial slowdowns, stabilizing McCarthy’s project intake. Corporate capex cycles drive variability: labs and data centers rise with tech spending while offices lag. A balanced end-market portfolio smooths revenue and keeps backlog resilient.
Owner solvency and payment risk
Macro slowdowns heighten collection risk and change-order disputes, as seen industry-wide when project delays push payment cycles; McCarthy reported roughly $5.5B revenue in 2023, underscoring scale exposure. Strong credit vetting and rigorous lien-rights enforcement have protected cash flow and reduced bad-debt write-offs. Negotiating milestone payments shifts risk off WIP and stabilizes liquidity. A diversified client base mitigates concentration risk across sectors.
- Collection risk: higher during slowdowns
- Credit vetting: protects cash flow
- Milestone payments: reduce WIP exposure
- Diversification: lowers client concentration risk
Pursue $1.2T IIJA and $369B IRA windows; plan for permitting delays
Higher rates (Fed funds 5.25–5.50%, 10y Treasury ~4.4% July 2025) raise WACC, slow private builds and boost public essential projects; financing, bonding and escalation clauses increasingly shape bids. Material cost swings (contingencies 5–10%) and uneven supply chains drive bid risk. Skilled-trade scarcity (ABC 2024: ~81%) and construction wages +5.2% YoY (BLS 2024) pressure margins; IIJA $1.2T supports public backlog.
| Metric | Value (latest) |
|---|---|
| Fed funds | 5.25–5.50% |
| 10y Treasury | ~4.4% |
| McCarthy revenue (2023) | $5.5B |
| IIJA | $1.2T |
| Skilled trades shortage | ~81% (ABC 2024) |
| Construction wages YoY | +5.2% (BLS 2024) |
| Contingency sizing | 5–10% |
What You See Is What You Get
McCarthy Holdings PESTLE Analysis
The McCarthy Holdings PESTLE Analysis shown here is the exact document you’ll receive after purchase—fully formatted and ready to use. It provides a concise review of political, economic, social, technological, legal and environmental factors affecting McCarthy. No placeholders or teasers—this is the real, finished file available for immediate download.











