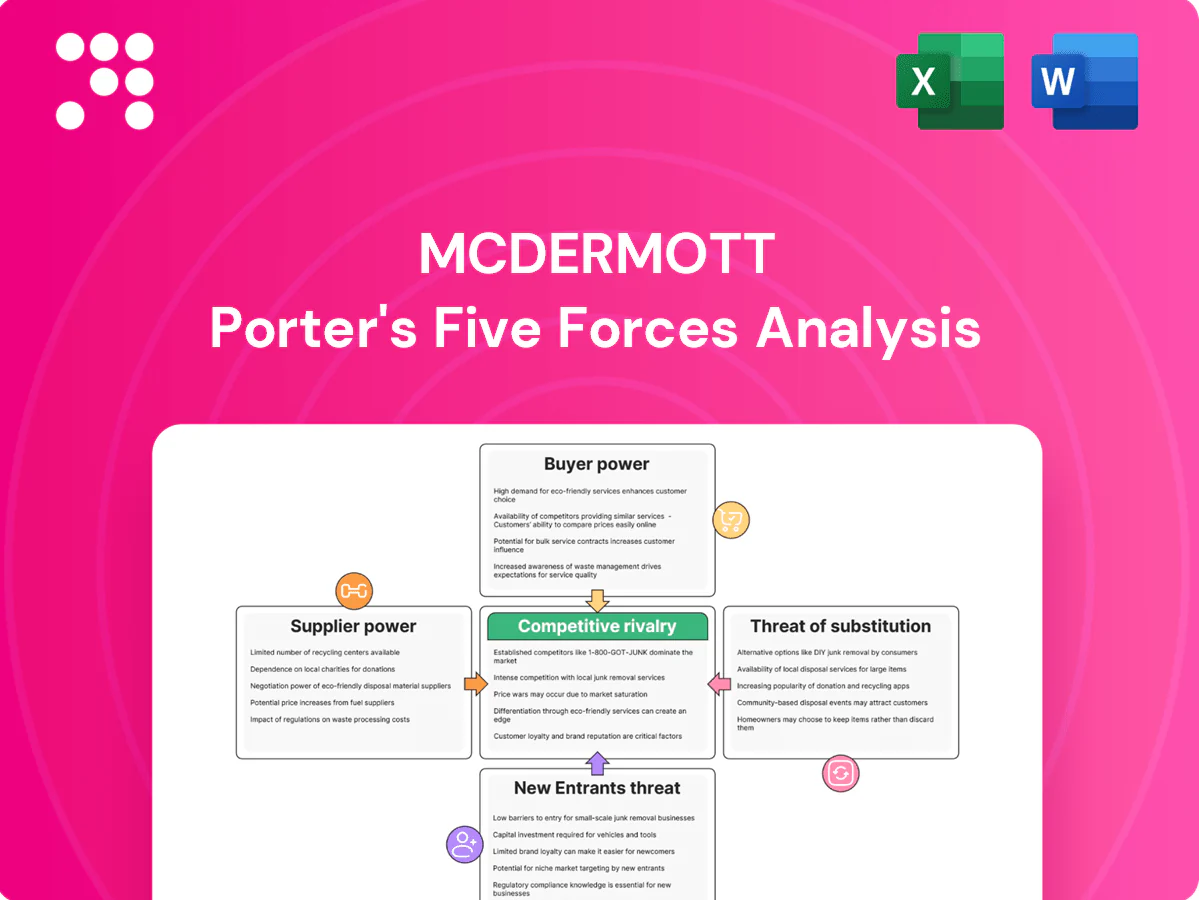
McDermott Porter's Five Forces Analysis

Go Beyond the Preview—Access the Full Strategic Report
McDermott faces intense supplier bargaining, moderate buyer power, and high rivalry as global project scale and contract complexity raise entry barriers and substitute risks. This snapshot highlights key tensions and strategic levers to watch. The full Porter's Five Forces Analysis reveals force-by-force ratings, visuals, and actionable implications to inform investment or strategy decisions.
Suppliers Bargaining Power

Specialized equipment OEM concentration
Subsea trees, SURF kits and compressors are concentrated among a few OEMs, creating high switching costs and lead times often in the 12–24 month range that raise schedule and cost risk. Limited qualified vendors can set technical standards and charge expediting premiums, while bundled tech packages lock interface control and margin. McDermott mitigates this through dual-qualifying parts and early supplier engagement to shorten procurement cycles.
Heavy steel, pipe, and alloy volatility
Structural steel, line pipe, and exotic alloys experienced tight allocation and price volatility through 2024, with long-lead vendor windows commonly stretching 40–52 weeks and spot shortages reported across major yards. Mill qualification and project-specific specs limit substitute sourcing, raising supplier leverage on megaproject margins. Indexation clauses and hedging trimmed cost exposure but failed to eliminate delivery or allocation risk. Schedule-critical long-lead items magnify dependence and rework risk.

Marine assets and yard capacity
Specialty vessels, heavy-lift cranes and qualified fabrication yards are scarce at cycle peaks; 2024 saw heavy-lift and MPSV day-rates spike above $100,000/day at peaks and yard slot lead times extend to 6–12 months, strengthening supplier bargaining power.
Owning or chartering fleets and captive yards reduces exposure but dry-dock and class windows remain binding constraints; alliances and multi-project frameworks were used in 2024 to secure priority access and mitigate slot risk.

Skilled labor and niche subcontractors
Skilled welding, subsea installation and commissioning talent remain cyclical and highly mobile, concentrating bargaining power among regional niche subcontractors under local content rules; wage inflation and overtime premiums increasingly erode lump-sum EPCI margins while workforce development and modularization mitigate some pressure.
- Skilled mobility: high
- Local-content: concentrates suppliers
- Wage inflation: margin pressure
- Mitigants: workforce development, modularization
Logistics and geopolitics
Sanctions, export controls and customs bottlenecks in 2024 have strengthened freight forwarders’ leverage, increasing paperwork and selectivity of carriers for sensitive routes. Oversize loads, hazardous materials and remote offshore yards further shrink carrier pools, raising premiums and insurance lifts. Route disruptions translate into expediting costs and schedule exposure, so early logistics engineering and multi-route planning cut dependency and mitigate cost spikes.
- Sanctions/export controls: concentrated routing and higher handling fees
- Special cargo: limited carrier options and insurance surcharges
- Mitigation: early logistics engineering, alternate routes, buffer scheduling
Subsea squeeze: 12–24m LT; heavy lift >$100k/day
Subsea OEM concentration (3–5 global suppliers) with 12–24 month lead times in 2024 creates high switching costs and schedule/cost risk.
Structural steel and exotic-alloy allocations with 40–52 week vendor windows and heavy-lift dayrates spiking >$100,000/day in 2024 raised supplier leverage on megaproject margins.
Skilled labor scarcity, wage inflation and sanctions-driven logistics bottlenecks further strengthen suppliers; mitigants include dual-qualification, hedging, captive fleets and early supplier engagement.
| Item | 2024 metric | Impact |
|---|---|---|
| Subsea OEMs | 3–5 suppliers; 12–24m LT | High switching cost |
| Steel/alloys | 40–52 wk lead | Allocation/price risk |
| Heavy-lift | >$100,000/day peak | Schedule premium |
| Labor/logistics | Wage inflation; sanctions | Margin erosion |
What is included in the product
 Detailed Word Document
Tailored Porter's Five Forces analysis for McDermott that uncovers key competitive drivers, supplier and buyer power, substitutes and new-entry risks, and strategic levers to protect margins and market share.

 Customizable Excel Spreadsheet
A single-sheet McDermott Porter’s Five Forces summary that visualizes competitive pressures, lets you tweak inputs for scenario planning, and exports clean slides—so teams quickly identify and act on strategic pain points.
Customers Bargaining Power

Concentrated IOC/NOC clientele
Concentrated IOC/NOC clientele wield outsized leverage, with majors driving standardized terms and strict vendor lists that tilt negotiations. They run competitive tenders that commonly yield price concessions and risk transfers, with industry sources noting bid reductions of up to 15% in 2023–24. Strong relationships and track record help but rarely neutralize client bargaining power in downcycles. Early pre-FEED involvement lets contractors influence specs and can materially improve win odds.
Contracting models shift risk
Lump-sum turnkey (LSTK) contracts transfer cost and schedule risk to contractors, forcing tighter margins and stronger risk controls in 2024. Clients increasingly deploy pain/gain sharing and liquidated damages to discipline performance, reducing contractor upside. Cost-reimbursable awards became rarer amid heated bidding, decreasing margin visibility. Robust estimating and ample contingencies are critical to withstand intensified buyer pressure in 2024.

High switching costs but strict performance
Project complexity and steep interface learning curves create mid‑execution switching frictions for McDermott, but pre‑award clients in 2024 still move freely among qualified EPCIs; past‑performance scoring remains decisive for awards and repeat work, and documented poor delivery leads to rapid disqualification despite high in‑flight switching costs.

Local content and in-country value
Buyers mandate local fabrication, workforce and sourcing—2024 project tenders in MEA frequently stipulate 40–60% in-country value—narrowing contractor choice, raising compliance costs and shifting leverage to client-approved local partners.
- Compliance adds measurable cost and time pressure
- Waivers required for deviations, strengthening buyer negotiation
- Building local capabilities reduces buyer power over years
Digital transparency and benchmarking
- Benchmarking adoption: ~65% of large owners (2024)
- Margin compression on reimbursables: ~1–3 pp (2024)
- Digital twins reduce change orders via clearer scope
- Execution differentiation and productivity data protect pricing
IOC/NOC leverage drives up to 15% bid cuts; owners benchmark (≈65%) and force 40–60% local content
Concentrated IOC/NOC clients exert strong leverage, driving competitive tenders that produced bid reductions up to 15% in 2023–24; pre‑FEED engagement improves contractor influence. Owners increasingly benchmark bids (≈65% of large owners in 2024) and mandate 40–60% local content in MEA tenders, raising compliance costs. Open‑book/digital twin use compressed reimbursable margins by ~1–3 pp in 2024.
| Metric | 2024 Value |
|---|---|
| Max bid reduction (2023–24) | up to 15% |
| Benchmarking adoption (large owners) | ≈65% |
| Local content requirements (MEA tenders) | 40–60% |
| Reimbursable margin compression | ~1–3 pp |
Same Document Delivered
McDermott Porter's Five Forces Analysis
This preview shows the exact McDermott Porter’s Five Forces Analysis you’ll receive immediately after purchase—no surprises or placeholders. The document displayed is fully formatted and ready for download and use the moment you buy. You’re previewing the final deliverable; once payment is complete you’ll get instant access to this identical file.

Go Beyond the Preview—Access the Full Strategic Report
McDermott faces intense supplier bargaining, moderate buyer power, and high rivalry as global project scale and contract complexity raise entry barriers and substitute risks. This snapshot highlights key tensions and strategic levers to watch. The full Porter's Five Forces Analysis reveals force-by-force ratings, visuals, and actionable implications to inform investment or strategy decisions.
Suppliers Bargaining Power
Specialized equipment OEM concentration
Subsea trees, SURF kits and compressors are concentrated among a few OEMs, creating high switching costs and lead times often in the 12–24 month range that raise schedule and cost risk. Limited qualified vendors can set technical standards and charge expediting premiums, while bundled tech packages lock interface control and margin. McDermott mitigates this through dual-qualifying parts and early supplier engagement to shorten procurement cycles.
Heavy steel, pipe, and alloy volatility
Structural steel, line pipe, and exotic alloys experienced tight allocation and price volatility through 2024, with long-lead vendor windows commonly stretching 40–52 weeks and spot shortages reported across major yards. Mill qualification and project-specific specs limit substitute sourcing, raising supplier leverage on megaproject margins. Indexation clauses and hedging trimmed cost exposure but failed to eliminate delivery or allocation risk. Schedule-critical long-lead items magnify dependence and rework risk.
Marine assets and yard capacity
Specialty vessels, heavy-lift cranes and qualified fabrication yards are scarce at cycle peaks; 2024 saw heavy-lift and MPSV day-rates spike above $100,000/day at peaks and yard slot lead times extend to 6–12 months, strengthening supplier bargaining power.
Owning or chartering fleets and captive yards reduces exposure but dry-dock and class windows remain binding constraints; alliances and multi-project frameworks were used in 2024 to secure priority access and mitigate slot risk.
Skilled labor and niche subcontractors
Skilled welding, subsea installation and commissioning talent remain cyclical and highly mobile, concentrating bargaining power among regional niche subcontractors under local content rules; wage inflation and overtime premiums increasingly erode lump-sum EPCI margins while workforce development and modularization mitigate some pressure.
- Skilled mobility: high
- Local-content: concentrates suppliers
- Wage inflation: margin pressure
- Mitigants: workforce development, modularization
Logistics and geopolitics
Sanctions, export controls and customs bottlenecks in 2024 have strengthened freight forwarders’ leverage, increasing paperwork and selectivity of carriers for sensitive routes. Oversize loads, hazardous materials and remote offshore yards further shrink carrier pools, raising premiums and insurance lifts. Route disruptions translate into expediting costs and schedule exposure, so early logistics engineering and multi-route planning cut dependency and mitigate cost spikes.
- Sanctions/export controls: concentrated routing and higher handling fees
- Special cargo: limited carrier options and insurance surcharges
- Mitigation: early logistics engineering, alternate routes, buffer scheduling
Subsea squeeze: 12–24m LT; heavy lift >$100k/day
Subsea OEM concentration (3–5 global suppliers) with 12–24 month lead times in 2024 creates high switching costs and schedule/cost risk.
Structural steel and exotic-alloy allocations with 40–52 week vendor windows and heavy-lift dayrates spiking >$100,000/day in 2024 raised supplier leverage on megaproject margins.
Skilled labor scarcity, wage inflation and sanctions-driven logistics bottlenecks further strengthen suppliers; mitigants include dual-qualification, hedging, captive fleets and early supplier engagement.
| Item | 2024 metric | Impact |
|---|---|---|
| Subsea OEMs | 3–5 suppliers; 12–24m LT | High switching cost |
| Steel/alloys | 40–52 wk lead | Allocation/price risk |
| Heavy-lift | >$100,000/day peak | Schedule premium |
| Labor/logistics | Wage inflation; sanctions | Margin erosion |
What is included in the product
Detailed Word Document
Tailored Porter's Five Forces analysis for McDermott that uncovers key competitive drivers, supplier and buyer power, substitutes and new-entry risks, and strategic levers to protect margins and market share.
Customizable Excel Spreadsheet
A single-sheet McDermott Porter’s Five Forces summary that visualizes competitive pressures, lets you tweak inputs for scenario planning, and exports clean slides—so teams quickly identify and act on strategic pain points.
Customers Bargaining Power
Concentrated IOC/NOC clientele
Concentrated IOC/NOC clientele wield outsized leverage, with majors driving standardized terms and strict vendor lists that tilt negotiations. They run competitive tenders that commonly yield price concessions and risk transfers, with industry sources noting bid reductions of up to 15% in 2023–24. Strong relationships and track record help but rarely neutralize client bargaining power in downcycles. Early pre-FEED involvement lets contractors influence specs and can materially improve win odds.
Contracting models shift risk
Lump-sum turnkey (LSTK) contracts transfer cost and schedule risk to contractors, forcing tighter margins and stronger risk controls in 2024. Clients increasingly deploy pain/gain sharing and liquidated damages to discipline performance, reducing contractor upside. Cost-reimbursable awards became rarer amid heated bidding, decreasing margin visibility. Robust estimating and ample contingencies are critical to withstand intensified buyer pressure in 2024.
High switching costs but strict performance
Project complexity and steep interface learning curves create mid‑execution switching frictions for McDermott, but pre‑award clients in 2024 still move freely among qualified EPCIs; past‑performance scoring remains decisive for awards and repeat work, and documented poor delivery leads to rapid disqualification despite high in‑flight switching costs.
Local content and in-country value
Buyers mandate local fabrication, workforce and sourcing—2024 project tenders in MEA frequently stipulate 40–60% in-country value—narrowing contractor choice, raising compliance costs and shifting leverage to client-approved local partners.
- Compliance adds measurable cost and time pressure
- Waivers required for deviations, strengthening buyer negotiation
- Building local capabilities reduces buyer power over years
Digital transparency and benchmarking
- Benchmarking adoption: ~65% of large owners (2024)
- Margin compression on reimbursables: ~1–3 pp (2024)
- Digital twins reduce change orders via clearer scope
- Execution differentiation and productivity data protect pricing
IOC/NOC leverage drives up to 15% bid cuts; owners benchmark (≈65%) and force 40–60% local content
Concentrated IOC/NOC clients exert strong leverage, driving competitive tenders that produced bid reductions up to 15% in 2023–24; pre‑FEED engagement improves contractor influence. Owners increasingly benchmark bids (≈65% of large owners in 2024) and mandate 40–60% local content in MEA tenders, raising compliance costs. Open‑book/digital twin use compressed reimbursable margins by ~1–3 pp in 2024.
| Metric | 2024 Value |
|---|---|
| Max bid reduction (2023–24) | up to 15% |
| Benchmarking adoption (large owners) | ≈65% |
| Local content requirements (MEA tenders) | 40–60% |
| Reimbursable margin compression | ~1–3 pp |
Same Document Delivered
McDermott Porter's Five Forces Analysis
This preview shows the exact McDermott Porter’s Five Forces Analysis you’ll receive immediately after purchase—no surprises or placeholders. The document displayed is fully formatted and ready for download and use the moment you buy. You’re previewing the final deliverable; once payment is complete you’ll get instant access to this identical file.
Original: $10.00
-65%$10.00
$3.50Description
Go Beyond the Preview—Access the Full Strategic Report
McDermott faces intense supplier bargaining, moderate buyer power, and high rivalry as global project scale and contract complexity raise entry barriers and substitute risks. This snapshot highlights key tensions and strategic levers to watch. The full Porter's Five Forces Analysis reveals force-by-force ratings, visuals, and actionable implications to inform investment or strategy decisions.
Suppliers Bargaining Power
Specialized equipment OEM concentration
Subsea trees, SURF kits and compressors are concentrated among a few OEMs, creating high switching costs and lead times often in the 12–24 month range that raise schedule and cost risk. Limited qualified vendors can set technical standards and charge expediting premiums, while bundled tech packages lock interface control and margin. McDermott mitigates this through dual-qualifying parts and early supplier engagement to shorten procurement cycles.
Heavy steel, pipe, and alloy volatility
Structural steel, line pipe, and exotic alloys experienced tight allocation and price volatility through 2024, with long-lead vendor windows commonly stretching 40–52 weeks and spot shortages reported across major yards. Mill qualification and project-specific specs limit substitute sourcing, raising supplier leverage on megaproject margins. Indexation clauses and hedging trimmed cost exposure but failed to eliminate delivery or allocation risk. Schedule-critical long-lead items magnify dependence and rework risk.
Marine assets and yard capacity
Specialty vessels, heavy-lift cranes and qualified fabrication yards are scarce at cycle peaks; 2024 saw heavy-lift and MPSV day-rates spike above $100,000/day at peaks and yard slot lead times extend to 6–12 months, strengthening supplier bargaining power.
Owning or chartering fleets and captive yards reduces exposure but dry-dock and class windows remain binding constraints; alliances and multi-project frameworks were used in 2024 to secure priority access and mitigate slot risk.
Skilled labor and niche subcontractors
Skilled welding, subsea installation and commissioning talent remain cyclical and highly mobile, concentrating bargaining power among regional niche subcontractors under local content rules; wage inflation and overtime premiums increasingly erode lump-sum EPCI margins while workforce development and modularization mitigate some pressure.
- Skilled mobility: high
- Local-content: concentrates suppliers
- Wage inflation: margin pressure
- Mitigants: workforce development, modularization
Logistics and geopolitics
Sanctions, export controls and customs bottlenecks in 2024 have strengthened freight forwarders’ leverage, increasing paperwork and selectivity of carriers for sensitive routes. Oversize loads, hazardous materials and remote offshore yards further shrink carrier pools, raising premiums and insurance lifts. Route disruptions translate into expediting costs and schedule exposure, so early logistics engineering and multi-route planning cut dependency and mitigate cost spikes.
- Sanctions/export controls: concentrated routing and higher handling fees
- Special cargo: limited carrier options and insurance surcharges
- Mitigation: early logistics engineering, alternate routes, buffer scheduling
Subsea squeeze: 12–24m LT; heavy lift >$100k/day
Subsea OEM concentration (3–5 global suppliers) with 12–24 month lead times in 2024 creates high switching costs and schedule/cost risk.
Structural steel and exotic-alloy allocations with 40–52 week vendor windows and heavy-lift dayrates spiking >$100,000/day in 2024 raised supplier leverage on megaproject margins.
Skilled labor scarcity, wage inflation and sanctions-driven logistics bottlenecks further strengthen suppliers; mitigants include dual-qualification, hedging, captive fleets and early supplier engagement.
| Item | 2024 metric | Impact |
|---|---|---|
| Subsea OEMs | 3–5 suppliers; 12–24m LT | High switching cost |
| Steel/alloys | 40–52 wk lead | Allocation/price risk |
| Heavy-lift | >$100,000/day peak | Schedule premium |
| Labor/logistics | Wage inflation; sanctions | Margin erosion |
What is included in the product
Detailed Word Document
Tailored Porter's Five Forces analysis for McDermott that uncovers key competitive drivers, supplier and buyer power, substitutes and new-entry risks, and strategic levers to protect margins and market share.
Customizable Excel Spreadsheet
A single-sheet McDermott Porter’s Five Forces summary that visualizes competitive pressures, lets you tweak inputs for scenario planning, and exports clean slides—so teams quickly identify and act on strategic pain points.
Customers Bargaining Power
Concentrated IOC/NOC clientele
Concentrated IOC/NOC clientele wield outsized leverage, with majors driving standardized terms and strict vendor lists that tilt negotiations. They run competitive tenders that commonly yield price concessions and risk transfers, with industry sources noting bid reductions of up to 15% in 2023–24. Strong relationships and track record help but rarely neutralize client bargaining power in downcycles. Early pre-FEED involvement lets contractors influence specs and can materially improve win odds.
Contracting models shift risk
Lump-sum turnkey (LSTK) contracts transfer cost and schedule risk to contractors, forcing tighter margins and stronger risk controls in 2024. Clients increasingly deploy pain/gain sharing and liquidated damages to discipline performance, reducing contractor upside. Cost-reimbursable awards became rarer amid heated bidding, decreasing margin visibility. Robust estimating and ample contingencies are critical to withstand intensified buyer pressure in 2024.
High switching costs but strict performance
Project complexity and steep interface learning curves create mid‑execution switching frictions for McDermott, but pre‑award clients in 2024 still move freely among qualified EPCIs; past‑performance scoring remains decisive for awards and repeat work, and documented poor delivery leads to rapid disqualification despite high in‑flight switching costs.
Local content and in-country value
Buyers mandate local fabrication, workforce and sourcing—2024 project tenders in MEA frequently stipulate 40–60% in-country value—narrowing contractor choice, raising compliance costs and shifting leverage to client-approved local partners.
- Compliance adds measurable cost and time pressure
- Waivers required for deviations, strengthening buyer negotiation
- Building local capabilities reduces buyer power over years
Digital transparency and benchmarking
- Benchmarking adoption: ~65% of large owners (2024)
- Margin compression on reimbursables: ~1–3 pp (2024)
- Digital twins reduce change orders via clearer scope
- Execution differentiation and productivity data protect pricing
IOC/NOC leverage drives up to 15% bid cuts; owners benchmark (≈65%) and force 40–60% local content
Concentrated IOC/NOC clients exert strong leverage, driving competitive tenders that produced bid reductions up to 15% in 2023–24; pre‑FEED engagement improves contractor influence. Owners increasingly benchmark bids (≈65% of large owners in 2024) and mandate 40–60% local content in MEA tenders, raising compliance costs. Open‑book/digital twin use compressed reimbursable margins by ~1–3 pp in 2024.
| Metric | 2024 Value |
|---|---|
| Max bid reduction (2023–24) | up to 15% |
| Benchmarking adoption (large owners) | ≈65% |
| Local content requirements (MEA tenders) | 40–60% |
| Reimbursable margin compression | ~1–3 pp |
Same Document Delivered
McDermott Porter's Five Forces Analysis
This preview shows the exact McDermott Porter’s Five Forces Analysis you’ll receive immediately after purchase—no surprises or placeholders. The document displayed is fully formatted and ready for download and use the moment you buy. You’re previewing the final deliverable; once payment is complete you’ll get instant access to this identical file.











