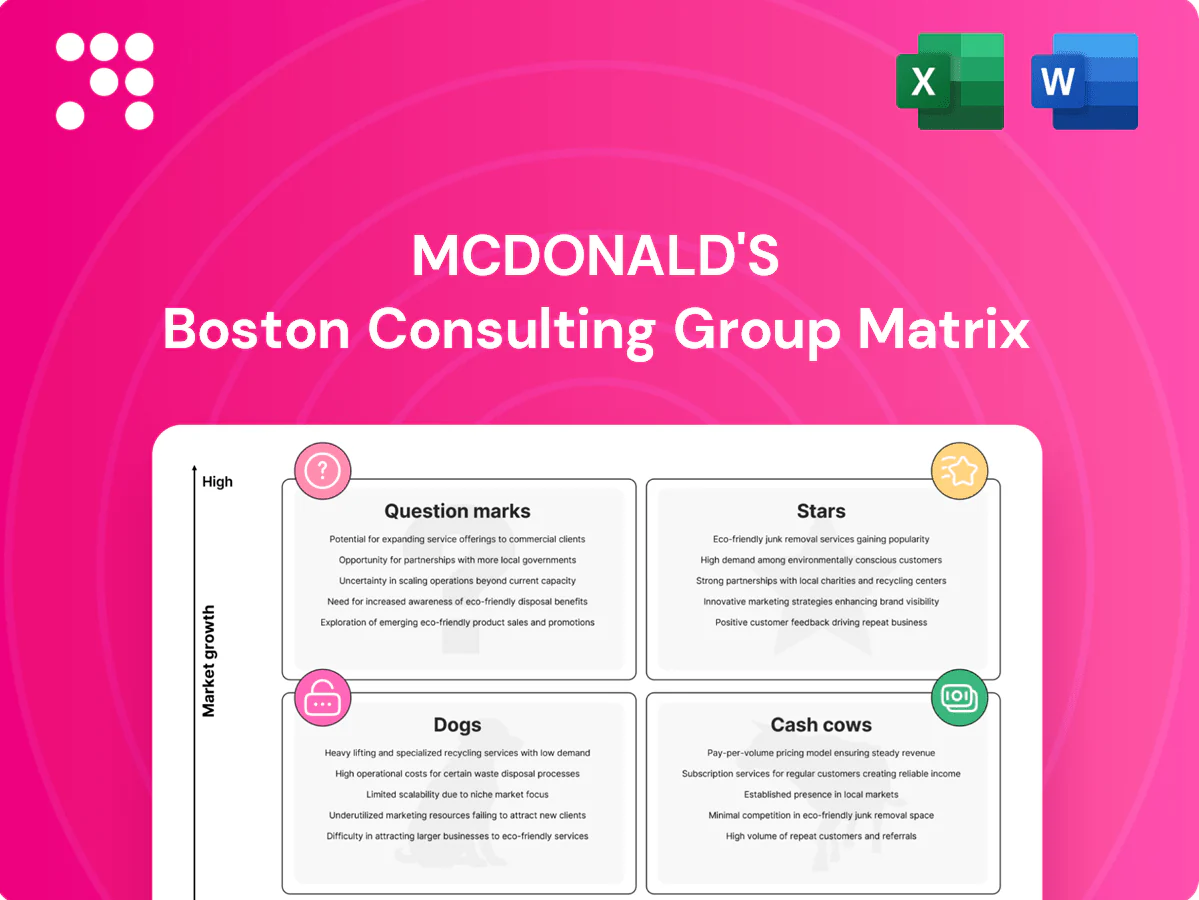
McDonald's Boston Consulting Group Matrix

Unlock Strategic Clarity
McDonald’s BCG Matrix snapshot shows where its icons—Big Mac, McNuggets, delivery—sit between Stars, Cash Cows, Question Marks, and Dogs, revealing where growth and cash generation collide. Want the full quadrant map, data-backed moves, and clear priorities? Purchase the complete BCG Matrix for a ready-to-use Word report and Excel summary that tells you exactly where to invest next.
Stars

Mobile App + Loyalty (MyMcDonald’s)
Mobile App + Loyalty (MyMcDonald’s) sits in Stars: digital ordering and data-driven offers are high-growth channels with dominant app adoption driving a large share of orders; McDonald’s operates 40,000+ restaurants worldwide (2024) and prioritizes app-led growth in core markets. It leads in many markets but needs sustained promos and personalization to keep visit frequency high. Cash in roughly matches cash out as rewards, delivery fees and CRM are funded. Hold share here; as category stabilizes it will mature into a cash cow.
Delivery with Aggregators
Delivery with Aggregators sits in Stars: explosive demand as delivery grew double-digit in 2023–24, powered by McDonald’s 40,000+ restaurants, scale, speed and brand recall. However it needs heavy promos, operational tweaks and partner economics—aggregator fees typically 15–30%—to keep margins healthy. As leadership plus growth, money in equals money out today; nail cost-to-serve and it graduates to cow.

Global Chicken Platform (e.g., McCrispy)
Chicken is a fast-growing QSR battleground and McDonald’s, with over 40,000 restaurants and ~69 million customers served daily, has real heft to scale a Global Chicken Platform like McCrispy. They’re often top-of-mind but must keep investing in product innovation and consistent quality to protect share. Marketing and kitchen capacity upgrades absorb cash during high-growth phases. Sustain wins and it can become a durable profit engine.

Experience of the Future formats (kiosk, dual-lane, digital pick-up)
Consumer shift to convenience is still accelerating; McDonald’s, the largest QSR by revenue (US$24.6B in 2023), leads the kiosk/dual‑lane/digital pick‑up format race but must invest significant capex and training to fully capture throughput. Rollouts consume cash short‑term while driving long‑term margin lift; keeping the edge compounds into a durable cash cow.
- Format leader
- Capex & training required
- Short‑term cash consumption
- Long‑term margin lift
International Expansion in High-Growth Markets
Markets in Asia, MEA and LATAM are high-growth Stars for McDonald’s; as of 2024 the company operates ~40,000 restaurants globally with systemwide sales above $100B. Success demands capital for supply-chain buildout, real estate and deep localization; rapid openings can absorb cash despite strong unit economics, but scaling through the curve turns these regions into major cash generators.
- High-growth geographies: Asia, MEA, LATAM
- 2024 scale: ~40,000 restaurants
- Needs: supply chain, real estate, localization
- Risk: high cash burn during expansion
- Outcome: large future cash flow once scaled
App and delivery scale in MEA/Asia/LATAM: chicken-led growth to cash-cow margins
Stars: Mobile app, delivery, chicken and high‑growth Asia/MEA/LATAM drive fast growth; McDonald’s >40,000 restaurants (2024) and ~69M daily customers provide scale. These channels grew double‑digit (delivery 2023–24) but need heavy promos, capex and supply‑chain spend. Sustain share and cut cost‑to‑serve and they transition to cash cows.
| Metric | 2024 |
|---|---|
| Restaurants | ~40,000+ |
| Daily customers | ~69M |
| US revenue | US$24.6B (2023) |
| Systemwide sales | >US$100B |
| Aggregator fees | 15–30% |
What is included in the product
 Detailed Word Document
BCG analysis of McDonald's menu and units, mapping Stars, Cash Cows, Question Marks and Dogs with clear invest/hold/divest guidance.

 Customizable Excel Spreadsheet
One-page McDonald's BCG Matrix placing each business unit in a quadrant, easing strategic decisions for busy execs.
Cash Cows

Core Burgers & World-Famous Fries
Core Burgers & World-Famous Fries sit in a mature category with dominant share, anchoring menu velocity across McDonald’s over 40,000 restaurants worldwide (2024).
Their iconic crave and predictable demand require low promotional lift, keeping unit-level throughput stable.
High margins stem from standardized, efficient kitchens and the franchise model, and cash flows from these items bankroll menu innovation and global expansion.
Fountain Beverages (Coca‑Cola partnership)
Fountain beverages, powered by a Coca‑Cola partnership spanning over 60 years, generate stable, low‑growth cash flow with minimal operational complexity and a high attach rate across McDonald’s restaurants.
These drinks deliver outsized margins versus made‑to‑order items, quietly funding R&D and corporate overhead while supporting McDonald’s systemwide sales of roughly $135 billion (2023 systemwide sales context).

Breakfast Staples in Mature Markets
Breakfast staples in mature markets deliver routine morning visits and are estimated to account for roughly 20% of U.S. sales, giving McDonald’s a leading share of the daypart. Operations are lean—limited SKUs and rapid service—so marketing is maintenance rather than heavy lift. Margin-friendly items and high combo attach rates boost check size. The segment contributes steady, predictable cash flow to the P&L and supports dividend capacity.

Drive‑Thru in Developed Markets
Drive‑Thru in developed markets sits on a massive installed base—McDonald's operates roughly 40,000 restaurants worldwide with over 13,500 in the US, most offering drive‑thru; process mastery and consistent throughput yield high unit economics. Growth has leveled, but profitability and predictable cash flow remain excellent; low incremental investment (lanes, POS, digital) sustains returns.
Franchise Royalties & Rent
Franchise royalties and rent are McDonald's core cash cows: asset-light, high-visibility fees on roughly 93% of about 40,000 restaurants worldwide in 2024, producing steady recurring income. The market is mature and share entrenched, collection has low incremental cost and high margins (royalty rates typically ~4% of sales), and this cash funds digital, delivery and menu innovation and other riskier bets.
- Asset-light, recurring
- ~93% franchised (2024), ~40,000 units
- Low incremental cost, high margin (~4% royalty)
- Funds higher-risk growth and innovation
Core food, drinks & breakfast + 93% franchising = steady cash flow
Core burgers, fries, fountain drinks, breakfast and franchising are McDonald’s cash cows: high-share, low-growth items and ~93% franchised model generate steady, high-margin cash flow (system ~40,000 restaurants, 2024; systemwide sales ~$135B, 2023), funding innovation, dividends and modest capex.
| Item | Role | Metric (2023/24) |
|---|---|---|
| Core Food | High margin, stable demand | ~40,000 units (2024) |
| Fountain Drinks | High attach, low cost | Long Coca‑Cola pact |
| Franchise Fees | Recurring cash | ~93% franchised; ~4% royalty |
What You See Is What You Get
McDonald's BCG Matrix
The McDonald's BCG Matrix you’re previewing here is the exact file you’ll receive after purchase—no watermarks, no demo content, just the finished report. It’s crafted for strategic clarity with market-backed insights on products and business units. After buying, the full document is instantly downloadable, editable, and presentation-ready. No surprises—just a polished, ready-to-use analysis for your team.

Unlock Strategic Clarity
McDonald’s BCG Matrix snapshot shows where its icons—Big Mac, McNuggets, delivery—sit between Stars, Cash Cows, Question Marks, and Dogs, revealing where growth and cash generation collide. Want the full quadrant map, data-backed moves, and clear priorities? Purchase the complete BCG Matrix for a ready-to-use Word report and Excel summary that tells you exactly where to invest next.
Stars
Mobile App + Loyalty (MyMcDonald’s)
Mobile App + Loyalty (MyMcDonald’s) sits in Stars: digital ordering and data-driven offers are high-growth channels with dominant app adoption driving a large share of orders; McDonald’s operates 40,000+ restaurants worldwide (2024) and prioritizes app-led growth in core markets. It leads in many markets but needs sustained promos and personalization to keep visit frequency high. Cash in roughly matches cash out as rewards, delivery fees and CRM are funded. Hold share here; as category stabilizes it will mature into a cash cow.
Delivery with Aggregators
Delivery with Aggregators sits in Stars: explosive demand as delivery grew double-digit in 2023–24, powered by McDonald’s 40,000+ restaurants, scale, speed and brand recall. However it needs heavy promos, operational tweaks and partner economics—aggregator fees typically 15–30%—to keep margins healthy. As leadership plus growth, money in equals money out today; nail cost-to-serve and it graduates to cow.
Global Chicken Platform (e.g., McCrispy)
Chicken is a fast-growing QSR battleground and McDonald’s, with over 40,000 restaurants and ~69 million customers served daily, has real heft to scale a Global Chicken Platform like McCrispy. They’re often top-of-mind but must keep investing in product innovation and consistent quality to protect share. Marketing and kitchen capacity upgrades absorb cash during high-growth phases. Sustain wins and it can become a durable profit engine.
Experience of the Future formats (kiosk, dual-lane, digital pick-up)
Consumer shift to convenience is still accelerating; McDonald’s, the largest QSR by revenue (US$24.6B in 2023), leads the kiosk/dual‑lane/digital pick‑up format race but must invest significant capex and training to fully capture throughput. Rollouts consume cash short‑term while driving long‑term margin lift; keeping the edge compounds into a durable cash cow.
- Format leader
- Capex & training required
- Short‑term cash consumption
- Long‑term margin lift
International Expansion in High-Growth Markets
Markets in Asia, MEA and LATAM are high-growth Stars for McDonald’s; as of 2024 the company operates ~40,000 restaurants globally with systemwide sales above $100B. Success demands capital for supply-chain buildout, real estate and deep localization; rapid openings can absorb cash despite strong unit economics, but scaling through the curve turns these regions into major cash generators.
- High-growth geographies: Asia, MEA, LATAM
- 2024 scale: ~40,000 restaurants
- Needs: supply chain, real estate, localization
- Risk: high cash burn during expansion
- Outcome: large future cash flow once scaled
App and delivery scale in MEA/Asia/LATAM: chicken-led growth to cash-cow margins
Stars: Mobile app, delivery, chicken and high‑growth Asia/MEA/LATAM drive fast growth; McDonald’s >40,000 restaurants (2024) and ~69M daily customers provide scale. These channels grew double‑digit (delivery 2023–24) but need heavy promos, capex and supply‑chain spend. Sustain share and cut cost‑to‑serve and they transition to cash cows.
| Metric | 2024 |
|---|---|
| Restaurants | ~40,000+ |
| Daily customers | ~69M |
| US revenue | US$24.6B (2023) |
| Systemwide sales | >US$100B |
| Aggregator fees | 15–30% |
What is included in the product
Detailed Word Document
BCG analysis of McDonald's menu and units, mapping Stars, Cash Cows, Question Marks and Dogs with clear invest/hold/divest guidance.
Customizable Excel Spreadsheet
One-page McDonald's BCG Matrix placing each business unit in a quadrant, easing strategic decisions for busy execs.
Cash Cows
Core Burgers & World-Famous Fries
Core Burgers & World-Famous Fries sit in a mature category with dominant share, anchoring menu velocity across McDonald’s over 40,000 restaurants worldwide (2024).
Their iconic crave and predictable demand require low promotional lift, keeping unit-level throughput stable.
High margins stem from standardized, efficient kitchens and the franchise model, and cash flows from these items bankroll menu innovation and global expansion.
Fountain Beverages (Coca‑Cola partnership)
Fountain beverages, powered by a Coca‑Cola partnership spanning over 60 years, generate stable, low‑growth cash flow with minimal operational complexity and a high attach rate across McDonald’s restaurants.
These drinks deliver outsized margins versus made‑to‑order items, quietly funding R&D and corporate overhead while supporting McDonald’s systemwide sales of roughly $135 billion (2023 systemwide sales context).
Breakfast Staples in Mature Markets
Breakfast staples in mature markets deliver routine morning visits and are estimated to account for roughly 20% of U.S. sales, giving McDonald’s a leading share of the daypart. Operations are lean—limited SKUs and rapid service—so marketing is maintenance rather than heavy lift. Margin-friendly items and high combo attach rates boost check size. The segment contributes steady, predictable cash flow to the P&L and supports dividend capacity.
Drive‑Thru in Developed Markets
Drive‑Thru in developed markets sits on a massive installed base—McDonald's operates roughly 40,000 restaurants worldwide with over 13,500 in the US, most offering drive‑thru; process mastery and consistent throughput yield high unit economics. Growth has leveled, but profitability and predictable cash flow remain excellent; low incremental investment (lanes, POS, digital) sustains returns.
Franchise Royalties & Rent
Franchise royalties and rent are McDonald's core cash cows: asset-light, high-visibility fees on roughly 93% of about 40,000 restaurants worldwide in 2024, producing steady recurring income. The market is mature and share entrenched, collection has low incremental cost and high margins (royalty rates typically ~4% of sales), and this cash funds digital, delivery and menu innovation and other riskier bets.
- Asset-light, recurring
- ~93% franchised (2024), ~40,000 units
- Low incremental cost, high margin (~4% royalty)
- Funds higher-risk growth and innovation
Core food, drinks & breakfast + 93% franchising = steady cash flow
Core burgers, fries, fountain drinks, breakfast and franchising are McDonald’s cash cows: high-share, low-growth items and ~93% franchised model generate steady, high-margin cash flow (system ~40,000 restaurants, 2024; systemwide sales ~$135B, 2023), funding innovation, dividends and modest capex.
| Item | Role | Metric (2023/24) |
|---|---|---|
| Core Food | High margin, stable demand | ~40,000 units (2024) |
| Fountain Drinks | High attach, low cost | Long Coca‑Cola pact |
| Franchise Fees | Recurring cash | ~93% franchised; ~4% royalty |
What You See Is What You Get
McDonald's BCG Matrix
The McDonald's BCG Matrix you’re previewing here is the exact file you’ll receive after purchase—no watermarks, no demo content, just the finished report. It’s crafted for strategic clarity with market-backed insights on products and business units. After buying, the full document is instantly downloadable, editable, and presentation-ready. No surprises—just a polished, ready-to-use analysis for your team.
Original: $10.00
-65%$10.00
$3.50Description
Unlock Strategic Clarity
McDonald’s BCG Matrix snapshot shows where its icons—Big Mac, McNuggets, delivery—sit between Stars, Cash Cows, Question Marks, and Dogs, revealing where growth and cash generation collide. Want the full quadrant map, data-backed moves, and clear priorities? Purchase the complete BCG Matrix for a ready-to-use Word report and Excel summary that tells you exactly where to invest next.
Stars
Mobile App + Loyalty (MyMcDonald’s)
Mobile App + Loyalty (MyMcDonald’s) sits in Stars: digital ordering and data-driven offers are high-growth channels with dominant app adoption driving a large share of orders; McDonald’s operates 40,000+ restaurants worldwide (2024) and prioritizes app-led growth in core markets. It leads in many markets but needs sustained promos and personalization to keep visit frequency high. Cash in roughly matches cash out as rewards, delivery fees and CRM are funded. Hold share here; as category stabilizes it will mature into a cash cow.
Delivery with Aggregators
Delivery with Aggregators sits in Stars: explosive demand as delivery grew double-digit in 2023–24, powered by McDonald’s 40,000+ restaurants, scale, speed and brand recall. However it needs heavy promos, operational tweaks and partner economics—aggregator fees typically 15–30%—to keep margins healthy. As leadership plus growth, money in equals money out today; nail cost-to-serve and it graduates to cow.
Global Chicken Platform (e.g., McCrispy)
Chicken is a fast-growing QSR battleground and McDonald’s, with over 40,000 restaurants and ~69 million customers served daily, has real heft to scale a Global Chicken Platform like McCrispy. They’re often top-of-mind but must keep investing in product innovation and consistent quality to protect share. Marketing and kitchen capacity upgrades absorb cash during high-growth phases. Sustain wins and it can become a durable profit engine.
Experience of the Future formats (kiosk, dual-lane, digital pick-up)
Consumer shift to convenience is still accelerating; McDonald’s, the largest QSR by revenue (US$24.6B in 2023), leads the kiosk/dual‑lane/digital pick‑up format race but must invest significant capex and training to fully capture throughput. Rollouts consume cash short‑term while driving long‑term margin lift; keeping the edge compounds into a durable cash cow.
- Format leader
- Capex & training required
- Short‑term cash consumption
- Long‑term margin lift
International Expansion in High-Growth Markets
Markets in Asia, MEA and LATAM are high-growth Stars for McDonald’s; as of 2024 the company operates ~40,000 restaurants globally with systemwide sales above $100B. Success demands capital for supply-chain buildout, real estate and deep localization; rapid openings can absorb cash despite strong unit economics, but scaling through the curve turns these regions into major cash generators.
- High-growth geographies: Asia, MEA, LATAM
- 2024 scale: ~40,000 restaurants
- Needs: supply chain, real estate, localization
- Risk: high cash burn during expansion
- Outcome: large future cash flow once scaled
App and delivery scale in MEA/Asia/LATAM: chicken-led growth to cash-cow margins
Stars: Mobile app, delivery, chicken and high‑growth Asia/MEA/LATAM drive fast growth; McDonald’s >40,000 restaurants (2024) and ~69M daily customers provide scale. These channels grew double‑digit (delivery 2023–24) but need heavy promos, capex and supply‑chain spend. Sustain share and cut cost‑to‑serve and they transition to cash cows.
| Metric | 2024 |
|---|---|
| Restaurants | ~40,000+ |
| Daily customers | ~69M |
| US revenue | US$24.6B (2023) |
| Systemwide sales | >US$100B |
| Aggregator fees | 15–30% |
What is included in the product
Detailed Word Document
BCG analysis of McDonald's menu and units, mapping Stars, Cash Cows, Question Marks and Dogs with clear invest/hold/divest guidance.
Customizable Excel Spreadsheet
One-page McDonald's BCG Matrix placing each business unit in a quadrant, easing strategic decisions for busy execs.
Cash Cows
Core Burgers & World-Famous Fries
Core Burgers & World-Famous Fries sit in a mature category with dominant share, anchoring menu velocity across McDonald’s over 40,000 restaurants worldwide (2024).
Their iconic crave and predictable demand require low promotional lift, keeping unit-level throughput stable.
High margins stem from standardized, efficient kitchens and the franchise model, and cash flows from these items bankroll menu innovation and global expansion.
Fountain Beverages (Coca‑Cola partnership)
Fountain beverages, powered by a Coca‑Cola partnership spanning over 60 years, generate stable, low‑growth cash flow with minimal operational complexity and a high attach rate across McDonald’s restaurants.
These drinks deliver outsized margins versus made‑to‑order items, quietly funding R&D and corporate overhead while supporting McDonald’s systemwide sales of roughly $135 billion (2023 systemwide sales context).
Breakfast Staples in Mature Markets
Breakfast staples in mature markets deliver routine morning visits and are estimated to account for roughly 20% of U.S. sales, giving McDonald’s a leading share of the daypart. Operations are lean—limited SKUs and rapid service—so marketing is maintenance rather than heavy lift. Margin-friendly items and high combo attach rates boost check size. The segment contributes steady, predictable cash flow to the P&L and supports dividend capacity.
Drive‑Thru in Developed Markets
Drive‑Thru in developed markets sits on a massive installed base—McDonald's operates roughly 40,000 restaurants worldwide with over 13,500 in the US, most offering drive‑thru; process mastery and consistent throughput yield high unit economics. Growth has leveled, but profitability and predictable cash flow remain excellent; low incremental investment (lanes, POS, digital) sustains returns.
Franchise Royalties & Rent
Franchise royalties and rent are McDonald's core cash cows: asset-light, high-visibility fees on roughly 93% of about 40,000 restaurants worldwide in 2024, producing steady recurring income. The market is mature and share entrenched, collection has low incremental cost and high margins (royalty rates typically ~4% of sales), and this cash funds digital, delivery and menu innovation and other riskier bets.
- Asset-light, recurring
- ~93% franchised (2024), ~40,000 units
- Low incremental cost, high margin (~4% royalty)
- Funds higher-risk growth and innovation
Core food, drinks & breakfast + 93% franchising = steady cash flow
Core burgers, fries, fountain drinks, breakfast and franchising are McDonald’s cash cows: high-share, low-growth items and ~93% franchised model generate steady, high-margin cash flow (system ~40,000 restaurants, 2024; systemwide sales ~$135B, 2023), funding innovation, dividends and modest capex.
| Item | Role | Metric (2023/24) |
|---|---|---|
| Core Food | High margin, stable demand | ~40,000 units (2024) |
| Fountain Drinks | High attach, low cost | Long Coca‑Cola pact |
| Franchise Fees | Recurring cash | ~93% franchised; ~4% royalty |
What You See Is What You Get
McDonald's BCG Matrix
The McDonald's BCG Matrix you’re previewing here is the exact file you’ll receive after purchase—no watermarks, no demo content, just the finished report. It’s crafted for strategic clarity with market-backed insights on products and business units. After buying, the full document is instantly downloadable, editable, and presentation-ready. No surprises—just a polished, ready-to-use analysis for your team.











