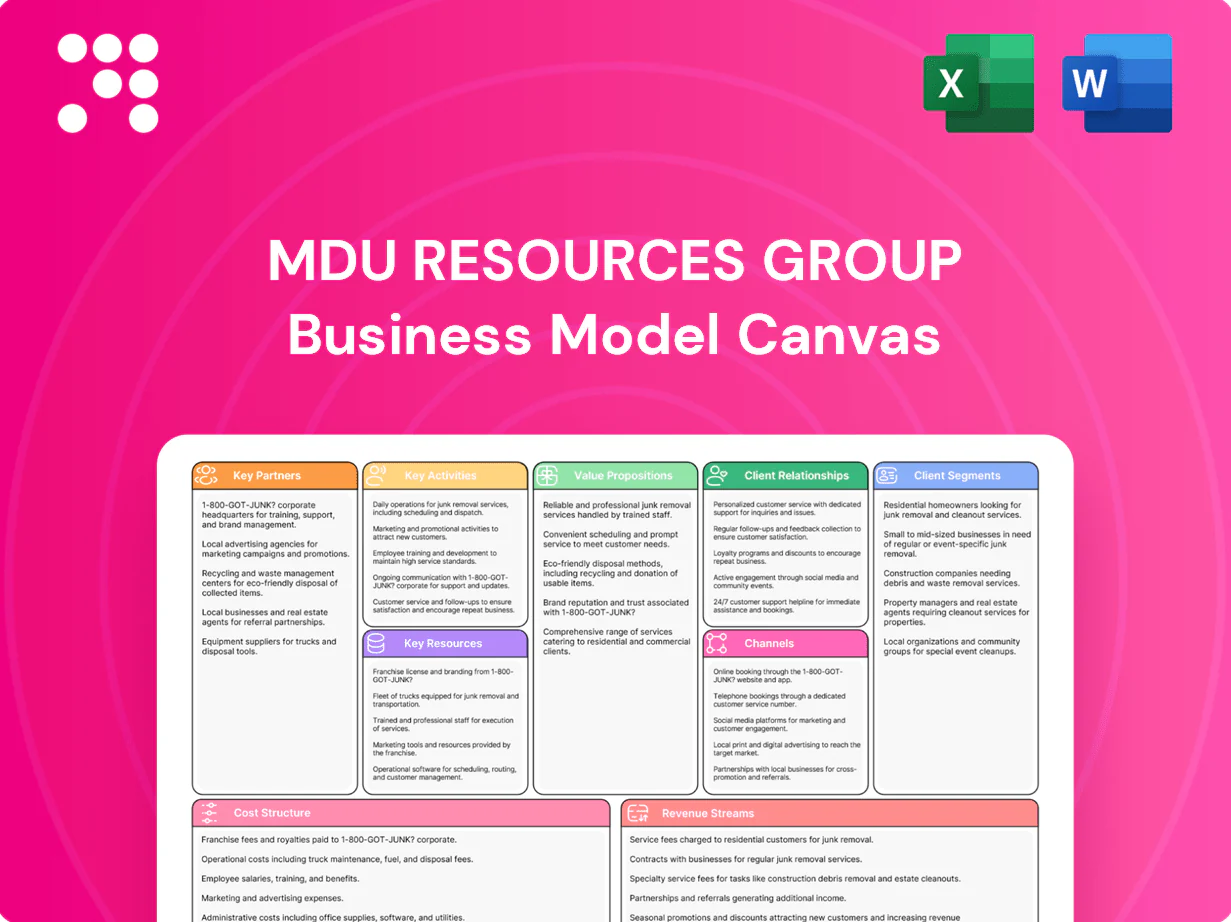
MDU Resources Group Business Model Canvas

Strategic Business Model Canvas for a Regulated Utilities and Infrastructure Leader
Unlock the strategic blueprint behind MDU Resources Group with our concise Business Model Canvas that highlights value creation, key partners, revenue streams, and competitive advantages. This in-depth canvas distills critical insights for investors, consultants, and strategists to act on. Purchase the full editable Word & Excel canvas to benchmark, plan, and turn these insights into measurable results.
Partnerships

Regulators and policymakers
Partnerships with state utility commissions and FERC keep MDU Resources' rate cases, approvals and compliance moving efficiently, supporting filings that underpin allowed returns; in 2024 median U.S. state-authorized ROE was about 9.5%. Collaboration shapes resource plans, pipeline permits and safety standards, aligning capital projects with regulatory expectations. Ongoing dialogue mitigates regulatory risk and supports recovery of prudent investments, enabling predictable returns in the regulated rate base.
Suppliers and fuel providers
Coal, natural gas, and renewables suppliers underpin reliable utility operations, reflecting a US 2024 power mix of roughly 39% natural gas, 24% renewables and 20% coal (EIA Jan–Sep 2024). Aggregate, asphalt binder, cement and admixture vendors secure steady inputs for MDU’s construction segments, supporting year‑over‑year backlog stability. Long‑term contracts stabilize costs and quality, while dual sourcing cuts disruption risk.

Contractors, EPCs, and subcontractors
Engineering, procurement, and construction partners enable MDU Resources to scale large utility and infrastructure projects by supplying turnkey capabilities and capital-intensive resources; subcontractor networks add specialized skills and local labor to meet regulatory and terrain demands. Partnering improves bid competitiveness and schedule adherence while smoothing peak workforce demand and supporting a geographically dispersed project portfolio.

Logistics, rail, and trucking partners
Railroads and trucking partners move aggregates, asphalt, and fuel across the Plains, lowering delivered cost per ton and boosting plant uptime through predictable lead times. Reliable logistics and coordinated dispatch enable just-in-time delivery to jobsites, reducing laydown delays and improving service levels during peak paving seasons. Close coordination with haulers enhances responsiveness and minimizes idle equipment.
- Reduced delivered cost per ton via rail haul and bulk fuel logistics
- Improved plant uptime through scheduled rail windows and coordinated trucking
- Just-in-time dispatching raises on-site availability during peak paving
Municipalities and right-of-way owners
City, county and tribal entities secure permits, easements and franchise agreements that enable MDU Resources to mobilize projects and expand gas and electric grids; in 2024 these partnerships underpinned project scheduling and risk reduction. Cooperative relationships shorten permitting timelines, long-term franchises define predictable service territories, and community ties strengthen social license to operate.
- Permits/Easements
- Franchises: predictable territories
- Cooperation: faster mobilization
- Community: social license
Regulatory wins secure 9.5% ROE; supply mix leans to gas and renewables
MDU Resources leverages regulator partnerships to secure rate approvals and recovery of capital (median U.S. state-authorized ROE ~9.5% in 2024). Fuel and material suppliers sustain operations aligned with a 2024 U.S. power mix: natural gas 39%, renewables 24%, coal 20%. EPC, logistics and local governments shorten timelines, stabilize costs and enable network expansion.
| Partner | Role | 2024 metric |
|---|---|---|
| Regulators | Rate approvals | Median ROE ~9.5% |
| Suppliers | Fuel/materials | Gas 39% / Renewables 24% / Coal 20% |
What is included in the product
 Detailed Word Document
A comprehensive Business Model Canvas for MDU Resources Group detailing customer segments, channels, value propositions and revenue streams across its utilities, midstream, construction materials and contracting businesses; organized into the 9 BMC blocks with key resources, activities, partners and cost structure. It includes SWOT-linked competitive advantages and implementation insights for investor presentations and strategic decision-making.

 Customizable Excel Spreadsheet
Condenses MDU Resources Group’s complex mix of utility, construction, and energy services into an editable one‑page canvas, saving hours of work and enabling teams to quickly identify value drivers, cost structure, and growth levers for faster strategic decisions.
Activities

Regulated electric and gas service
Regulated generation, transmission and distribution of electricity and gas distribution are core, serving roughly 440,000 utility customers and representing the largest segment of MDU Resources’ business; activities include operations, preventive maintenance and rapid outage response. Resource planning aligns capacity with demand and policy, supported by a multi‑year capital plan (~$600M annually) to maintain reliability. Customer service, metering and billing close the operational loop and drive regulated revenues and collections.
Aggregates, asphalt, and ready-mix production
Quarrying, crushing, and screening provide the feedstock for MDU Resources’ aggregates business, supporting asphalt and ready-mix supply chains in 2024. Asphalt and concrete plants schedule and produce mixes to specification and project timelines while in-plant quality control labs ensure DOT and contract compliance. Inventory and plant optimization focus on maximizing throughput and reducing downtime to support project delivery.

Construction and contracting services
Heavy civil, utility construction and paving projects are bid, built and delivered across regional markets, with MDU Resources reporting consolidated 2024 revenues of about $5.3 billion and construction segment revenues near $1.1 billion. Daily disciplines—estimating, project management and safety—drive on-time delivery and OSHA-recordable rates below industry averages. Equipment mobilization and fleet maintenance sustain utilization; active change order and claims management protect typical construction margins around mid-single digits.

Pipeline and midstream operations
Pipeline and midstream operations deliver gathering, transmission, and storage throughput services while maintaining PHMSA compliance and active integrity management; U.S. pipeline infrastructure totaled about 2.6 million miles in 2024, underscoring scale and regulatory focus.
Capacity marketing and shipper scheduling drive utilization and revenue optimization, with preventive maintenance programs reducing leaks and downtime to protect throughput and margins.
- Throughput services
- PHMSA compliance & integrity management
- Capacity marketing & scheduling
- Preventive maintenance to minimize leaks/downtime
Capital planning and compliance
Long-range capex planning at MDU aligns investments with rate-recovery schedules and growth initiatives, ensuring projects support regulated utility cash flows while targeting operational expansion. Environmental, safety, and reliability programs meet evolving regulatory standards and reduce outage risk. Proactive stakeholder engagement minimizes permitting and construction delays, and standardized data reporting enhances transparency and performance tracking.
- Capex aligned with rate cases and growth
- Compliance: environmental, safety, reliability
- Stakeholder engagement reduces friction
- Data reporting for transparency and KPIs
Utility serves ~440k customers; 2024 rev $5.3B
Regulated utility ops serve ~440,000 customers; multi‑year capex ~ $600M/yr supports reliability, metering and billing.
Aggregates, asphalt, concrete and heavy construction underpin project delivery; 2024 consolidated revenue ~ $5.3B, construction ~ $1.1B.
Pipeline/midstream integrity, PHMSA compliance and capacity marketing sustain throughput across ~2.6M miles US pipeline network.
| Metric | 2024 Value |
|---|---|
| Utility customers | ~440,000 |
| Consolidated revenue | $5.3B |
| Construction revenue | $1.1B |
| Annual capex | ~$600M |
| US pipeline miles | ~2.6M |
Preview Before You Purchase
Business Model Canvas
The MDU Resources Group Business Model Canvas you see here is the actual deliverable, not a mockup or sample; it’s a direct snapshot of the final file you’ll receive. After purchase you’ll get this identical, fully editable document ready for presentation and analysis. No placeholders, no surprises—what’s previewed is what you’ll download.

Strategic Business Model Canvas for a Regulated Utilities and Infrastructure Leader
Unlock the strategic blueprint behind MDU Resources Group with our concise Business Model Canvas that highlights value creation, key partners, revenue streams, and competitive advantages. This in-depth canvas distills critical insights for investors, consultants, and strategists to act on. Purchase the full editable Word & Excel canvas to benchmark, plan, and turn these insights into measurable results.
Partnerships
Regulators and policymakers
Partnerships with state utility commissions and FERC keep MDU Resources' rate cases, approvals and compliance moving efficiently, supporting filings that underpin allowed returns; in 2024 median U.S. state-authorized ROE was about 9.5%. Collaboration shapes resource plans, pipeline permits and safety standards, aligning capital projects with regulatory expectations. Ongoing dialogue mitigates regulatory risk and supports recovery of prudent investments, enabling predictable returns in the regulated rate base.
Suppliers and fuel providers
Coal, natural gas, and renewables suppliers underpin reliable utility operations, reflecting a US 2024 power mix of roughly 39% natural gas, 24% renewables and 20% coal (EIA Jan–Sep 2024). Aggregate, asphalt binder, cement and admixture vendors secure steady inputs for MDU’s construction segments, supporting year‑over‑year backlog stability. Long‑term contracts stabilize costs and quality, while dual sourcing cuts disruption risk.
Contractors, EPCs, and subcontractors
Engineering, procurement, and construction partners enable MDU Resources to scale large utility and infrastructure projects by supplying turnkey capabilities and capital-intensive resources; subcontractor networks add specialized skills and local labor to meet regulatory and terrain demands. Partnering improves bid competitiveness and schedule adherence while smoothing peak workforce demand and supporting a geographically dispersed project portfolio.
Logistics, rail, and trucking partners
Railroads and trucking partners move aggregates, asphalt, and fuel across the Plains, lowering delivered cost per ton and boosting plant uptime through predictable lead times. Reliable logistics and coordinated dispatch enable just-in-time delivery to jobsites, reducing laydown delays and improving service levels during peak paving seasons. Close coordination with haulers enhances responsiveness and minimizes idle equipment.
- Reduced delivered cost per ton via rail haul and bulk fuel logistics
- Improved plant uptime through scheduled rail windows and coordinated trucking
- Just-in-time dispatching raises on-site availability during peak paving
Municipalities and right-of-way owners
City, county and tribal entities secure permits, easements and franchise agreements that enable MDU Resources to mobilize projects and expand gas and electric grids; in 2024 these partnerships underpinned project scheduling and risk reduction. Cooperative relationships shorten permitting timelines, long-term franchises define predictable service territories, and community ties strengthen social license to operate.
- Permits/Easements
- Franchises: predictable territories
- Cooperation: faster mobilization
- Community: social license
Regulatory wins secure 9.5% ROE; supply mix leans to gas and renewables
MDU Resources leverages regulator partnerships to secure rate approvals and recovery of capital (median U.S. state-authorized ROE ~9.5% in 2024). Fuel and material suppliers sustain operations aligned with a 2024 U.S. power mix: natural gas 39%, renewables 24%, coal 20%. EPC, logistics and local governments shorten timelines, stabilize costs and enable network expansion.
| Partner | Role | 2024 metric |
|---|---|---|
| Regulators | Rate approvals | Median ROE ~9.5% |
| Suppliers | Fuel/materials | Gas 39% / Renewables 24% / Coal 20% |
What is included in the product
Detailed Word Document
A comprehensive Business Model Canvas for MDU Resources Group detailing customer segments, channels, value propositions and revenue streams across its utilities, midstream, construction materials and contracting businesses; organized into the 9 BMC blocks with key resources, activities, partners and cost structure. It includes SWOT-linked competitive advantages and implementation insights for investor presentations and strategic decision-making.
Customizable Excel Spreadsheet
Condenses MDU Resources Group’s complex mix of utility, construction, and energy services into an editable one‑page canvas, saving hours of work and enabling teams to quickly identify value drivers, cost structure, and growth levers for faster strategic decisions.
Activities
Regulated electric and gas service
Regulated generation, transmission and distribution of electricity and gas distribution are core, serving roughly 440,000 utility customers and representing the largest segment of MDU Resources’ business; activities include operations, preventive maintenance and rapid outage response. Resource planning aligns capacity with demand and policy, supported by a multi‑year capital plan (~$600M annually) to maintain reliability. Customer service, metering and billing close the operational loop and drive regulated revenues and collections.
Aggregates, asphalt, and ready-mix production
Quarrying, crushing, and screening provide the feedstock for MDU Resources’ aggregates business, supporting asphalt and ready-mix supply chains in 2024. Asphalt and concrete plants schedule and produce mixes to specification and project timelines while in-plant quality control labs ensure DOT and contract compliance. Inventory and plant optimization focus on maximizing throughput and reducing downtime to support project delivery.
Construction and contracting services
Heavy civil, utility construction and paving projects are bid, built and delivered across regional markets, with MDU Resources reporting consolidated 2024 revenues of about $5.3 billion and construction segment revenues near $1.1 billion. Daily disciplines—estimating, project management and safety—drive on-time delivery and OSHA-recordable rates below industry averages. Equipment mobilization and fleet maintenance sustain utilization; active change order and claims management protect typical construction margins around mid-single digits.
Pipeline and midstream operations
Pipeline and midstream operations deliver gathering, transmission, and storage throughput services while maintaining PHMSA compliance and active integrity management; U.S. pipeline infrastructure totaled about 2.6 million miles in 2024, underscoring scale and regulatory focus.
Capacity marketing and shipper scheduling drive utilization and revenue optimization, with preventive maintenance programs reducing leaks and downtime to protect throughput and margins.
- Throughput services
- PHMSA compliance & integrity management
- Capacity marketing & scheduling
- Preventive maintenance to minimize leaks/downtime
Capital planning and compliance
Long-range capex planning at MDU aligns investments with rate-recovery schedules and growth initiatives, ensuring projects support regulated utility cash flows while targeting operational expansion. Environmental, safety, and reliability programs meet evolving regulatory standards and reduce outage risk. Proactive stakeholder engagement minimizes permitting and construction delays, and standardized data reporting enhances transparency and performance tracking.
- Capex aligned with rate cases and growth
- Compliance: environmental, safety, reliability
- Stakeholder engagement reduces friction
- Data reporting for transparency and KPIs
Utility serves ~440k customers; 2024 rev $5.3B
Regulated utility ops serve ~440,000 customers; multi‑year capex ~ $600M/yr supports reliability, metering and billing.
Aggregates, asphalt, concrete and heavy construction underpin project delivery; 2024 consolidated revenue ~ $5.3B, construction ~ $1.1B.
Pipeline/midstream integrity, PHMSA compliance and capacity marketing sustain throughput across ~2.6M miles US pipeline network.
| Metric | 2024 Value |
|---|---|
| Utility customers | ~440,000 |
| Consolidated revenue | $5.3B |
| Construction revenue | $1.1B |
| Annual capex | ~$600M |
| US pipeline miles | ~2.6M |
Preview Before You Purchase
Business Model Canvas
The MDU Resources Group Business Model Canvas you see here is the actual deliverable, not a mockup or sample; it’s a direct snapshot of the final file you’ll receive. After purchase you’ll get this identical, fully editable document ready for presentation and analysis. No placeholders, no surprises—what’s previewed is what you’ll download.
Original: $10.00
-65%$10.00
$3.50Description
Strategic Business Model Canvas for a Regulated Utilities and Infrastructure Leader
Unlock the strategic blueprint behind MDU Resources Group with our concise Business Model Canvas that highlights value creation, key partners, revenue streams, and competitive advantages. This in-depth canvas distills critical insights for investors, consultants, and strategists to act on. Purchase the full editable Word & Excel canvas to benchmark, plan, and turn these insights into measurable results.
Partnerships
Regulators and policymakers
Partnerships with state utility commissions and FERC keep MDU Resources' rate cases, approvals and compliance moving efficiently, supporting filings that underpin allowed returns; in 2024 median U.S. state-authorized ROE was about 9.5%. Collaboration shapes resource plans, pipeline permits and safety standards, aligning capital projects with regulatory expectations. Ongoing dialogue mitigates regulatory risk and supports recovery of prudent investments, enabling predictable returns in the regulated rate base.
Suppliers and fuel providers
Coal, natural gas, and renewables suppliers underpin reliable utility operations, reflecting a US 2024 power mix of roughly 39% natural gas, 24% renewables and 20% coal (EIA Jan–Sep 2024). Aggregate, asphalt binder, cement and admixture vendors secure steady inputs for MDU’s construction segments, supporting year‑over‑year backlog stability. Long‑term contracts stabilize costs and quality, while dual sourcing cuts disruption risk.
Contractors, EPCs, and subcontractors
Engineering, procurement, and construction partners enable MDU Resources to scale large utility and infrastructure projects by supplying turnkey capabilities and capital-intensive resources; subcontractor networks add specialized skills and local labor to meet regulatory and terrain demands. Partnering improves bid competitiveness and schedule adherence while smoothing peak workforce demand and supporting a geographically dispersed project portfolio.
Logistics, rail, and trucking partners
Railroads and trucking partners move aggregates, asphalt, and fuel across the Plains, lowering delivered cost per ton and boosting plant uptime through predictable lead times. Reliable logistics and coordinated dispatch enable just-in-time delivery to jobsites, reducing laydown delays and improving service levels during peak paving seasons. Close coordination with haulers enhances responsiveness and minimizes idle equipment.
- Reduced delivered cost per ton via rail haul and bulk fuel logistics
- Improved plant uptime through scheduled rail windows and coordinated trucking
- Just-in-time dispatching raises on-site availability during peak paving
Municipalities and right-of-way owners
City, county and tribal entities secure permits, easements and franchise agreements that enable MDU Resources to mobilize projects and expand gas and electric grids; in 2024 these partnerships underpinned project scheduling and risk reduction. Cooperative relationships shorten permitting timelines, long-term franchises define predictable service territories, and community ties strengthen social license to operate.
- Permits/Easements
- Franchises: predictable territories
- Cooperation: faster mobilization
- Community: social license
Regulatory wins secure 9.5% ROE; supply mix leans to gas and renewables
MDU Resources leverages regulator partnerships to secure rate approvals and recovery of capital (median U.S. state-authorized ROE ~9.5% in 2024). Fuel and material suppliers sustain operations aligned with a 2024 U.S. power mix: natural gas 39%, renewables 24%, coal 20%. EPC, logistics and local governments shorten timelines, stabilize costs and enable network expansion.
| Partner | Role | 2024 metric |
|---|---|---|
| Regulators | Rate approvals | Median ROE ~9.5% |
| Suppliers | Fuel/materials | Gas 39% / Renewables 24% / Coal 20% |
What is included in the product
Detailed Word Document
A comprehensive Business Model Canvas for MDU Resources Group detailing customer segments, channels, value propositions and revenue streams across its utilities, midstream, construction materials and contracting businesses; organized into the 9 BMC blocks with key resources, activities, partners and cost structure. It includes SWOT-linked competitive advantages and implementation insights for investor presentations and strategic decision-making.
Customizable Excel Spreadsheet
Condenses MDU Resources Group’s complex mix of utility, construction, and energy services into an editable one‑page canvas, saving hours of work and enabling teams to quickly identify value drivers, cost structure, and growth levers for faster strategic decisions.
Activities
Regulated electric and gas service
Regulated generation, transmission and distribution of electricity and gas distribution are core, serving roughly 440,000 utility customers and representing the largest segment of MDU Resources’ business; activities include operations, preventive maintenance and rapid outage response. Resource planning aligns capacity with demand and policy, supported by a multi‑year capital plan (~$600M annually) to maintain reliability. Customer service, metering and billing close the operational loop and drive regulated revenues and collections.
Aggregates, asphalt, and ready-mix production
Quarrying, crushing, and screening provide the feedstock for MDU Resources’ aggregates business, supporting asphalt and ready-mix supply chains in 2024. Asphalt and concrete plants schedule and produce mixes to specification and project timelines while in-plant quality control labs ensure DOT and contract compliance. Inventory and plant optimization focus on maximizing throughput and reducing downtime to support project delivery.
Construction and contracting services
Heavy civil, utility construction and paving projects are bid, built and delivered across regional markets, with MDU Resources reporting consolidated 2024 revenues of about $5.3 billion and construction segment revenues near $1.1 billion. Daily disciplines—estimating, project management and safety—drive on-time delivery and OSHA-recordable rates below industry averages. Equipment mobilization and fleet maintenance sustain utilization; active change order and claims management protect typical construction margins around mid-single digits.
Pipeline and midstream operations
Pipeline and midstream operations deliver gathering, transmission, and storage throughput services while maintaining PHMSA compliance and active integrity management; U.S. pipeline infrastructure totaled about 2.6 million miles in 2024, underscoring scale and regulatory focus.
Capacity marketing and shipper scheduling drive utilization and revenue optimization, with preventive maintenance programs reducing leaks and downtime to protect throughput and margins.
- Throughput services
- PHMSA compliance & integrity management
- Capacity marketing & scheduling
- Preventive maintenance to minimize leaks/downtime
Capital planning and compliance
Long-range capex planning at MDU aligns investments with rate-recovery schedules and growth initiatives, ensuring projects support regulated utility cash flows while targeting operational expansion. Environmental, safety, and reliability programs meet evolving regulatory standards and reduce outage risk. Proactive stakeholder engagement minimizes permitting and construction delays, and standardized data reporting enhances transparency and performance tracking.
- Capex aligned with rate cases and growth
- Compliance: environmental, safety, reliability
- Stakeholder engagement reduces friction
- Data reporting for transparency and KPIs
Utility serves ~440k customers; 2024 rev $5.3B
Regulated utility ops serve ~440,000 customers; multi‑year capex ~ $600M/yr supports reliability, metering and billing.
Aggregates, asphalt, concrete and heavy construction underpin project delivery; 2024 consolidated revenue ~ $5.3B, construction ~ $1.1B.
Pipeline/midstream integrity, PHMSA compliance and capacity marketing sustain throughput across ~2.6M miles US pipeline network.
| Metric | 2024 Value |
|---|---|
| Utility customers | ~440,000 |
| Consolidated revenue | $5.3B |
| Construction revenue | $1.1B |
| Annual capex | ~$600M |
| US pipeline miles | ~2.6M |
Preview Before You Purchase
Business Model Canvas
The MDU Resources Group Business Model Canvas you see here is the actual deliverable, not a mockup or sample; it’s a direct snapshot of the final file you’ll receive. After purchase you’ll get this identical, fully editable document ready for presentation and analysis. No placeholders, no surprises—what’s previewed is what you’ll download.











