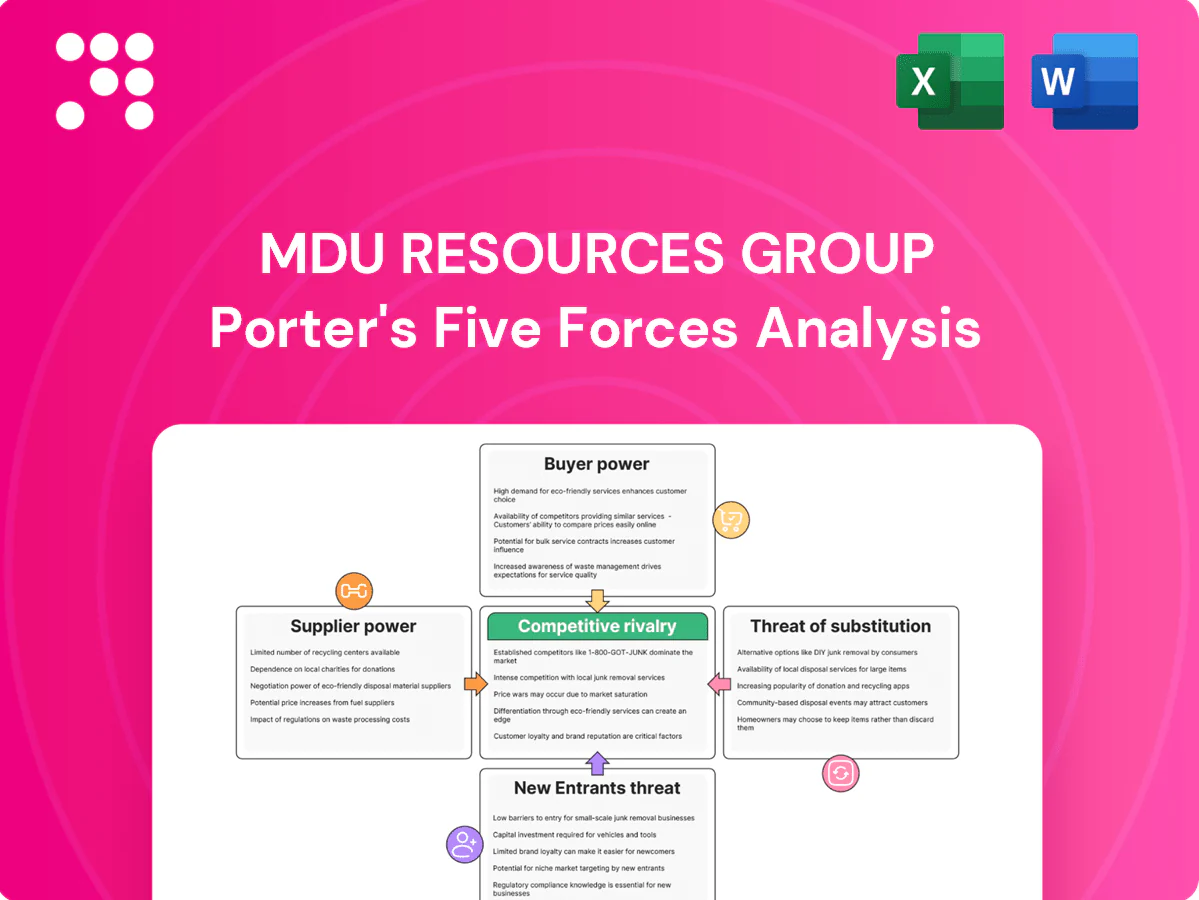
MDU Resources Group Porter's Five Forces Analysis

A Must-Have Tool for Decision-Makers
MDU Resources Group faces moderate supplier leverage, steady buyer demand, and industry rivalry driven by regulated utilities and construction services, with limited threat from new entrants but rising substitute and technological pressures. This snapshot highlights strategic pinch points and potential margin risks for investors and managers. Unlock the full Porter's Five Forces Analysis to explore force-by-force ratings, visuals, and actionable implications for MDU.
Suppliers Bargaining Power

Diversified fuel and inputs mute leverage
MDU sources natural gas, asphalt cement, cementitious materials, steel pipe and power equipment from multiple vendors, reducing single-supplier dependence; long-term indexed contracts and utility fuel-cost pass-throughs further limit margin squeeze. Episodic shortages, notably transformers and bitumen, can still spike costs and extend lead times. Vertical integration in aggregates lowers exposure to materials volatility.
Equipment OEMs hold timing power
Equipment OEMs for large transformers, turbines, compressors and yellow iron reported order backlogs in 2024 that pushed lead times to 9–18 months, giving suppliers timing power over project schedules and MDU Resources’ working capital needs. Price-escalation clauses in contracts mitigate cost risk but not schedule slippage. Strategic inventory builds and multi-sourcing reduced outage risk and deferred capex pressure.

Labor and specialty contractors are tight
Skilled craft labor and specialty subcontractors are scarce in peak seasons and remote Plains geographies, pushing wage and per-diem premiums that directly compress construction margins on MDU Resources projects. Utilities can generally recover prudent cost increases through regulated rate cases over time, but near-term construction margins are immediately exposed. Strong workforce development and union relationships (US union membership 10.1% in 2023, BLS) reduce volatility.

Right-of-way and land access constrain
Right-of-way and land access for pipelines, substations and quarries depend on landowners and regulators, giving local holders and permitting authorities meaningful leverage that can delay or reroute MDU Resources projects and elevate capital and schedule risk. Early engagement, easements and compensatory structures reduce friction but do not eliminate bargaining power, while MDU’s established regional footprints and prior easements create a cumulative advantage in negotiations.
- Dependence on landowners and regulators
- Holdout power -> delays and cost increases
- Mitigation: early engagement and compensation
- Established footprints = cumulative negotiating advantage
Energy and petrochemical volatility cascades
In 2024 asphalt cement and diesel tracked crude while cement/kiln fuels correlated with gas and coal; rapid input swings often outpaced construction contract adjustments. Hedging and fuel-indexed pricing softened shocks, but bid competitiveness limited full pass-through; utilities’ riders stabilized recovery over multi-year horizons.
- Asphalt/diesel: crude-linked volatility
- Cement fuels: gas/coal correlation
- Hedging/indexing vs limited pass-through
- Utility riders support long-term recovery
Supplier power moderate: OEM lead times 9–18 months; unionization 10.1%
Supplier power is moderate: multi-sourcing and fuel-cost pass-throughs limit margin pressure, but 2024 OEM backlogs pushed lead times to 9–18 months creating timing power. Scarce craft labor raises construction wage premiums; US union membership 10.1% (2023, BLS) cushions volatility. Landowners/regulators hold holdout leverage despite MDU’s regional easements.
| Factor | Impact | 2023–24 Data |
|---|---|---|
| OEM lead times | Schedule/working capital risk | 9–18 months (2024) |
| Unionization | Labor stability | 10.1% (US, 2023) |
What is included in the product
 Detailed Word Document
Comprehensive Porter's Five Forces analysis tailored to MDU Resources Group, assessing competitive rivalry, supplier and buyer power, threats of substitutes and new entrants, and strategic barriers protecting incumbency.

 Customizable Excel Spreadsheet
Clear one-sheet Porter's Five Forces for MDU Resources Group, distilling competitive pressures into actionable insights for quick decisions. Customize force levels, swap in your data, and export clean visuals for decks—no macros or finance expertise required.
Customers Bargaining Power

Regulated utility customers are captive
Residential and small commercial users in MDU Resources regulated monopoly territories remain largely captive, with limited switching options and utilities representing approximately 75% of regulated operations in 2024. Rate cases and decoupling mechanisms set allowed returns and constrain direct price negotiation, while service quality and affordability targets materially affect regulators' return determinations. Customer programs — efficiency incentives and demand-response — can alter load profiles but do not enable provider choice.
Large C&I and municipalities influence rates
High-load C&I accounts and municipalities can intervene in MDU Resources rate cases and secure special tariffs, pressing for preferential cost allocation and reliability projects tied to their concentrated demand; regulators, however, constrain concessions to preserve system-wide equity and ratepayer fairness. Economic development riders are used to jointly attract industry while sharing incremental costs and benefits.

Construction buyers are price-sensitive and bid-driven
Private developers and public DOTs largely award projects via competitive bids, amplifying buyer leverage and compressing margins. Transparent commodity indices such as the ENR Construction Cost Index and publicly quoted material prices encourage aggressive pricing. Schedule reliability and safety records give non-price differentiation but only partially offset price pressure. IIJA’s roughly 550 billion over five years helps sustain backlog and geographic diversification.

Shippers on pipelines negotiate terms
Shippers on pipelines push for lower tariffs and operational flexibility, while take-or-pay and long-term contracts for many midstream operators limit revenue volatility and restrict renegotiation of rates; basin alternatives and basis differentials continue to influence price negotiation and routing decisions, and shippers’ credit quality drives stricter collateral and payment terms.
- Favorable tariffs and flexibility sought by shippers
- Take-or-pay/long-term contracts reduce renegotiation
- Basin alternatives and basis differentials shape outcomes
- Shipper credit quality affects collateral and terms
Substitution threats strengthen buyer stance
Substitution threats from alternative paving materials, competing aggregates and self-perform options strengthened buyer leverage in 2024 as project owners sought cost savings; behind-the-meter generation and efficiency programs cut utility demand. MDU Resources reported roughly $6.1 billion revenue in 2024 and counters with bundled services, localized supply and reliability; customer loyalty hinges on total lifecycle value.
- 2024 revenue: $6.1B
- BTM solar/efficiency reducing load growth
- Competitive aggregates raise price sensitivity
- MDU focus: bundled services + local supply
Regulated utilities: captive retail base limits pricing while large C&I, shippers push rates
Residential and small commercial customers are largely captive in MDU Resources' regulated territories (utilities ≈75% of regulated ops in 2024), limiting bargaining power; rate cases and decoupling constrain pricing. Large C&I and municipalities exert stronger leverage via rate-case intervention and special tariffs. Shippers and project owners use competitive bidding, basis differentials and BTM solar to press prices; 2024 revenue: $6.1B.
| Metric | Value |
|---|---|
| 2024 revenue | $6.1B |
| Regulated share | ≈75% |
| IIJA (FY) | $550B program |
Same Document Delivered
MDU Resources Group Porter's Five Forces Analysis
This preview shows the exact Porter’s Five Forces analysis for MDU Resources Group you'll receive upon purchase. It evaluates competitive rivalry, supplier and buyer power, threat of new entrants, and substitutes with industry data and strategic implications. The file is fully formatted and ready to download. No placeholders or samples—this is the final deliverable.

A Must-Have Tool for Decision-Makers
MDU Resources Group faces moderate supplier leverage, steady buyer demand, and industry rivalry driven by regulated utilities and construction services, with limited threat from new entrants but rising substitute and technological pressures. This snapshot highlights strategic pinch points and potential margin risks for investors and managers. Unlock the full Porter's Five Forces Analysis to explore force-by-force ratings, visuals, and actionable implications for MDU.
Suppliers Bargaining Power
Diversified fuel and inputs mute leverage
MDU sources natural gas, asphalt cement, cementitious materials, steel pipe and power equipment from multiple vendors, reducing single-supplier dependence; long-term indexed contracts and utility fuel-cost pass-throughs further limit margin squeeze. Episodic shortages, notably transformers and bitumen, can still spike costs and extend lead times. Vertical integration in aggregates lowers exposure to materials volatility.
Equipment OEMs hold timing power
Equipment OEMs for large transformers, turbines, compressors and yellow iron reported order backlogs in 2024 that pushed lead times to 9–18 months, giving suppliers timing power over project schedules and MDU Resources’ working capital needs. Price-escalation clauses in contracts mitigate cost risk but not schedule slippage. Strategic inventory builds and multi-sourcing reduced outage risk and deferred capex pressure.
Labor and specialty contractors are tight
Skilled craft labor and specialty subcontractors are scarce in peak seasons and remote Plains geographies, pushing wage and per-diem premiums that directly compress construction margins on MDU Resources projects. Utilities can generally recover prudent cost increases through regulated rate cases over time, but near-term construction margins are immediately exposed. Strong workforce development and union relationships (US union membership 10.1% in 2023, BLS) reduce volatility.
Right-of-way and land access constrain
Right-of-way and land access for pipelines, substations and quarries depend on landowners and regulators, giving local holders and permitting authorities meaningful leverage that can delay or reroute MDU Resources projects and elevate capital and schedule risk. Early engagement, easements and compensatory structures reduce friction but do not eliminate bargaining power, while MDU’s established regional footprints and prior easements create a cumulative advantage in negotiations.
- Dependence on landowners and regulators
- Holdout power -> delays and cost increases
- Mitigation: early engagement and compensation
- Established footprints = cumulative negotiating advantage
Energy and petrochemical volatility cascades
In 2024 asphalt cement and diesel tracked crude while cement/kiln fuels correlated with gas and coal; rapid input swings often outpaced construction contract adjustments. Hedging and fuel-indexed pricing softened shocks, but bid competitiveness limited full pass-through; utilities’ riders stabilized recovery over multi-year horizons.
- Asphalt/diesel: crude-linked volatility
- Cement fuels: gas/coal correlation
- Hedging/indexing vs limited pass-through
- Utility riders support long-term recovery
Supplier power moderate: OEM lead times 9–18 months; unionization 10.1%
Supplier power is moderate: multi-sourcing and fuel-cost pass-throughs limit margin pressure, but 2024 OEM backlogs pushed lead times to 9–18 months creating timing power. Scarce craft labor raises construction wage premiums; US union membership 10.1% (2023, BLS) cushions volatility. Landowners/regulators hold holdout leverage despite MDU’s regional easements.
| Factor | Impact | 2023–24 Data |
|---|---|---|
| OEM lead times | Schedule/working capital risk | 9–18 months (2024) |
| Unionization | Labor stability | 10.1% (US, 2023) |
What is included in the product
Detailed Word Document
Comprehensive Porter's Five Forces analysis tailored to MDU Resources Group, assessing competitive rivalry, supplier and buyer power, threats of substitutes and new entrants, and strategic barriers protecting incumbency.
Customizable Excel Spreadsheet
Clear one-sheet Porter's Five Forces for MDU Resources Group, distilling competitive pressures into actionable insights for quick decisions. Customize force levels, swap in your data, and export clean visuals for decks—no macros or finance expertise required.
Customers Bargaining Power
Regulated utility customers are captive
Residential and small commercial users in MDU Resources regulated monopoly territories remain largely captive, with limited switching options and utilities representing approximately 75% of regulated operations in 2024. Rate cases and decoupling mechanisms set allowed returns and constrain direct price negotiation, while service quality and affordability targets materially affect regulators' return determinations. Customer programs — efficiency incentives and demand-response — can alter load profiles but do not enable provider choice.
Large C&I and municipalities influence rates
High-load C&I accounts and municipalities can intervene in MDU Resources rate cases and secure special tariffs, pressing for preferential cost allocation and reliability projects tied to their concentrated demand; regulators, however, constrain concessions to preserve system-wide equity and ratepayer fairness. Economic development riders are used to jointly attract industry while sharing incremental costs and benefits.
Construction buyers are price-sensitive and bid-driven
Private developers and public DOTs largely award projects via competitive bids, amplifying buyer leverage and compressing margins. Transparent commodity indices such as the ENR Construction Cost Index and publicly quoted material prices encourage aggressive pricing. Schedule reliability and safety records give non-price differentiation but only partially offset price pressure. IIJA’s roughly 550 billion over five years helps sustain backlog and geographic diversification.
Shippers on pipelines negotiate terms
Shippers on pipelines push for lower tariffs and operational flexibility, while take-or-pay and long-term contracts for many midstream operators limit revenue volatility and restrict renegotiation of rates; basin alternatives and basis differentials continue to influence price negotiation and routing decisions, and shippers’ credit quality drives stricter collateral and payment terms.
- Favorable tariffs and flexibility sought by shippers
- Take-or-pay/long-term contracts reduce renegotiation
- Basin alternatives and basis differentials shape outcomes
- Shipper credit quality affects collateral and terms
Substitution threats strengthen buyer stance
Substitution threats from alternative paving materials, competing aggregates and self-perform options strengthened buyer leverage in 2024 as project owners sought cost savings; behind-the-meter generation and efficiency programs cut utility demand. MDU Resources reported roughly $6.1 billion revenue in 2024 and counters with bundled services, localized supply and reliability; customer loyalty hinges on total lifecycle value.
- 2024 revenue: $6.1B
- BTM solar/efficiency reducing load growth
- Competitive aggregates raise price sensitivity
- MDU focus: bundled services + local supply
Regulated utilities: captive retail base limits pricing while large C&I, shippers push rates
Residential and small commercial customers are largely captive in MDU Resources' regulated territories (utilities ≈75% of regulated ops in 2024), limiting bargaining power; rate cases and decoupling constrain pricing. Large C&I and municipalities exert stronger leverage via rate-case intervention and special tariffs. Shippers and project owners use competitive bidding, basis differentials and BTM solar to press prices; 2024 revenue: $6.1B.
| Metric | Value |
|---|---|
| 2024 revenue | $6.1B |
| Regulated share | ≈75% |
| IIJA (FY) | $550B program |
Same Document Delivered
MDU Resources Group Porter's Five Forces Analysis
This preview shows the exact Porter’s Five Forces analysis for MDU Resources Group you'll receive upon purchase. It evaluates competitive rivalry, supplier and buyer power, threat of new entrants, and substitutes with industry data and strategic implications. The file is fully formatted and ready to download. No placeholders or samples—this is the final deliverable.
Original: $10.00
-65%$10.00
$3.50Description
A Must-Have Tool for Decision-Makers
MDU Resources Group faces moderate supplier leverage, steady buyer demand, and industry rivalry driven by regulated utilities and construction services, with limited threat from new entrants but rising substitute and technological pressures. This snapshot highlights strategic pinch points and potential margin risks for investors and managers. Unlock the full Porter's Five Forces Analysis to explore force-by-force ratings, visuals, and actionable implications for MDU.
Suppliers Bargaining Power
Diversified fuel and inputs mute leverage
MDU sources natural gas, asphalt cement, cementitious materials, steel pipe and power equipment from multiple vendors, reducing single-supplier dependence; long-term indexed contracts and utility fuel-cost pass-throughs further limit margin squeeze. Episodic shortages, notably transformers and bitumen, can still spike costs and extend lead times. Vertical integration in aggregates lowers exposure to materials volatility.
Equipment OEMs hold timing power
Equipment OEMs for large transformers, turbines, compressors and yellow iron reported order backlogs in 2024 that pushed lead times to 9–18 months, giving suppliers timing power over project schedules and MDU Resources’ working capital needs. Price-escalation clauses in contracts mitigate cost risk but not schedule slippage. Strategic inventory builds and multi-sourcing reduced outage risk and deferred capex pressure.
Labor and specialty contractors are tight
Skilled craft labor and specialty subcontractors are scarce in peak seasons and remote Plains geographies, pushing wage and per-diem premiums that directly compress construction margins on MDU Resources projects. Utilities can generally recover prudent cost increases through regulated rate cases over time, but near-term construction margins are immediately exposed. Strong workforce development and union relationships (US union membership 10.1% in 2023, BLS) reduce volatility.
Right-of-way and land access constrain
Right-of-way and land access for pipelines, substations and quarries depend on landowners and regulators, giving local holders and permitting authorities meaningful leverage that can delay or reroute MDU Resources projects and elevate capital and schedule risk. Early engagement, easements and compensatory structures reduce friction but do not eliminate bargaining power, while MDU’s established regional footprints and prior easements create a cumulative advantage in negotiations.
- Dependence on landowners and regulators
- Holdout power -> delays and cost increases
- Mitigation: early engagement and compensation
- Established footprints = cumulative negotiating advantage
Energy and petrochemical volatility cascades
In 2024 asphalt cement and diesel tracked crude while cement/kiln fuels correlated with gas and coal; rapid input swings often outpaced construction contract adjustments. Hedging and fuel-indexed pricing softened shocks, but bid competitiveness limited full pass-through; utilities’ riders stabilized recovery over multi-year horizons.
- Asphalt/diesel: crude-linked volatility
- Cement fuels: gas/coal correlation
- Hedging/indexing vs limited pass-through
- Utility riders support long-term recovery
Supplier power moderate: OEM lead times 9–18 months; unionization 10.1%
Supplier power is moderate: multi-sourcing and fuel-cost pass-throughs limit margin pressure, but 2024 OEM backlogs pushed lead times to 9–18 months creating timing power. Scarce craft labor raises construction wage premiums; US union membership 10.1% (2023, BLS) cushions volatility. Landowners/regulators hold holdout leverage despite MDU’s regional easements.
| Factor | Impact | 2023–24 Data |
|---|---|---|
| OEM lead times | Schedule/working capital risk | 9–18 months (2024) |
| Unionization | Labor stability | 10.1% (US, 2023) |
What is included in the product
Detailed Word Document
Comprehensive Porter's Five Forces analysis tailored to MDU Resources Group, assessing competitive rivalry, supplier and buyer power, threats of substitutes and new entrants, and strategic barriers protecting incumbency.
Customizable Excel Spreadsheet
Clear one-sheet Porter's Five Forces for MDU Resources Group, distilling competitive pressures into actionable insights for quick decisions. Customize force levels, swap in your data, and export clean visuals for decks—no macros or finance expertise required.
Customers Bargaining Power
Regulated utility customers are captive
Residential and small commercial users in MDU Resources regulated monopoly territories remain largely captive, with limited switching options and utilities representing approximately 75% of regulated operations in 2024. Rate cases and decoupling mechanisms set allowed returns and constrain direct price negotiation, while service quality and affordability targets materially affect regulators' return determinations. Customer programs — efficiency incentives and demand-response — can alter load profiles but do not enable provider choice.
Large C&I and municipalities influence rates
High-load C&I accounts and municipalities can intervene in MDU Resources rate cases and secure special tariffs, pressing for preferential cost allocation and reliability projects tied to their concentrated demand; regulators, however, constrain concessions to preserve system-wide equity and ratepayer fairness. Economic development riders are used to jointly attract industry while sharing incremental costs and benefits.
Construction buyers are price-sensitive and bid-driven
Private developers and public DOTs largely award projects via competitive bids, amplifying buyer leverage and compressing margins. Transparent commodity indices such as the ENR Construction Cost Index and publicly quoted material prices encourage aggressive pricing. Schedule reliability and safety records give non-price differentiation but only partially offset price pressure. IIJA’s roughly 550 billion over five years helps sustain backlog and geographic diversification.
Shippers on pipelines negotiate terms
Shippers on pipelines push for lower tariffs and operational flexibility, while take-or-pay and long-term contracts for many midstream operators limit revenue volatility and restrict renegotiation of rates; basin alternatives and basis differentials continue to influence price negotiation and routing decisions, and shippers’ credit quality drives stricter collateral and payment terms.
- Favorable tariffs and flexibility sought by shippers
- Take-or-pay/long-term contracts reduce renegotiation
- Basin alternatives and basis differentials shape outcomes
- Shipper credit quality affects collateral and terms
Substitution threats strengthen buyer stance
Substitution threats from alternative paving materials, competing aggregates and self-perform options strengthened buyer leverage in 2024 as project owners sought cost savings; behind-the-meter generation and efficiency programs cut utility demand. MDU Resources reported roughly $6.1 billion revenue in 2024 and counters with bundled services, localized supply and reliability; customer loyalty hinges on total lifecycle value.
- 2024 revenue: $6.1B
- BTM solar/efficiency reducing load growth
- Competitive aggregates raise price sensitivity
- MDU focus: bundled services + local supply
Regulated utilities: captive retail base limits pricing while large C&I, shippers push rates
Residential and small commercial customers are largely captive in MDU Resources' regulated territories (utilities ≈75% of regulated ops in 2024), limiting bargaining power; rate cases and decoupling constrain pricing. Large C&I and municipalities exert stronger leverage via rate-case intervention and special tariffs. Shippers and project owners use competitive bidding, basis differentials and BTM solar to press prices; 2024 revenue: $6.1B.
| Metric | Value |
|---|---|
| 2024 revenue | $6.1B |
| Regulated share | ≈75% |
| IIJA (FY) | $550B program |
Same Document Delivered
MDU Resources Group Porter's Five Forces Analysis
This preview shows the exact Porter’s Five Forces analysis for MDU Resources Group you'll receive upon purchase. It evaluates competitive rivalry, supplier and buyer power, threat of new entrants, and substitutes with industry data and strategic implications. The file is fully formatted and ready to download. No placeholders or samples—this is the final deliverable.











