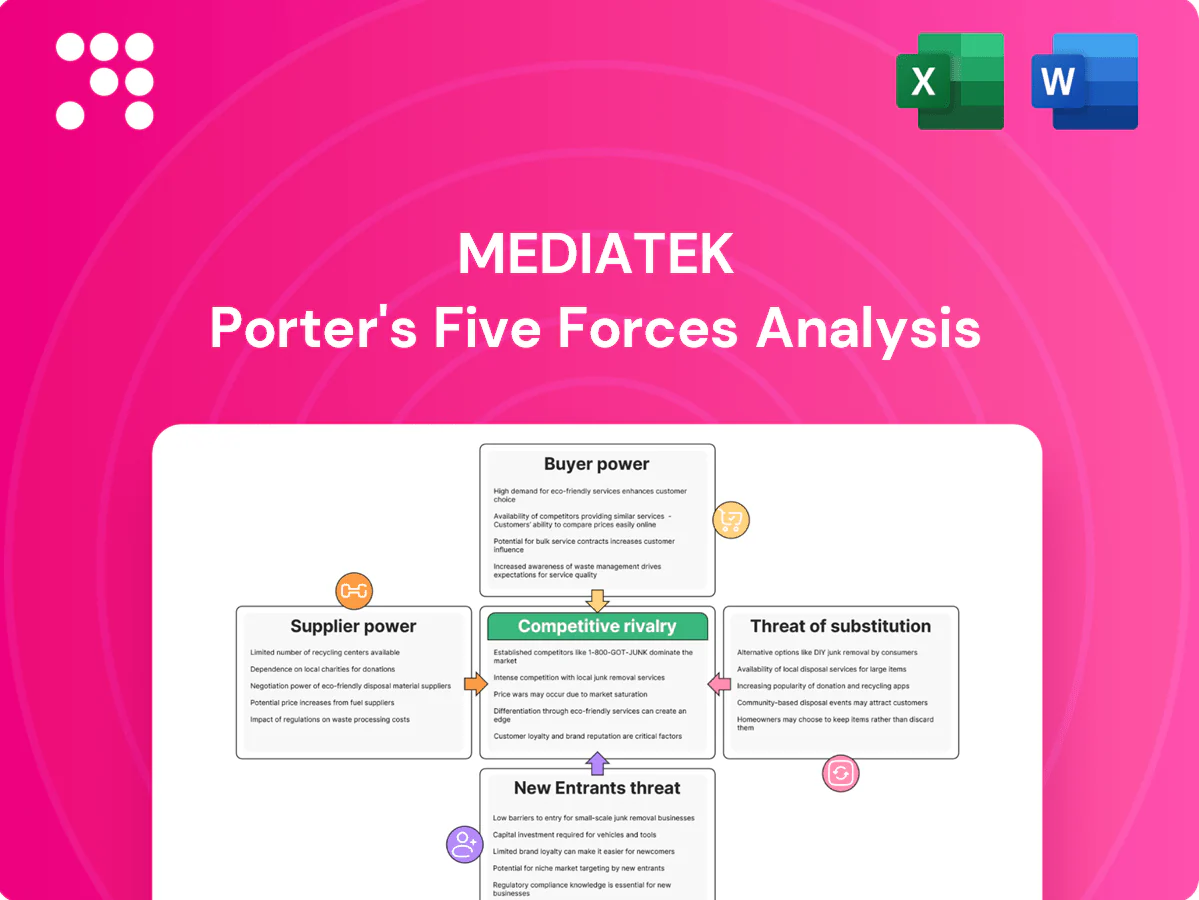
MediaTek Porter's Five Forces Analysis

From Overview to Strategy Blueprint
MediaTek faces intense rivalry from Qualcomm and Huawei, while supplier concentration and component shortages elevate input risks. Buyer power from OEMs and rapid product cycles squeeze margins and accelerate innovation demands. This snapshot only scratches the surface—unlock the full Porter's Five Forces Analysis for force-by-force ratings, visuals, and actionable strategic insights.
Suppliers Bargaining Power

Foundry concentration
MediaTek depends on a small set of advanced foundries, with TSMC supplying the majority of its leading-node wafers; TSMC held over 50% of the global pure‑play foundry market in 2024. Limited alternatives raise supplier leverage on pricing and capacity, while node migrations impose switching frictions and NREs typically in the tens of millions of dollars. Long‑term capacity agreements and advance bookings partially mitigate this supplier power.
Advanced node scarcity
Capacity at 4nm/3nm is structurally tight, with TSMC 3nm utilization reported above 90% in 2024 and foundry capex guidance of $28–36 billion that year prioritizing top customers. This scarcity can delay MediaTek ramps and push wafer ASPs materially higher. MediaTek must balance bleeding-edge exposure versus mature nodes to protect margins. Tight supply strengthens fab bargaining power over customers.

Critical IP and EDA
ARM CPU and GPU IP, RF front‑end specialists and EDA tools (Cadence, Synopsys) remain highly concentrated—ARM accounts for >90% of smartphone CPU architectures and Cadence+Synopsys hold roughly 70% of the ~USD 13B 2024 EDA market—giving suppliers strong leverage via license terms, royalties and tool lock‑in. Architectural shifts (new ARM generations) force compliance and validation costs often in the low‑to‑mid tens of millions USD per product cycle. MediaTek has begun gradual onshore substitution through in‑house IP and partnerships, but full diversification will take several product cycles and substantial CAPEX.

OSAT and substrates
Advanced packaging (FCBGA, SiP) and ABF substrates faced cyclical tightness in 2024, with ABF lead times around 10 weeks; OSAT leaders ASE and Amkor retained dominant capacity and pricing power, commanding priority premiums and turn-up charges. Packaging yields directly raise unit cost and delay MediaTek time-to-market; multi-sourcing plus DFM co-optimization are primary hedges.
- ABF lead times ~10 weeks (2024)
- ASE & Amkor: dominant OSAT capacity (2024)
- Yields impact cost & schedule
- Multi-sourcing + DFM co-optimization as hedges
Geopolitics and controls
Geopolitical export controls in 2024 tightened access to advanced toolkits and IP, increasing MediaTek’s reliance on compliant suppliers and licensed technology. Compliance costs and certification delays raised supplier dependence while rerouting supply chains lengthened lead times and pushed procurement costs up. Suppliers leveraged regulatory barriers as bargaining chips to extract better commercial terms.
- 2024: tightened US/EU export controls
- Higher compliance costs → more supplier dependence
- Rerouting increases lead times and costs
- Regulatory leverage strengthens suppliers
Fab, EDA and packaging concentration heighten supplier leverage over chipmakers
MediaTek faces high supplier power from TSMC (>50% pure‑play share; 3nm utilization >90% in 2024) and concentrated IP/EDA providers (Cadence+Synopsys ~70% of the $13B 2024 EDA market), plus OSAT/ABF tightness (ABF ~10‑week lead times). Long‑term bookings and multi‑sourcing mitigate but switching costs and regulatory controls sustain supplier leverage.
| Supplier | 2024 Metric |
|---|---|
| TSMC | >50% market, 3nm >90% util |
| EDA | Cadence+Synopsys ~70% of $13B |
| Packaging | ABF ~10w lead |
What is included in the product
 Detailed Word Document
Examines MediaTek's competitive landscape via Porter's Five Forces, highlighting rivalry with Qualcomm and Chinese fabless firms, buyer/supplier power, and substitute threats from alternative SoC architectures. Identifies entry barriers (IP, scale), disruptive trends (AI, 5G, in‑house silicon), and strategic levers affecting pricing, margins, and market share.

 Customizable Excel Spreadsheet
One-sheet Porter's Five Forces for MediaTek that distills competitive pressures into a customizable spider chart—perfect for quick deck-ready insights and scenario comparisons without macros or complex setup.
Customers Bargaining Power

Concentrated OEM demand
Smartphone and TV OEM demand is highly concentrated: the top five smartphone OEMs account for roughly 60% of global shipments and the top five TV makers about 70% in 2024, letting large buyers push ASPs and roadmaps aggressively. Design-win dependence makes OEMs highly price-sensitive, pressuring MediaTek on margins. MediaTek held about 40% of the smartphone application processor market in 2024, leveraging platform breadth and reference designs to defend wins and volume.
Switching costs moderate
Porting across SoCs demands software, RF, certification and validation work, but the dominant Android ecosystem and common toolchains (Android ~70% global smartphone OS in 2024) lower friction. OEMs routinely dual-source between MediaTek and Qualcomm—MediaTek held roughly 37% AP market share in Q1 2024 versus Qualcomm ~35%—giving buyers leverage to pressure pricing. Differentiation in silicon, software stacks and RF performance must justify customer stickiness.

Performance-per-dollar focus
OEMs prioritize power efficiency, modem reliability and AI TOPS at target BOMs; failure to meet KPIs drives down-binning or vendor switches, with the top three SoC suppliers holding roughly 80% of 2024 global smartphone shipments, amplifying buyer leverage. Transparent benchmarks and public scorecards sharpen negotiations, while differentiated connectivity and imaging can recapture ASPs and offset price pressure.

Vertical integration risk
OEM vertical integration—Apple (own A/M chips) and Samsung (Exynos in select models)—removes roughly 40% of high-end SoC addressable demand (Apple ~20%, Samsung ~20% of 2024 smartphone volumes), setting price anchors and shrinking MediaTek’s TAM. Even without full insourcing, OEMs demand customized SKUs; co-development deals lock supply but can compress gross margins through pricing and feature commitments.
- Apple insources ~20% of 2024 smartphone volume
- Samsung insources ~20% in select models
- Customized SKUs raise development costs
- Co-development ties reduce pricing power
Aftermarket and lifecycle
Aftermarket and lifecycle pressures shift risk to suppliers as long support windows for automotive and IoT—typically 10–15 year product lifecycles in 2024—force MediaTek to deliver firmware, security updates and longevity commitments. Extended liability and OTA obligations raise operating costs and capital reserves. Service-level terms and multi-year warranties become key negotiation levers with OEMs and enterprises.
- Long lifecycles: 10–15 years (2024)
- Demands: firmware, security, longevity
- Cost impact: higher OPEX/reserves
- Negotiation: SLAs, warranty & update terms
Top5 OEMs ~60-70% and dual-sourcing boost buyer power, squeezing supplier margins
Large OEM concentration (top five smartphone OEMs ~60%, top five TV makers ~70% in 2024) gives buyers strong pricing and roadmap leverage. Dual-sourcing (MediaTek ~37% AP share Q1 2024 vs Qualcomm ~35%) and design-win dependence compress margins. Long product lifecycles (10–15 years) force extended support and raise OPEX, further empowering customers.
| Metric | 2024 value |
|---|---|
| Top5 smartphone OEMs | ~60% |
| Top5 TV makers | ~70% |
| MediaTek AP share | ~40% (37% Q1) |
| Qualcomm AP share Q1 | ~35% |
| Product lifecycles | 10–15 years |
Full Version Awaits
MediaTek Porter's Five Forces Analysis
This preview shows the exact MediaTek Porter's Five Forces Analysis you'll receive upon purchase—no placeholders or samples. The full document is professionally formatted, ready for download and immediate use, and contains the same comprehensive insights and strategic evaluation displayed here.

From Overview to Strategy Blueprint
MediaTek faces intense rivalry from Qualcomm and Huawei, while supplier concentration and component shortages elevate input risks. Buyer power from OEMs and rapid product cycles squeeze margins and accelerate innovation demands. This snapshot only scratches the surface—unlock the full Porter's Five Forces Analysis for force-by-force ratings, visuals, and actionable strategic insights.
Suppliers Bargaining Power
Foundry concentration
MediaTek depends on a small set of advanced foundries, with TSMC supplying the majority of its leading-node wafers; TSMC held over 50% of the global pure‑play foundry market in 2024. Limited alternatives raise supplier leverage on pricing and capacity, while node migrations impose switching frictions and NREs typically in the tens of millions of dollars. Long‑term capacity agreements and advance bookings partially mitigate this supplier power.
Advanced node scarcity
Capacity at 4nm/3nm is structurally tight, with TSMC 3nm utilization reported above 90% in 2024 and foundry capex guidance of $28–36 billion that year prioritizing top customers. This scarcity can delay MediaTek ramps and push wafer ASPs materially higher. MediaTek must balance bleeding-edge exposure versus mature nodes to protect margins. Tight supply strengthens fab bargaining power over customers.
Critical IP and EDA
ARM CPU and GPU IP, RF front‑end specialists and EDA tools (Cadence, Synopsys) remain highly concentrated—ARM accounts for >90% of smartphone CPU architectures and Cadence+Synopsys hold roughly 70% of the ~USD 13B 2024 EDA market—giving suppliers strong leverage via license terms, royalties and tool lock‑in. Architectural shifts (new ARM generations) force compliance and validation costs often in the low‑to‑mid tens of millions USD per product cycle. MediaTek has begun gradual onshore substitution through in‑house IP and partnerships, but full diversification will take several product cycles and substantial CAPEX.
OSAT and substrates
Advanced packaging (FCBGA, SiP) and ABF substrates faced cyclical tightness in 2024, with ABF lead times around 10 weeks; OSAT leaders ASE and Amkor retained dominant capacity and pricing power, commanding priority premiums and turn-up charges. Packaging yields directly raise unit cost and delay MediaTek time-to-market; multi-sourcing plus DFM co-optimization are primary hedges.
- ABF lead times ~10 weeks (2024)
- ASE & Amkor: dominant OSAT capacity (2024)
- Yields impact cost & schedule
- Multi-sourcing + DFM co-optimization as hedges
Geopolitics and controls
Geopolitical export controls in 2024 tightened access to advanced toolkits and IP, increasing MediaTek’s reliance on compliant suppliers and licensed technology. Compliance costs and certification delays raised supplier dependence while rerouting supply chains lengthened lead times and pushed procurement costs up. Suppliers leveraged regulatory barriers as bargaining chips to extract better commercial terms.
- 2024: tightened US/EU export controls
- Higher compliance costs → more supplier dependence
- Rerouting increases lead times and costs
- Regulatory leverage strengthens suppliers
Fab, EDA and packaging concentration heighten supplier leverage over chipmakers
MediaTek faces high supplier power from TSMC (>50% pure‑play share; 3nm utilization >90% in 2024) and concentrated IP/EDA providers (Cadence+Synopsys ~70% of the $13B 2024 EDA market), plus OSAT/ABF tightness (ABF ~10‑week lead times). Long‑term bookings and multi‑sourcing mitigate but switching costs and regulatory controls sustain supplier leverage.
| Supplier | 2024 Metric |
|---|---|
| TSMC | >50% market, 3nm >90% util |
| EDA | Cadence+Synopsys ~70% of $13B |
| Packaging | ABF ~10w lead |
What is included in the product
Detailed Word Document
Examines MediaTek's competitive landscape via Porter's Five Forces, highlighting rivalry with Qualcomm and Chinese fabless firms, buyer/supplier power, and substitute threats from alternative SoC architectures. Identifies entry barriers (IP, scale), disruptive trends (AI, 5G, in‑house silicon), and strategic levers affecting pricing, margins, and market share.
Customizable Excel Spreadsheet
One-sheet Porter's Five Forces for MediaTek that distills competitive pressures into a customizable spider chart—perfect for quick deck-ready insights and scenario comparisons without macros or complex setup.
Customers Bargaining Power
Concentrated OEM demand
Smartphone and TV OEM demand is highly concentrated: the top five smartphone OEMs account for roughly 60% of global shipments and the top five TV makers about 70% in 2024, letting large buyers push ASPs and roadmaps aggressively. Design-win dependence makes OEMs highly price-sensitive, pressuring MediaTek on margins. MediaTek held about 40% of the smartphone application processor market in 2024, leveraging platform breadth and reference designs to defend wins and volume.
Switching costs moderate
Porting across SoCs demands software, RF, certification and validation work, but the dominant Android ecosystem and common toolchains (Android ~70% global smartphone OS in 2024) lower friction. OEMs routinely dual-source between MediaTek and Qualcomm—MediaTek held roughly 37% AP market share in Q1 2024 versus Qualcomm ~35%—giving buyers leverage to pressure pricing. Differentiation in silicon, software stacks and RF performance must justify customer stickiness.
Performance-per-dollar focus
OEMs prioritize power efficiency, modem reliability and AI TOPS at target BOMs; failure to meet KPIs drives down-binning or vendor switches, with the top three SoC suppliers holding roughly 80% of 2024 global smartphone shipments, amplifying buyer leverage. Transparent benchmarks and public scorecards sharpen negotiations, while differentiated connectivity and imaging can recapture ASPs and offset price pressure.
Vertical integration risk
OEM vertical integration—Apple (own A/M chips) and Samsung (Exynos in select models)—removes roughly 40% of high-end SoC addressable demand (Apple ~20%, Samsung ~20% of 2024 smartphone volumes), setting price anchors and shrinking MediaTek’s TAM. Even without full insourcing, OEMs demand customized SKUs; co-development deals lock supply but can compress gross margins through pricing and feature commitments.
- Apple insources ~20% of 2024 smartphone volume
- Samsung insources ~20% in select models
- Customized SKUs raise development costs
- Co-development ties reduce pricing power
Aftermarket and lifecycle
Aftermarket and lifecycle pressures shift risk to suppliers as long support windows for automotive and IoT—typically 10–15 year product lifecycles in 2024—force MediaTek to deliver firmware, security updates and longevity commitments. Extended liability and OTA obligations raise operating costs and capital reserves. Service-level terms and multi-year warranties become key negotiation levers with OEMs and enterprises.
- Long lifecycles: 10–15 years (2024)
- Demands: firmware, security, longevity
- Cost impact: higher OPEX/reserves
- Negotiation: SLAs, warranty & update terms
Top5 OEMs ~60-70% and dual-sourcing boost buyer power, squeezing supplier margins
Large OEM concentration (top five smartphone OEMs ~60%, top five TV makers ~70% in 2024) gives buyers strong pricing and roadmap leverage. Dual-sourcing (MediaTek ~37% AP share Q1 2024 vs Qualcomm ~35%) and design-win dependence compress margins. Long product lifecycles (10–15 years) force extended support and raise OPEX, further empowering customers.
| Metric | 2024 value |
|---|---|
| Top5 smartphone OEMs | ~60% |
| Top5 TV makers | ~70% |
| MediaTek AP share | ~40% (37% Q1) |
| Qualcomm AP share Q1 | ~35% |
| Product lifecycles | 10–15 years |
Full Version Awaits
MediaTek Porter's Five Forces Analysis
This preview shows the exact MediaTek Porter's Five Forces Analysis you'll receive upon purchase—no placeholders or samples. The full document is professionally formatted, ready for download and immediate use, and contains the same comprehensive insights and strategic evaluation displayed here.
Original: $10.00
-65%$10.00
$3.50Description
From Overview to Strategy Blueprint
MediaTek faces intense rivalry from Qualcomm and Huawei, while supplier concentration and component shortages elevate input risks. Buyer power from OEMs and rapid product cycles squeeze margins and accelerate innovation demands. This snapshot only scratches the surface—unlock the full Porter's Five Forces Analysis for force-by-force ratings, visuals, and actionable strategic insights.
Suppliers Bargaining Power
Foundry concentration
MediaTek depends on a small set of advanced foundries, with TSMC supplying the majority of its leading-node wafers; TSMC held over 50% of the global pure‑play foundry market in 2024. Limited alternatives raise supplier leverage on pricing and capacity, while node migrations impose switching frictions and NREs typically in the tens of millions of dollars. Long‑term capacity agreements and advance bookings partially mitigate this supplier power.
Advanced node scarcity
Capacity at 4nm/3nm is structurally tight, with TSMC 3nm utilization reported above 90% in 2024 and foundry capex guidance of $28–36 billion that year prioritizing top customers. This scarcity can delay MediaTek ramps and push wafer ASPs materially higher. MediaTek must balance bleeding-edge exposure versus mature nodes to protect margins. Tight supply strengthens fab bargaining power over customers.
Critical IP and EDA
ARM CPU and GPU IP, RF front‑end specialists and EDA tools (Cadence, Synopsys) remain highly concentrated—ARM accounts for >90% of smartphone CPU architectures and Cadence+Synopsys hold roughly 70% of the ~USD 13B 2024 EDA market—giving suppliers strong leverage via license terms, royalties and tool lock‑in. Architectural shifts (new ARM generations) force compliance and validation costs often in the low‑to‑mid tens of millions USD per product cycle. MediaTek has begun gradual onshore substitution through in‑house IP and partnerships, but full diversification will take several product cycles and substantial CAPEX.
OSAT and substrates
Advanced packaging (FCBGA, SiP) and ABF substrates faced cyclical tightness in 2024, with ABF lead times around 10 weeks; OSAT leaders ASE and Amkor retained dominant capacity and pricing power, commanding priority premiums and turn-up charges. Packaging yields directly raise unit cost and delay MediaTek time-to-market; multi-sourcing plus DFM co-optimization are primary hedges.
- ABF lead times ~10 weeks (2024)
- ASE & Amkor: dominant OSAT capacity (2024)
- Yields impact cost & schedule
- Multi-sourcing + DFM co-optimization as hedges
Geopolitics and controls
Geopolitical export controls in 2024 tightened access to advanced toolkits and IP, increasing MediaTek’s reliance on compliant suppliers and licensed technology. Compliance costs and certification delays raised supplier dependence while rerouting supply chains lengthened lead times and pushed procurement costs up. Suppliers leveraged regulatory barriers as bargaining chips to extract better commercial terms.
- 2024: tightened US/EU export controls
- Higher compliance costs → more supplier dependence
- Rerouting increases lead times and costs
- Regulatory leverage strengthens suppliers
Fab, EDA and packaging concentration heighten supplier leverage over chipmakers
MediaTek faces high supplier power from TSMC (>50% pure‑play share; 3nm utilization >90% in 2024) and concentrated IP/EDA providers (Cadence+Synopsys ~70% of the $13B 2024 EDA market), plus OSAT/ABF tightness (ABF ~10‑week lead times). Long‑term bookings and multi‑sourcing mitigate but switching costs and regulatory controls sustain supplier leverage.
| Supplier | 2024 Metric |
|---|---|
| TSMC | >50% market, 3nm >90% util |
| EDA | Cadence+Synopsys ~70% of $13B |
| Packaging | ABF ~10w lead |
What is included in the product
Detailed Word Document
Examines MediaTek's competitive landscape via Porter's Five Forces, highlighting rivalry with Qualcomm and Chinese fabless firms, buyer/supplier power, and substitute threats from alternative SoC architectures. Identifies entry barriers (IP, scale), disruptive trends (AI, 5G, in‑house silicon), and strategic levers affecting pricing, margins, and market share.
Customizable Excel Spreadsheet
One-sheet Porter's Five Forces for MediaTek that distills competitive pressures into a customizable spider chart—perfect for quick deck-ready insights and scenario comparisons without macros or complex setup.
Customers Bargaining Power
Concentrated OEM demand
Smartphone and TV OEM demand is highly concentrated: the top five smartphone OEMs account for roughly 60% of global shipments and the top five TV makers about 70% in 2024, letting large buyers push ASPs and roadmaps aggressively. Design-win dependence makes OEMs highly price-sensitive, pressuring MediaTek on margins. MediaTek held about 40% of the smartphone application processor market in 2024, leveraging platform breadth and reference designs to defend wins and volume.
Switching costs moderate
Porting across SoCs demands software, RF, certification and validation work, but the dominant Android ecosystem and common toolchains (Android ~70% global smartphone OS in 2024) lower friction. OEMs routinely dual-source between MediaTek and Qualcomm—MediaTek held roughly 37% AP market share in Q1 2024 versus Qualcomm ~35%—giving buyers leverage to pressure pricing. Differentiation in silicon, software stacks and RF performance must justify customer stickiness.
Performance-per-dollar focus
OEMs prioritize power efficiency, modem reliability and AI TOPS at target BOMs; failure to meet KPIs drives down-binning or vendor switches, with the top three SoC suppliers holding roughly 80% of 2024 global smartphone shipments, amplifying buyer leverage. Transparent benchmarks and public scorecards sharpen negotiations, while differentiated connectivity and imaging can recapture ASPs and offset price pressure.
Vertical integration risk
OEM vertical integration—Apple (own A/M chips) and Samsung (Exynos in select models)—removes roughly 40% of high-end SoC addressable demand (Apple ~20%, Samsung ~20% of 2024 smartphone volumes), setting price anchors and shrinking MediaTek’s TAM. Even without full insourcing, OEMs demand customized SKUs; co-development deals lock supply but can compress gross margins through pricing and feature commitments.
- Apple insources ~20% of 2024 smartphone volume
- Samsung insources ~20% in select models
- Customized SKUs raise development costs
- Co-development ties reduce pricing power
Aftermarket and lifecycle
Aftermarket and lifecycle pressures shift risk to suppliers as long support windows for automotive and IoT—typically 10–15 year product lifecycles in 2024—force MediaTek to deliver firmware, security updates and longevity commitments. Extended liability and OTA obligations raise operating costs and capital reserves. Service-level terms and multi-year warranties become key negotiation levers with OEMs and enterprises.
- Long lifecycles: 10–15 years (2024)
- Demands: firmware, security, longevity
- Cost impact: higher OPEX/reserves
- Negotiation: SLAs, warranty & update terms
Top5 OEMs ~60-70% and dual-sourcing boost buyer power, squeezing supplier margins
Large OEM concentration (top five smartphone OEMs ~60%, top five TV makers ~70% in 2024) gives buyers strong pricing and roadmap leverage. Dual-sourcing (MediaTek ~37% AP share Q1 2024 vs Qualcomm ~35%) and design-win dependence compress margins. Long product lifecycles (10–15 years) force extended support and raise OPEX, further empowering customers.
| Metric | 2024 value |
|---|---|
| Top5 smartphone OEMs | ~60% |
| Top5 TV makers | ~70% |
| MediaTek AP share | ~40% (37% Q1) |
| Qualcomm AP share Q1 | ~35% |
| Product lifecycles | 10–15 years |
Full Version Awaits
MediaTek Porter's Five Forces Analysis
This preview shows the exact MediaTek Porter's Five Forces Analysis you'll receive upon purchase—no placeholders or samples. The full document is professionally formatted, ready for download and immediate use, and contains the same comprehensive insights and strategic evaluation displayed here.











