Medicover Boston Consulting Group Matrix

See the Bigger Picture
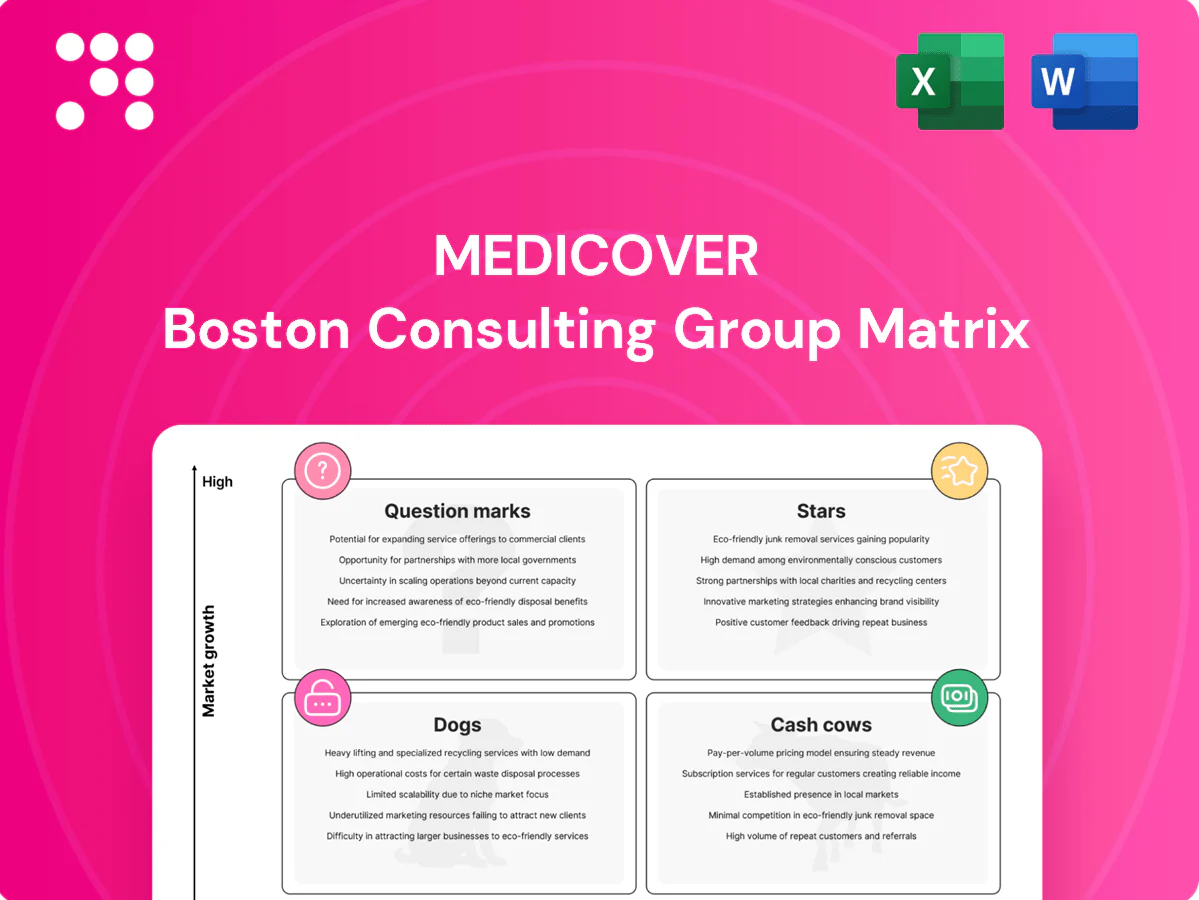
Quick snapshot: the Medicover BCG Matrix shows which services are fueling growth, which are steady earners, and which may be draining cash — a must-see if you manage healthcare portfolios. This preview teases quadrant placements and market signals; the full report gives exact product positions, data-backed recommendations, and a clear roadmap for capital allocation. Buy the complete BCG Matrix for an editable Word report plus an Excel summary and act with confidence today.
Stars

Integrated diagnostics network
High-volume Medicover labs, processing >5 million tests annually in 2024, leverage strong brand pull across fast-growing CEE markets where preventive testing demand is compounding (diagnostics market ~6% CAGR in 2020–24). Prioritize feeding capacity, cold-chain logistics, and clinician partnerships to capture payor shifts to prevention. Hold share now; as volumes scale, margins and cash flow convert the network into a powerful cash engine.
Outpatient clinics in urban hubs
Outpatient clinics in urban hubs show sticky patient flows with short visit cycles (avg 20–30 min) and a 2024 outpatient visit rise of ~18% YoY, gaining share in expanding cities (now ~30% of local revenue). Cross-referrals from diagnostics boost throughput by ~20%, so prioritize smart scheduling, specialty mix and digital intake, protect access points and keep opening where population density and payor mix justify scale.

Digital care platform
Digital care platform sits in high-growth BCG quadrant as telehealth and remote monitoring show sharp adoption off a small base; global telehealth market reached roughly $90B in 2024 and remote monitoring markets are growing at c.15–18% CAGR. Retention is strong when digital services are integrated with clinics and labs, driving higher lifetime value. Invest in UX, unified EHRs and standardized care pathways to convert users into referred patients—the flywheel is referrals, not stand-alone visits.

Specialty lines with proven outcomes
Specialty lines—oncology, cardiology, orthopedics—are growing faster than overall hospital services, with oncology market around $200B in 2024 and sector CAGRs in the high single to low double digits where outcomes are clearly differentiated; Medicover leverages brand equity to attract complex cases and scale. Continued spend on top clinicians and equipment tightens unit economics and can flip Stars to cash cows as markets stabilize.
Corporate preventive programs
Corporate preventive programs
Employers are shifting to proactive screening and digital follow-ups, driving demand for bundled diagnostics plus clinic access that wins RFPs and increases wallet share. Focus on reporting, SLAs and patient convenience to protect margins and retention. Land-and-expand is proving effective; maintain investment in sales and product integrations.- Proactive screening
- Bundled diagnostics + clinic access
- Reporting & SLAs
- Convenience-focused retention
- Land-and-expand growth
>5M, +18% & $90B — monetize scale
Medicover Stars: labs >5M tests (2024), outpatient visits +18% YoY (2024), digital platform in ~$90B telehealth market (2024) with rapid uptake, specialties (oncology ~$200B 2024) scale referrals and margins—prioritize capacity, UX, referrals to convert growth into cash flow.
| Segment | 2024 metric | CAGR |
|---|---|---|
| Labs | >5M tests | ~6% (2020–24) |
| Outpatient | Visits +18% YoY | — |
| Digital | $90B market | 15–18% |
| Oncology | $200B | HSD–LDD% |
What is included in the product
 Detailed Word Document
Concise BCG analysis of Medicover’s units with clear insights on Stars, Cash Cows, Question Marks and Dogs, plus investment recommendations.

 Customizable Excel Spreadsheet
One-page Medicover BCG Matrix relieving decision pain — quadrant view, export-ready, C-level clean for fast presentations.
Cash Cows

Routine lab testing
Routine lab testing is a cash cow for Medicover with mature volumes, stable payer and physician contracts and predictable margins, underpinning recurring revenue. Diagnostics inform roughly 70% of clinical decisions, so automation keeps unit costs low and quality high while reducing manual error. Minimal promotion beyond relationship management is needed; prioritize milking scale and incremental throughput upgrades.
Radiology in established sites
Radiology in established Medicover sites runs as a cash cow with high installed-base utilization—scanners typically operate at 75–85% capacity in steady markets, supported by strong referral networks that keep throughput consistent. Focus is on maintaining >98% uptime and sub-24-hour turnaround rather than heavy marketing. Cash generated covers a large portion of OPEX and funds disciplined capex renewals, with incremental imaging margins often exceeding core clinic margins. Operational discipline on service contracts and scheduling preserves free cash flow.

Primary care in mature cities
Primary care in mature cities delivers full panels, high repeat visits, and standardized care pathways, driving steady clinic utilization with repeat care often responsible for roughly half of visit volume in mature markets.
Market growth is limited but provides a dependable cash flow stream; focus on optimizing staffing, preventing leakage to specialists, and keeping wait times under 7 days preserves throughput and margins.
These clinics generate reliable operating cash to fund growth bets in faster-growing segments while maintaining predictable revenue run-rates for Medicover.

Health check bundles
Health check bundles are standardized preventive packages with strong Medicover brand recognition, sold mainly via clinic and lab cross-sell, keeping acquisition costs low and volumes high while preserving price discipline and operational efficiency to drive margin.
These high-margin services are cash cows that fund stable dividends and underwrite R&D investments in diagnostics and digital care.
- Standardized, branded preventive packages
- Low acquisition cost via clinic/lab cross-sell
- Price discipline and operational efficiency
- Sustain dividends and R&D funding
Insurer and payor contracts
Insurer and payor contracts form a cash cow for Medicover, underpinned by longstanding agreements with predictable tariffs and stable patient volumes; growth is low but revenue certainty is high. The business prioritizes service-level performance and enhanced data-sharing to secure renewals on favorable commercial terms. These contracts produce steady free cash flow without heavy incremental capital expenditure.
- Longstanding agreements: predictable tariffs and volumes
- Low growth, high certainty: reliable cash generation
- Renewal levers: service levels and data-sharing
- Capital efficiency: steady free cash without heavy spend
Routine labs, radiology & primary care fund growth; tests drive ~70%
Routine labs (diagnostics inform ~70% of decisions) and radiology (scanners at 75–85% utilization, >98% uptime, sub-24h turnaround) plus mature primary care (repeat visits ~50% of volume) and branded health-check bundles form Medicover cash cows, delivering predictable recurring cash to fund growth bets.
| Asset | Key metric |
|---|---|
| Routine labs | Diagnostics ≈70% clinical decisions |
| Radiology | Utilization 75–85%, uptime >98% |
| Primary care | Repeat visits ~50% volume |
| Health checks | Standardized cross-sell, high margin |
What You See Is What You Get
Medicover BCG Matrix
The file you're previewing is the exact Medicover BCG Matrix you'll receive after purchase—no watermarks, no placeholders, just the finished, professionally formatted report. It’s built for immediate use: edit, print, or present without tweaks. Delivered instantly to your inbox, the document reflects the same market-backed analysis and clarity you see here. No surprises—just plug-and-play strategy content.

See the Bigger Picture
Quick snapshot: the Medicover BCG Matrix shows which services are fueling growth, which are steady earners, and which may be draining cash — a must-see if you manage healthcare portfolios. This preview teases quadrant placements and market signals; the full report gives exact product positions, data-backed recommendations, and a clear roadmap for capital allocation. Buy the complete BCG Matrix for an editable Word report plus an Excel summary and act with confidence today.
Stars
Integrated diagnostics network
High-volume Medicover labs, processing >5 million tests annually in 2024, leverage strong brand pull across fast-growing CEE markets where preventive testing demand is compounding (diagnostics market ~6% CAGR in 2020–24). Prioritize feeding capacity, cold-chain logistics, and clinician partnerships to capture payor shifts to prevention. Hold share now; as volumes scale, margins and cash flow convert the network into a powerful cash engine.
Outpatient clinics in urban hubs
Outpatient clinics in urban hubs show sticky patient flows with short visit cycles (avg 20–30 min) and a 2024 outpatient visit rise of ~18% YoY, gaining share in expanding cities (now ~30% of local revenue). Cross-referrals from diagnostics boost throughput by ~20%, so prioritize smart scheduling, specialty mix and digital intake, protect access points and keep opening where population density and payor mix justify scale.
Digital care platform
Digital care platform sits in high-growth BCG quadrant as telehealth and remote monitoring show sharp adoption off a small base; global telehealth market reached roughly $90B in 2024 and remote monitoring markets are growing at c.15–18% CAGR. Retention is strong when digital services are integrated with clinics and labs, driving higher lifetime value. Invest in UX, unified EHRs and standardized care pathways to convert users into referred patients—the flywheel is referrals, not stand-alone visits.
Specialty lines with proven outcomes
Specialty lines—oncology, cardiology, orthopedics—are growing faster than overall hospital services, with oncology market around $200B in 2024 and sector CAGRs in the high single to low double digits where outcomes are clearly differentiated; Medicover leverages brand equity to attract complex cases and scale. Continued spend on top clinicians and equipment tightens unit economics and can flip Stars to cash cows as markets stabilize.
Corporate preventive programs
Corporate preventive programs
Employers are shifting to proactive screening and digital follow-ups, driving demand for bundled diagnostics plus clinic access that wins RFPs and increases wallet share. Focus on reporting, SLAs and patient convenience to protect margins and retention. Land-and-expand is proving effective; maintain investment in sales and product integrations.- Proactive screening
- Bundled diagnostics + clinic access
- Reporting & SLAs
- Convenience-focused retention
- Land-and-expand growth
>5M, +18% & $90B — monetize scale
Medicover Stars: labs >5M tests (2024), outpatient visits +18% YoY (2024), digital platform in ~$90B telehealth market (2024) with rapid uptake, specialties (oncology ~$200B 2024) scale referrals and margins—prioritize capacity, UX, referrals to convert growth into cash flow.
| Segment | 2024 metric | CAGR |
|---|---|---|
| Labs | >5M tests | ~6% (2020–24) |
| Outpatient | Visits +18% YoY | — |
| Digital | $90B market | 15–18% |
| Oncology | $200B | HSD–LDD% |
What is included in the product
Detailed Word Document
Concise BCG analysis of Medicover’s units with clear insights on Stars, Cash Cows, Question Marks and Dogs, plus investment recommendations.
Customizable Excel Spreadsheet
One-page Medicover BCG Matrix relieving decision pain — quadrant view, export-ready, C-level clean for fast presentations.
Cash Cows
Routine lab testing
Routine lab testing is a cash cow for Medicover with mature volumes, stable payer and physician contracts and predictable margins, underpinning recurring revenue. Diagnostics inform roughly 70% of clinical decisions, so automation keeps unit costs low and quality high while reducing manual error. Minimal promotion beyond relationship management is needed; prioritize milking scale and incremental throughput upgrades.
Radiology in established sites
Radiology in established Medicover sites runs as a cash cow with high installed-base utilization—scanners typically operate at 75–85% capacity in steady markets, supported by strong referral networks that keep throughput consistent. Focus is on maintaining >98% uptime and sub-24-hour turnaround rather than heavy marketing. Cash generated covers a large portion of OPEX and funds disciplined capex renewals, with incremental imaging margins often exceeding core clinic margins. Operational discipline on service contracts and scheduling preserves free cash flow.
Primary care in mature cities
Primary care in mature cities delivers full panels, high repeat visits, and standardized care pathways, driving steady clinic utilization with repeat care often responsible for roughly half of visit volume in mature markets.
Market growth is limited but provides a dependable cash flow stream; focus on optimizing staffing, preventing leakage to specialists, and keeping wait times under 7 days preserves throughput and margins.
These clinics generate reliable operating cash to fund growth bets in faster-growing segments while maintaining predictable revenue run-rates for Medicover.
Health check bundles
Health check bundles are standardized preventive packages with strong Medicover brand recognition, sold mainly via clinic and lab cross-sell, keeping acquisition costs low and volumes high while preserving price discipline and operational efficiency to drive margin.
These high-margin services are cash cows that fund stable dividends and underwrite R&D investments in diagnostics and digital care.
- Standardized, branded preventive packages
- Low acquisition cost via clinic/lab cross-sell
- Price discipline and operational efficiency
- Sustain dividends and R&D funding
Insurer and payor contracts
Insurer and payor contracts form a cash cow for Medicover, underpinned by longstanding agreements with predictable tariffs and stable patient volumes; growth is low but revenue certainty is high. The business prioritizes service-level performance and enhanced data-sharing to secure renewals on favorable commercial terms. These contracts produce steady free cash flow without heavy incremental capital expenditure.
- Longstanding agreements: predictable tariffs and volumes
- Low growth, high certainty: reliable cash generation
- Renewal levers: service levels and data-sharing
- Capital efficiency: steady free cash without heavy spend
Routine labs, radiology & primary care fund growth; tests drive ~70%
Routine labs (diagnostics inform ~70% of decisions) and radiology (scanners at 75–85% utilization, >98% uptime, sub-24h turnaround) plus mature primary care (repeat visits ~50% of volume) and branded health-check bundles form Medicover cash cows, delivering predictable recurring cash to fund growth bets.
| Asset | Key metric |
|---|---|
| Routine labs | Diagnostics ≈70% clinical decisions |
| Radiology | Utilization 75–85%, uptime >98% |
| Primary care | Repeat visits ~50% volume |
| Health checks | Standardized cross-sell, high margin |
What You See Is What You Get
Medicover BCG Matrix
The file you're previewing is the exact Medicover BCG Matrix you'll receive after purchase—no watermarks, no placeholders, just the finished, professionally formatted report. It’s built for immediate use: edit, print, or present without tweaks. Delivered instantly to your inbox, the document reflects the same market-backed analysis and clarity you see here. No surprises—just plug-and-play strategy content.
Description
See the Bigger Picture
Quick snapshot: the Medicover BCG Matrix shows which services are fueling growth, which are steady earners, and which may be draining cash — a must-see if you manage healthcare portfolios. This preview teases quadrant placements and market signals; the full report gives exact product positions, data-backed recommendations, and a clear roadmap for capital allocation. Buy the complete BCG Matrix for an editable Word report plus an Excel summary and act with confidence today.
Stars
Integrated diagnostics network
High-volume Medicover labs, processing >5 million tests annually in 2024, leverage strong brand pull across fast-growing CEE markets where preventive testing demand is compounding (diagnostics market ~6% CAGR in 2020–24). Prioritize feeding capacity, cold-chain logistics, and clinician partnerships to capture payor shifts to prevention. Hold share now; as volumes scale, margins and cash flow convert the network into a powerful cash engine.
Outpatient clinics in urban hubs
Outpatient clinics in urban hubs show sticky patient flows with short visit cycles (avg 20–30 min) and a 2024 outpatient visit rise of ~18% YoY, gaining share in expanding cities (now ~30% of local revenue). Cross-referrals from diagnostics boost throughput by ~20%, so prioritize smart scheduling, specialty mix and digital intake, protect access points and keep opening where population density and payor mix justify scale.
Digital care platform
Digital care platform sits in high-growth BCG quadrant as telehealth and remote monitoring show sharp adoption off a small base; global telehealth market reached roughly $90B in 2024 and remote monitoring markets are growing at c.15–18% CAGR. Retention is strong when digital services are integrated with clinics and labs, driving higher lifetime value. Invest in UX, unified EHRs and standardized care pathways to convert users into referred patients—the flywheel is referrals, not stand-alone visits.
Specialty lines with proven outcomes
Specialty lines—oncology, cardiology, orthopedics—are growing faster than overall hospital services, with oncology market around $200B in 2024 and sector CAGRs in the high single to low double digits where outcomes are clearly differentiated; Medicover leverages brand equity to attract complex cases and scale. Continued spend on top clinicians and equipment tightens unit economics and can flip Stars to cash cows as markets stabilize.
Corporate preventive programs
Corporate preventive programs
Employers are shifting to proactive screening and digital follow-ups, driving demand for bundled diagnostics plus clinic access that wins RFPs and increases wallet share. Focus on reporting, SLAs and patient convenience to protect margins and retention. Land-and-expand is proving effective; maintain investment in sales and product integrations.- Proactive screening
- Bundled diagnostics + clinic access
- Reporting & SLAs
- Convenience-focused retention
- Land-and-expand growth
>5M, +18% & $90B — monetize scale
Medicover Stars: labs >5M tests (2024), outpatient visits +18% YoY (2024), digital platform in ~$90B telehealth market (2024) with rapid uptake, specialties (oncology ~$200B 2024) scale referrals and margins—prioritize capacity, UX, referrals to convert growth into cash flow.
| Segment | 2024 metric | CAGR |
|---|---|---|
| Labs | >5M tests | ~6% (2020–24) |
| Outpatient | Visits +18% YoY | — |
| Digital | $90B market | 15–18% |
| Oncology | $200B | HSD–LDD% |
What is included in the product
Detailed Word Document
Concise BCG analysis of Medicover’s units with clear insights on Stars, Cash Cows, Question Marks and Dogs, plus investment recommendations.
Customizable Excel Spreadsheet
One-page Medicover BCG Matrix relieving decision pain — quadrant view, export-ready, C-level clean for fast presentations.
Cash Cows
Routine lab testing
Routine lab testing is a cash cow for Medicover with mature volumes, stable payer and physician contracts and predictable margins, underpinning recurring revenue. Diagnostics inform roughly 70% of clinical decisions, so automation keeps unit costs low and quality high while reducing manual error. Minimal promotion beyond relationship management is needed; prioritize milking scale and incremental throughput upgrades.
Radiology in established sites
Radiology in established Medicover sites runs as a cash cow with high installed-base utilization—scanners typically operate at 75–85% capacity in steady markets, supported by strong referral networks that keep throughput consistent. Focus is on maintaining >98% uptime and sub-24-hour turnaround rather than heavy marketing. Cash generated covers a large portion of OPEX and funds disciplined capex renewals, with incremental imaging margins often exceeding core clinic margins. Operational discipline on service contracts and scheduling preserves free cash flow.
Primary care in mature cities
Primary care in mature cities delivers full panels, high repeat visits, and standardized care pathways, driving steady clinic utilization with repeat care often responsible for roughly half of visit volume in mature markets.
Market growth is limited but provides a dependable cash flow stream; focus on optimizing staffing, preventing leakage to specialists, and keeping wait times under 7 days preserves throughput and margins.
These clinics generate reliable operating cash to fund growth bets in faster-growing segments while maintaining predictable revenue run-rates for Medicover.
Health check bundles
Health check bundles are standardized preventive packages with strong Medicover brand recognition, sold mainly via clinic and lab cross-sell, keeping acquisition costs low and volumes high while preserving price discipline and operational efficiency to drive margin.
These high-margin services are cash cows that fund stable dividends and underwrite R&D investments in diagnostics and digital care.
- Standardized, branded preventive packages
- Low acquisition cost via clinic/lab cross-sell
- Price discipline and operational efficiency
- Sustain dividends and R&D funding
Insurer and payor contracts
Insurer and payor contracts form a cash cow for Medicover, underpinned by longstanding agreements with predictable tariffs and stable patient volumes; growth is low but revenue certainty is high. The business prioritizes service-level performance and enhanced data-sharing to secure renewals on favorable commercial terms. These contracts produce steady free cash flow without heavy incremental capital expenditure.
- Longstanding agreements: predictable tariffs and volumes
- Low growth, high certainty: reliable cash generation
- Renewal levers: service levels and data-sharing
- Capital efficiency: steady free cash without heavy spend
Routine labs, radiology & primary care fund growth; tests drive ~70%
Routine labs (diagnostics inform ~70% of decisions) and radiology (scanners at 75–85% utilization, >98% uptime, sub-24h turnaround) plus mature primary care (repeat visits ~50% of volume) and branded health-check bundles form Medicover cash cows, delivering predictable recurring cash to fund growth bets.
| Asset | Key metric |
|---|---|
| Routine labs | Diagnostics ≈70% clinical decisions |
| Radiology | Utilization 75–85%, uptime >98% |
| Primary care | Repeat visits ~50% volume |
| Health checks | Standardized cross-sell, high margin |
What You See Is What You Get
Medicover BCG Matrix
The file you're previewing is the exact Medicover BCG Matrix you'll receive after purchase—no watermarks, no placeholders, just the finished, professionally formatted report. It’s built for immediate use: edit, print, or present without tweaks. Delivered instantly to your inbox, the document reflects the same market-backed analysis and clarity you see here. No surprises—just plug-and-play strategy content.











