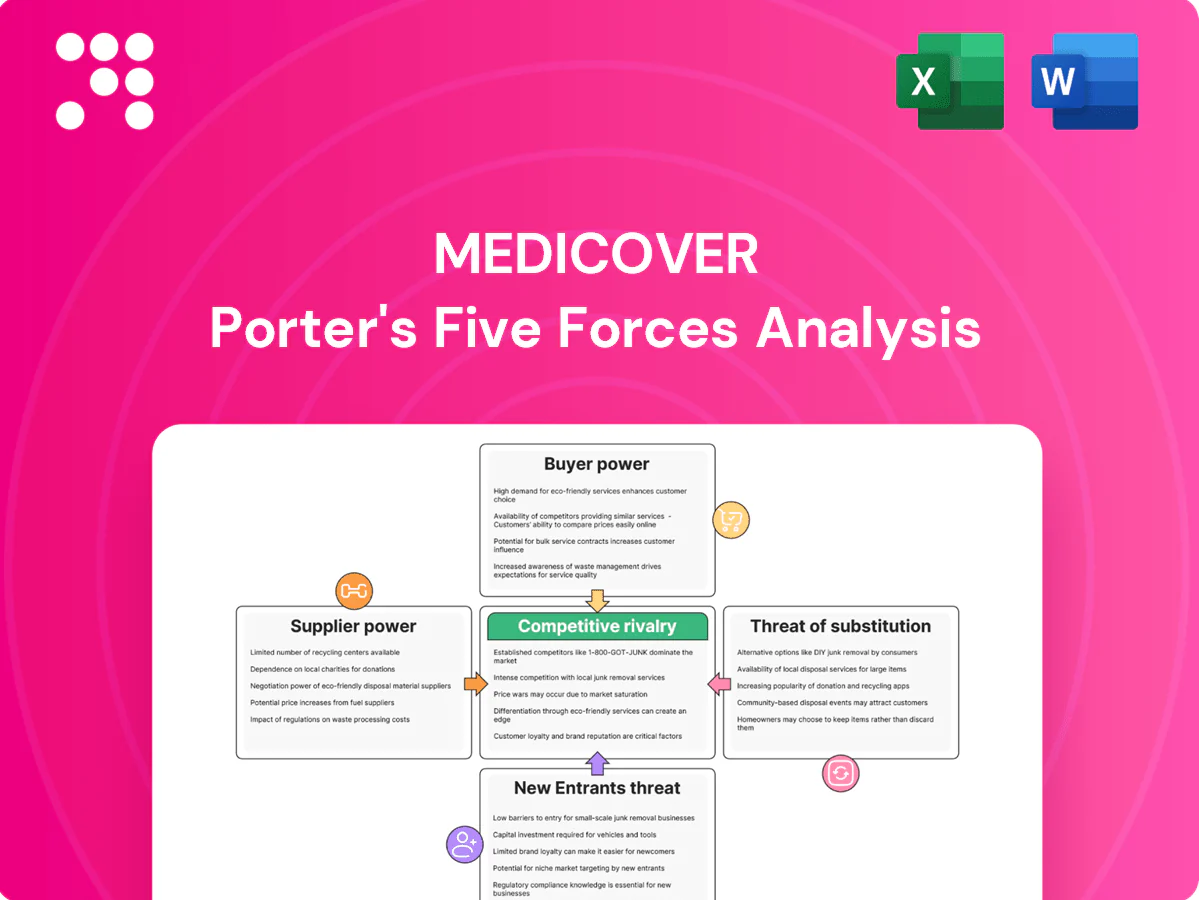
Medicover Porter's Five Forces Analysis

A Must-Have Tool for Decision-Makers
Medicover faces moderate buyer power, rising regulatory and cost pressures, and increasing competition from regional clinics and digital health entrants, while supplier leverage and substitute threats vary by market. This snapshot highlights key strategic tensions shaping growth and margins. Unlock the full Porter's Five Forces Analysis for force-by-force ratings, visuals, and actionable recommendations.
Suppliers Bargaining Power

Concentrated pharma and device vendors
Medicover depends on leading pharma and medtech firms for drugs, implants and diagnostic equipment, and supplier concentration increases switching costs and supplier leverage. Long-term volume contracts and formularies mitigate price pressure by locking supply and predictable demand. Innovation cycles and regulatory approvals keep clinically acceptable alternatives limited, reinforcing supplier power; the global medtech market was valued around $534 billion in 2024.
Specialist clinician and staff scarcity
Highly skilled physicians, radiologists and lab experts act as critical suppliers; Poland had about 2.6 physicians per 1,000 population versus an EU average near 3.8 (OECD ~2022), concentrating bargaining power in scarce specialties. Scarcity pushes specialty wage premiums and higher contract demands, while training pipelines and retention programs reduce churn but require years to scale. Geographic imbalances further tighten local labor markets, amplifying regional pay pressure and recruitment costs.

Diagnostic reagents and consumables dependence
Labs require uninterrupted supply of reagents, test kits and disposables to maintain throughput and quality, and analyzer–reagent pairing creates vendor lock-in that heightens supplier power. Dual-sourcing and inventory buffers are common mitigants, lowering disruption probability and lead-time risk. Imported inputs priced in euros or dollars expose costs to FX moves — 2024 average EUR/USD ~1.09 — which can inflate reagent costs.

Healthcare IT and interoperability lock-in
Core systems like EHR, LIS, RIS and PACS create switching frictions and integration costs, with the global EHR market estimated at about USD 40 billion in 2024 and migration/licenses consuming up to 30% of project budgets, letting vendors exert power via licenses, upgrades and data migration fees; open standards and modular architectures (FHIR, APIs) help regain leverage while cybersecurity and uptime SLAs become key negotiation levers.
- Vendor lock-in: migration/licenses can be ~30% of budgets (2024)
- Market scale: EHR market ~USD 40B (2024)
- Mitigants: FHIR/APIs, modular stacks
- Negotiation levers: SLAs for uptime, breach liability, security certifications
Facility and imaging equipment capex intensity
Facility and imaging capex for Medicover centers hinges on multi-year vendor ties as MRI units cost roughly 1–3 million USD and CT scanners 0.5–2 million USD; service contracts and parts availability (typically 8–15% of equipment value annually) drive lifetime costs. Competitive tenders and total-cost-of-ownership analyses limit supplier pricing power, while refurbished units and leasing (often 30–50% lower capex) boost procurement flexibility.
- Vendor relationships
- Service-contracts 8–15% p.a.
- MRI 1–3M, CT 0.5–2M
- TCO/tenders reduce pricing
- Refurbished/leasing -30–50%
Medtech supplier power rises: vendor lock-in, clinician scarcity, FX risk and costly equipment
Supplier power is high: concentrated medtech/pharma vendors, clinician scarcity and vendor lock-in on reagents, EHR/LIS and imaging gear raise switching costs and price leverage. Long-term contracts, dual-sourcing, tenders and leasing mitigate risk but FX exposure (EUR/USD ~1.09 in 2024) and specialized labor sustain supplier bargaining strength.
| Metric | 2024 |
|---|---|
| Global medtech market | ~USD 534B |
| EHR market | ~USD 40B |
| EUR/USD avg | ~1.09 |
| MRI cost | USD 1–3M |
| Service contracts | 8–15% p.a. |
What is included in the product
 Detailed Word Document
Comprehensive Porter's Five Forces analysis for Medicover, diagnosing competitor rivalry, buyer and supplier power, threat of new entrants and substitutes, and highlighting disruptive risks and strategic levers to defend market share and margins.

 Customizable Excel Spreadsheet
A concise Porter's Five Forces snapshot for Medicover—instantly highlight competitive pressures with a clean layout and radar chart, ready to drop into pitch decks or strategy reports to relieve analysis bottlenecks.
Customers Bargaining Power

Insurers and corporate payers negotiate hard
Third-party payers control significant patient volumes and reimbursement terms, forcing Medicover to accept bundled prices, discounts and quality-linked payments. These payers push for bundled pricing and outcome-linked contracts, compressing per-case margins. Medicover’s broad network gives counter-leverage and preferred provider status can stabilize demand but often squeezes revenue per patient.
Patients face moderate switching costs
Patients face moderate switching costs as convenience, reputation and integrated care—central to Medicover’s model—limit churn; Medicover serves over 1 million patients across Europe, reinforcing brand stickiness. Price transparency and online reviews raise buyer power in commoditized services, especially for basic consultations. Chronic and specialist care demand continuity, reducing switching, while membership plans and digital portals (over 400,000 portal users in 2024) deepen retention.

Government and public tenders exert pressure
Public payers set tariffs and clinical standards that cap pricing flexibility, while tender-based volumes—public procurement representing about 14% of EU GDP—come with tight margins and heavy compliance demands. Participation secures scale and market presence for Medicover, but policy shifts and tariff changes can rapidly alter project economics and margins.

Employer wellness and preventive packages
Corporate clients buying employer wellness and preventive packages negotiate rates (typically 10–20% off list) and push price and outcome-based terms, increasing buyer leverage; competition on price and measured outcomes intensified in 2024. Data-driven reporting and ROI proof points (commonly cited 2–3x return in industry studies) help Medicover defend pricing, while cross-selling diagnostics and primary care can raise unit revenue by about 20%.
- Negotiated discounts: 10–20%
- Typical ROI cited: 2–3x
- Cross-sell lift to unit economics: ~20%
Quality and outcomes transparency
Published KPIs, accreditations and patient satisfaction scores give buyers clear comparators, letting them demand better outcomes and value; visible outcomes in 2024 intensified buyer leverage across private healthcare markets. Continuous quality improvement is essential for Medicover to defend market share and pricing. Poor metrics can trigger rapid volume loss and payer renegotiation.
- Published KPIs
- Accreditations
- Patient satisfaction
- Outcome visibility = buyer leverage
- Continuous QI needed to retain share
- Poor metrics -> rapid volume loss
Tariffs and payers compress margins despite 1m+ patients
Third-party payers and public tariffs compress margins despite Medicover's 1m+ patients and 400k portal users (2024); negotiated discounts 10–20% and outcome-linked contracts lower per-case revenue. Corporate buyers push 10–20% off list; cross-sell lifts unit revenue ~20% and ROI claims 2–3x help defend pricing. Outcome visibility and KPIs increase buyer leverage, risking rapid volume shifts.
| Metric | Value (2024) |
|---|---|
| Patients | 1,000,000+ |
| Portal users | 400,000 |
| Negotiated discounts | 10–20% |
| Cross-sell lift | ~20% |
| ROI cited | 2–3x |
Full Version Awaits
Medicover Porter's Five Forces Analysis
This preview shows the exact Medicover Porter's Five Forces Analysis you'll receive immediately after purchase—no placeholders or mockups. The document is fully formatted, comprehensive, and ready for download and use the moment you buy. It contains the complete strategic assessment of industry forces for Medicover and requires no further setup.

A Must-Have Tool for Decision-Makers
Medicover faces moderate buyer power, rising regulatory and cost pressures, and increasing competition from regional clinics and digital health entrants, while supplier leverage and substitute threats vary by market. This snapshot highlights key strategic tensions shaping growth and margins. Unlock the full Porter's Five Forces Analysis for force-by-force ratings, visuals, and actionable recommendations.
Suppliers Bargaining Power
Concentrated pharma and device vendors
Medicover depends on leading pharma and medtech firms for drugs, implants and diagnostic equipment, and supplier concentration increases switching costs and supplier leverage. Long-term volume contracts and formularies mitigate price pressure by locking supply and predictable demand. Innovation cycles and regulatory approvals keep clinically acceptable alternatives limited, reinforcing supplier power; the global medtech market was valued around $534 billion in 2024.
Specialist clinician and staff scarcity
Highly skilled physicians, radiologists and lab experts act as critical suppliers; Poland had about 2.6 physicians per 1,000 population versus an EU average near 3.8 (OECD ~2022), concentrating bargaining power in scarce specialties. Scarcity pushes specialty wage premiums and higher contract demands, while training pipelines and retention programs reduce churn but require years to scale. Geographic imbalances further tighten local labor markets, amplifying regional pay pressure and recruitment costs.
Diagnostic reagents and consumables dependence
Labs require uninterrupted supply of reagents, test kits and disposables to maintain throughput and quality, and analyzer–reagent pairing creates vendor lock-in that heightens supplier power. Dual-sourcing and inventory buffers are common mitigants, lowering disruption probability and lead-time risk. Imported inputs priced in euros or dollars expose costs to FX moves — 2024 average EUR/USD ~1.09 — which can inflate reagent costs.
Healthcare IT and interoperability lock-in
Core systems like EHR, LIS, RIS and PACS create switching frictions and integration costs, with the global EHR market estimated at about USD 40 billion in 2024 and migration/licenses consuming up to 30% of project budgets, letting vendors exert power via licenses, upgrades and data migration fees; open standards and modular architectures (FHIR, APIs) help regain leverage while cybersecurity and uptime SLAs become key negotiation levers.
- Vendor lock-in: migration/licenses can be ~30% of budgets (2024)
- Market scale: EHR market ~USD 40B (2024)
- Mitigants: FHIR/APIs, modular stacks
- Negotiation levers: SLAs for uptime, breach liability, security certifications
Facility and imaging equipment capex intensity
Facility and imaging capex for Medicover centers hinges on multi-year vendor ties as MRI units cost roughly 1–3 million USD and CT scanners 0.5–2 million USD; service contracts and parts availability (typically 8–15% of equipment value annually) drive lifetime costs. Competitive tenders and total-cost-of-ownership analyses limit supplier pricing power, while refurbished units and leasing (often 30–50% lower capex) boost procurement flexibility.
- Vendor relationships
- Service-contracts 8–15% p.a.
- MRI 1–3M, CT 0.5–2M
- TCO/tenders reduce pricing
- Refurbished/leasing -30–50%
Medtech supplier power rises: vendor lock-in, clinician scarcity, FX risk and costly equipment
Supplier power is high: concentrated medtech/pharma vendors, clinician scarcity and vendor lock-in on reagents, EHR/LIS and imaging gear raise switching costs and price leverage. Long-term contracts, dual-sourcing, tenders and leasing mitigate risk but FX exposure (EUR/USD ~1.09 in 2024) and specialized labor sustain supplier bargaining strength.
| Metric | 2024 |
|---|---|
| Global medtech market | ~USD 534B |
| EHR market | ~USD 40B |
| EUR/USD avg | ~1.09 |
| MRI cost | USD 1–3M |
| Service contracts | 8–15% p.a. |
What is included in the product
Detailed Word Document
Comprehensive Porter's Five Forces analysis for Medicover, diagnosing competitor rivalry, buyer and supplier power, threat of new entrants and substitutes, and highlighting disruptive risks and strategic levers to defend market share and margins.
Customizable Excel Spreadsheet
A concise Porter's Five Forces snapshot for Medicover—instantly highlight competitive pressures with a clean layout and radar chart, ready to drop into pitch decks or strategy reports to relieve analysis bottlenecks.
Customers Bargaining Power
Insurers and corporate payers negotiate hard
Third-party payers control significant patient volumes and reimbursement terms, forcing Medicover to accept bundled prices, discounts and quality-linked payments. These payers push for bundled pricing and outcome-linked contracts, compressing per-case margins. Medicover’s broad network gives counter-leverage and preferred provider status can stabilize demand but often squeezes revenue per patient.
Patients face moderate switching costs
Patients face moderate switching costs as convenience, reputation and integrated care—central to Medicover’s model—limit churn; Medicover serves over 1 million patients across Europe, reinforcing brand stickiness. Price transparency and online reviews raise buyer power in commoditized services, especially for basic consultations. Chronic and specialist care demand continuity, reducing switching, while membership plans and digital portals (over 400,000 portal users in 2024) deepen retention.
Government and public tenders exert pressure
Public payers set tariffs and clinical standards that cap pricing flexibility, while tender-based volumes—public procurement representing about 14% of EU GDP—come with tight margins and heavy compliance demands. Participation secures scale and market presence for Medicover, but policy shifts and tariff changes can rapidly alter project economics and margins.
Employer wellness and preventive packages
Corporate clients buying employer wellness and preventive packages negotiate rates (typically 10–20% off list) and push price and outcome-based terms, increasing buyer leverage; competition on price and measured outcomes intensified in 2024. Data-driven reporting and ROI proof points (commonly cited 2–3x return in industry studies) help Medicover defend pricing, while cross-selling diagnostics and primary care can raise unit revenue by about 20%.
- Negotiated discounts: 10–20%
- Typical ROI cited: 2–3x
- Cross-sell lift to unit economics: ~20%
Quality and outcomes transparency
Published KPIs, accreditations and patient satisfaction scores give buyers clear comparators, letting them demand better outcomes and value; visible outcomes in 2024 intensified buyer leverage across private healthcare markets. Continuous quality improvement is essential for Medicover to defend market share and pricing. Poor metrics can trigger rapid volume loss and payer renegotiation.
- Published KPIs
- Accreditations
- Patient satisfaction
- Outcome visibility = buyer leverage
- Continuous QI needed to retain share
- Poor metrics -> rapid volume loss
Tariffs and payers compress margins despite 1m+ patients
Third-party payers and public tariffs compress margins despite Medicover's 1m+ patients and 400k portal users (2024); negotiated discounts 10–20% and outcome-linked contracts lower per-case revenue. Corporate buyers push 10–20% off list; cross-sell lifts unit revenue ~20% and ROI claims 2–3x help defend pricing. Outcome visibility and KPIs increase buyer leverage, risking rapid volume shifts.
| Metric | Value (2024) |
|---|---|
| Patients | 1,000,000+ |
| Portal users | 400,000 |
| Negotiated discounts | 10–20% |
| Cross-sell lift | ~20% |
| ROI cited | 2–3x |
Full Version Awaits
Medicover Porter's Five Forces Analysis
This preview shows the exact Medicover Porter's Five Forces Analysis you'll receive immediately after purchase—no placeholders or mockups. The document is fully formatted, comprehensive, and ready for download and use the moment you buy. It contains the complete strategic assessment of industry forces for Medicover and requires no further setup.
Description
A Must-Have Tool for Decision-Makers
Medicover faces moderate buyer power, rising regulatory and cost pressures, and increasing competition from regional clinics and digital health entrants, while supplier leverage and substitute threats vary by market. This snapshot highlights key strategic tensions shaping growth and margins. Unlock the full Porter's Five Forces Analysis for force-by-force ratings, visuals, and actionable recommendations.
Suppliers Bargaining Power
Concentrated pharma and device vendors
Medicover depends on leading pharma and medtech firms for drugs, implants and diagnostic equipment, and supplier concentration increases switching costs and supplier leverage. Long-term volume contracts and formularies mitigate price pressure by locking supply and predictable demand. Innovation cycles and regulatory approvals keep clinically acceptable alternatives limited, reinforcing supplier power; the global medtech market was valued around $534 billion in 2024.
Specialist clinician and staff scarcity
Highly skilled physicians, radiologists and lab experts act as critical suppliers; Poland had about 2.6 physicians per 1,000 population versus an EU average near 3.8 (OECD ~2022), concentrating bargaining power in scarce specialties. Scarcity pushes specialty wage premiums and higher contract demands, while training pipelines and retention programs reduce churn but require years to scale. Geographic imbalances further tighten local labor markets, amplifying regional pay pressure and recruitment costs.
Diagnostic reagents and consumables dependence
Labs require uninterrupted supply of reagents, test kits and disposables to maintain throughput and quality, and analyzer–reagent pairing creates vendor lock-in that heightens supplier power. Dual-sourcing and inventory buffers are common mitigants, lowering disruption probability and lead-time risk. Imported inputs priced in euros or dollars expose costs to FX moves — 2024 average EUR/USD ~1.09 — which can inflate reagent costs.
Healthcare IT and interoperability lock-in
Core systems like EHR, LIS, RIS and PACS create switching frictions and integration costs, with the global EHR market estimated at about USD 40 billion in 2024 and migration/licenses consuming up to 30% of project budgets, letting vendors exert power via licenses, upgrades and data migration fees; open standards and modular architectures (FHIR, APIs) help regain leverage while cybersecurity and uptime SLAs become key negotiation levers.
- Vendor lock-in: migration/licenses can be ~30% of budgets (2024)
- Market scale: EHR market ~USD 40B (2024)
- Mitigants: FHIR/APIs, modular stacks
- Negotiation levers: SLAs for uptime, breach liability, security certifications
Facility and imaging equipment capex intensity
Facility and imaging capex for Medicover centers hinges on multi-year vendor ties as MRI units cost roughly 1–3 million USD and CT scanners 0.5–2 million USD; service contracts and parts availability (typically 8–15% of equipment value annually) drive lifetime costs. Competitive tenders and total-cost-of-ownership analyses limit supplier pricing power, while refurbished units and leasing (often 30–50% lower capex) boost procurement flexibility.
- Vendor relationships
- Service-contracts 8–15% p.a.
- MRI 1–3M, CT 0.5–2M
- TCO/tenders reduce pricing
- Refurbished/leasing -30–50%
Medtech supplier power rises: vendor lock-in, clinician scarcity, FX risk and costly equipment
Supplier power is high: concentrated medtech/pharma vendors, clinician scarcity and vendor lock-in on reagents, EHR/LIS and imaging gear raise switching costs and price leverage. Long-term contracts, dual-sourcing, tenders and leasing mitigate risk but FX exposure (EUR/USD ~1.09 in 2024) and specialized labor sustain supplier bargaining strength.
| Metric | 2024 |
|---|---|
| Global medtech market | ~USD 534B |
| EHR market | ~USD 40B |
| EUR/USD avg | ~1.09 |
| MRI cost | USD 1–3M |
| Service contracts | 8–15% p.a. |
What is included in the product
Detailed Word Document
Comprehensive Porter's Five Forces analysis for Medicover, diagnosing competitor rivalry, buyer and supplier power, threat of new entrants and substitutes, and highlighting disruptive risks and strategic levers to defend market share and margins.
Customizable Excel Spreadsheet
A concise Porter's Five Forces snapshot for Medicover—instantly highlight competitive pressures with a clean layout and radar chart, ready to drop into pitch decks or strategy reports to relieve analysis bottlenecks.
Customers Bargaining Power
Insurers and corporate payers negotiate hard
Third-party payers control significant patient volumes and reimbursement terms, forcing Medicover to accept bundled prices, discounts and quality-linked payments. These payers push for bundled pricing and outcome-linked contracts, compressing per-case margins. Medicover’s broad network gives counter-leverage and preferred provider status can stabilize demand but often squeezes revenue per patient.
Patients face moderate switching costs
Patients face moderate switching costs as convenience, reputation and integrated care—central to Medicover’s model—limit churn; Medicover serves over 1 million patients across Europe, reinforcing brand stickiness. Price transparency and online reviews raise buyer power in commoditized services, especially for basic consultations. Chronic and specialist care demand continuity, reducing switching, while membership plans and digital portals (over 400,000 portal users in 2024) deepen retention.
Government and public tenders exert pressure
Public payers set tariffs and clinical standards that cap pricing flexibility, while tender-based volumes—public procurement representing about 14% of EU GDP—come with tight margins and heavy compliance demands. Participation secures scale and market presence for Medicover, but policy shifts and tariff changes can rapidly alter project economics and margins.
Employer wellness and preventive packages
Corporate clients buying employer wellness and preventive packages negotiate rates (typically 10–20% off list) and push price and outcome-based terms, increasing buyer leverage; competition on price and measured outcomes intensified in 2024. Data-driven reporting and ROI proof points (commonly cited 2–3x return in industry studies) help Medicover defend pricing, while cross-selling diagnostics and primary care can raise unit revenue by about 20%.
- Negotiated discounts: 10–20%
- Typical ROI cited: 2–3x
- Cross-sell lift to unit economics: ~20%
Quality and outcomes transparency
Published KPIs, accreditations and patient satisfaction scores give buyers clear comparators, letting them demand better outcomes and value; visible outcomes in 2024 intensified buyer leverage across private healthcare markets. Continuous quality improvement is essential for Medicover to defend market share and pricing. Poor metrics can trigger rapid volume loss and payer renegotiation.
- Published KPIs
- Accreditations
- Patient satisfaction
- Outcome visibility = buyer leverage
- Continuous QI needed to retain share
- Poor metrics -> rapid volume loss
Tariffs and payers compress margins despite 1m+ patients
Third-party payers and public tariffs compress margins despite Medicover's 1m+ patients and 400k portal users (2024); negotiated discounts 10–20% and outcome-linked contracts lower per-case revenue. Corporate buyers push 10–20% off list; cross-sell lifts unit revenue ~20% and ROI claims 2–3x help defend pricing. Outcome visibility and KPIs increase buyer leverage, risking rapid volume shifts.
| Metric | Value (2024) |
|---|---|
| Patients | 1,000,000+ |
| Portal users | 400,000 |
| Negotiated discounts | 10–20% |
| Cross-sell lift | ~20% |
| ROI cited | 2–3x |
Full Version Awaits
Medicover Porter's Five Forces Analysis
This preview shows the exact Medicover Porter's Five Forces Analysis you'll receive immediately after purchase—no placeholders or mockups. The document is fully formatted, comprehensive, and ready for download and use the moment you buy. It contains the complete strategic assessment of industry forces for Medicover and requires no further setup.











