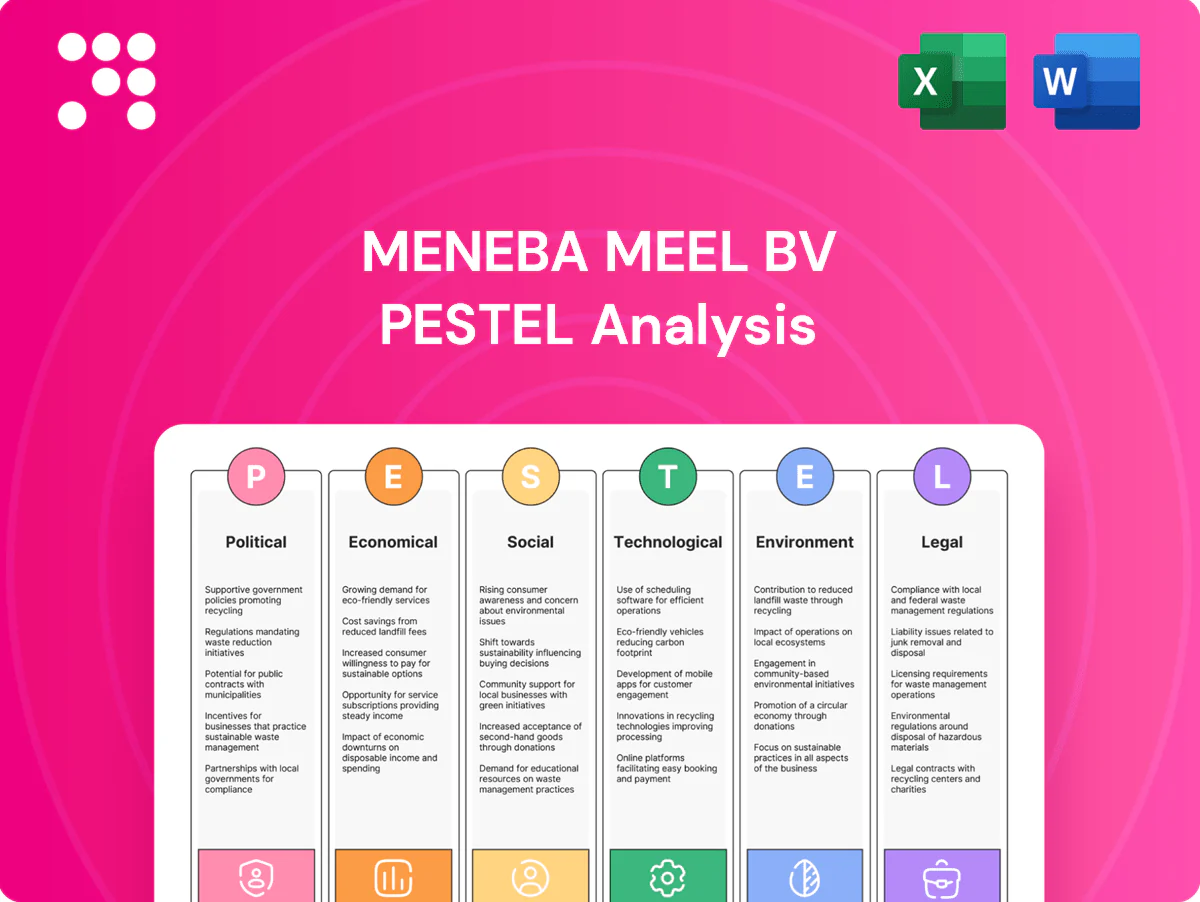
Meneba Meel BV PESTLE Analysis

Your Competitive Advantage Starts with This Report
Unlock strategic clarity with our PESTLE Analysis of Meneba Meel BV—three to five focused insights on political, economic, social, technological, legal, and environmental forces shaping the business. Use this concise briefing to spot risks and opportunities fast. Ideal for investors, advisors, and strategists seeking ready-to-use intelligence. Purchase the full analysis for the complete, actionable breakdown and downloadable templates.
Political factors

EU CAP and grain policy
EU Common Agricultural Policy 2021–2027 allocates about €386.6 billion, with mandatory eco‑schemes and greening rules influencing wheat area, yields and quality classes available to millers. Shifts to eco‑schemes have tightened supply of specific bread‑making wheats as EU soft wheat output was about 117 million tonnes in 2023. Meneba must align sourcing with evolving subsidy structures and engage growers and co‑ops to mitigate policy-driven volatility.
Trade tariffs and import quotas
EU trade measures on wheat, flour and enzymes affect input costs and availability, especially as Russia and Ukraine account for about 30% of global wheat exports; Black Sea corridor disruptions have historically re‑routed flows and raised premiums. Meneba benefits from diversified origins and contingency contracts to smooth supply; close monitoring of DG Trade updates is critical for tariff and quota changes.

Energy and industrial policy
EU and national energy policies—notably an EU ETS carbon price around €85–95/ton in 2024–H1 2025 plus subsidies and occasional gas price interventions—directly raise milling electricity and gas costs. Incentives for electrification and efficiency upgrades improve Meneba Meel BV’s competitiveness by lowering operational kWh and fuel use. Meneba can secure grants for heat recovery systems and variable speed drives to cut energy intensity. Policy stability determines timing of CAPEX on these measures.

Transport and infrastructure regulation
Transport and infrastructure regulation shapes Meneba Meel BV logistics: EU inland freight is 74.7% road and 17.2% rail (Eurostat 2022), Mobility Package cabotage limits (max 3 operations in 7 days) and driver rules (9h daily, 10h twice weekly) affect inbound grain/outbound flour flows; road tolls and rail access charges raise unit costs, prompting multi‑modal solutions, regional hubs and partner advocacy to reduce policy friction.
- Modal share: road 74.7%, rail 17.2% (Eurostat 2022)
- Cabotage: max 3 ops/7 days; driver limits 9h/10h
- Higher tolls/rail charges increase logistics unit costs
- Multi‑modal hubs + advocacy with carriers mitigate disruption
Food security priorities
Governments often prioritize domestic availability during shocks, as seen after 2022 Russia–Ukraine disruptions and India's 2023 rice export curbs (India ~40% of global rice exports), altering export rules and stock policies. Strategic reserves and emergency measures can move prices; global cereal stocks-to-use ratio was about 29.7% in 2023/24 on ~2.8 billion tonnes production. Meneba should keep risk buffers, flexible formulations and transparent ties with authorities to preserve supply and pricing resilience.
- policy: export curbs impact volumes
- reserves: stocks-to-use ~29.7%
- strategy: maintain buffers & flexible blends
- engagement: transparent govt collaboration
CAP €386.6bn reshapes wheat mix; EU 117 Mt, ETS €85-95/t, S/U 29.7%
CAP €386.6bn (2021–27) shifts wheat mix; EU soft wheat 117 Mt (2023) and Russia+Ukraine ≈30% exports force sourcing flexibility. EU ETS ~€85–95/t (2024–H1 2025) raises energy costs but funds efficiency. Transport road 74.7%/rail 17.2% (Eurostat 2022); stocks-to-use ~29.7% (2023/24) necessitate buffers.
| Metric | Value |
|---|---|
| CAP | €386.6bn |
| EU wheat | 117 Mt (2023) |
| ETS | €85–95/t |
What is included in the product
 Detailed Word Document
Explores how Political, Economic, Social, Technological, Environmental and Legal forces uniquely impact Meneba Meel BV’s milling and ingredient business, with data-backed trends and region-specific examples to highlight risks and opportunities. Designed for executives and investors, the analysis offers forward-looking insights and formatted outputs ready for plans, decks, or scenario planning.

 Customizable Excel Spreadsheet
Relieves the pain of lengthy reports by providing a concise, visually segmented PESTLE summary of Meneba Meel BV that’s easy to drop into presentations, share across teams, and drive focused discussions on regulatory shifts, supply-chain risks, market trends and strategic positioning.
Economic factors

Wheat price volatility
Global crop cycles, weather extremes and geopolitics drove wheat prices to spike in 2022 (FAO Cereal Price Index rose ~38%) and remain highly volatile, affecting basis and margins. Margin management requires dynamic hedging and customer pass‑through; Meneba can offer indexed contracts to stabilise relationships while procurement agility protects contribution margins.
Energy and logistics inflation
Power, gas and transport costs are key milling inputs that can compress processing spreads as energy-driven cost spikes raise per-ton margins for Meneba Meel BV.
Surcharges and fuel clauses enable partial pass-through of short-term spikes but tend to suppress demand elasticity in the wider supply chain.
Efficiency measures, load-shifting and long-term PPAs are critical risk-reduction levers to cap energy exposure and stabilise margins.

Bakery sector demand cycles
Industrial and artisan bakery volumes closely follow consumer spending and foodservice recovery, with European foodservice reaching roughly 95% of 2019 activity by 2023, driving volume growth; private label penetration in Western Europe approaches one-third of loaf and pastry retail sales, pressuring prices while premium and craft niches grow 4–6% annually; Meneba can tailor SKUs across cost‑optimized and specialty ranges and use joint forecasting to smooth production and cut waste.

Currency and interest rates
EUR traded near 1.09 vs USD in July 2025, shifting import parity on wheat and enzymes and altering landed costs; ECB policy at about 4.00% vs Fed funds ~5.25% raised working capital charges and tightened margins. Higher financing costs force stricter customer credit terms and sharpen need for disciplined FX and credit risk management across procurement and sales.
- FX exposure: EUR/USD ~1.09
- Rates: ECB ~4.00%, Fed ~5.25%
- Impact: higher landed wheat/enzyme costs
- Focus: FX hedging, credit controls
- Value drivers: inventory turns, receivables control
Consolidation and buyer power
Large baking groups increasingly consolidate purchasing and demand strict service-level guarantees, driving tougher price negotiations and compliance; the global bakery ingredients market was valued at about USD 32.2 billion in 2023, amplifying buyer leverage across supply chains.
Meneba can protect margin by offering technical support, co‑development of tailored flours and traceability services, and by diversifying sales into adjacent food processors to reduce dependence on large bakers.
- Buyer concentration: raises pricing pressure and SLA demands
- Defense: technical support and co‑development strengthen value
- Diversification: entry into adjacent processors lowers concentration risk
CAP €386.6bn reshapes wheat mix; EU 117 Mt, ETS €85-95/t, S/U 29.7%
Wheat-price volatility (FAO Cereal Index +38% in 2022) and energy costs drive margin swings; dynamic hedging and indexed contracts stabilize margins. EUR/USD ~1.09 and ECB ~4.00% (Fed ~5.25%) raise landed costs and working‑capital charges. Demand shifts—private label ~33%—pressure prices while premium niches grow ~5% pa; diversification and technical services protect value.
| Metric | Value |
|---|---|
| EUR/USD | 1.09 |
| ECB rate | 4.00% |
| FAO cereal shock | +38% (2022) |
What You See Is What You Get
Meneba Meel BV PESTLE Analysis
The Meneba Meel BV PESTLE Analysis preview shown here is the exact document you’ll receive after purchase, fully formatted and ready to use. This is a real screenshot of the product—no placeholders or teasers, delivering the full, professionally structured file. After payment you’ll be able to download this identical final document immediately.

Your Competitive Advantage Starts with This Report
Unlock strategic clarity with our PESTLE Analysis of Meneba Meel BV—three to five focused insights on political, economic, social, technological, legal, and environmental forces shaping the business. Use this concise briefing to spot risks and opportunities fast. Ideal for investors, advisors, and strategists seeking ready-to-use intelligence. Purchase the full analysis for the complete, actionable breakdown and downloadable templates.
Political factors
EU CAP and grain policy
EU Common Agricultural Policy 2021–2027 allocates about €386.6 billion, with mandatory eco‑schemes and greening rules influencing wheat area, yields and quality classes available to millers. Shifts to eco‑schemes have tightened supply of specific bread‑making wheats as EU soft wheat output was about 117 million tonnes in 2023. Meneba must align sourcing with evolving subsidy structures and engage growers and co‑ops to mitigate policy-driven volatility.
Trade tariffs and import quotas
EU trade measures on wheat, flour and enzymes affect input costs and availability, especially as Russia and Ukraine account for about 30% of global wheat exports; Black Sea corridor disruptions have historically re‑routed flows and raised premiums. Meneba benefits from diversified origins and contingency contracts to smooth supply; close monitoring of DG Trade updates is critical for tariff and quota changes.
Energy and industrial policy
EU and national energy policies—notably an EU ETS carbon price around €85–95/ton in 2024–H1 2025 plus subsidies and occasional gas price interventions—directly raise milling electricity and gas costs. Incentives for electrification and efficiency upgrades improve Meneba Meel BV’s competitiveness by lowering operational kWh and fuel use. Meneba can secure grants for heat recovery systems and variable speed drives to cut energy intensity. Policy stability determines timing of CAPEX on these measures.
Transport and infrastructure regulation
Transport and infrastructure regulation shapes Meneba Meel BV logistics: EU inland freight is 74.7% road and 17.2% rail (Eurostat 2022), Mobility Package cabotage limits (max 3 operations in 7 days) and driver rules (9h daily, 10h twice weekly) affect inbound grain/outbound flour flows; road tolls and rail access charges raise unit costs, prompting multi‑modal solutions, regional hubs and partner advocacy to reduce policy friction.
- Modal share: road 74.7%, rail 17.2% (Eurostat 2022)
- Cabotage: max 3 ops/7 days; driver limits 9h/10h
- Higher tolls/rail charges increase logistics unit costs
- Multi‑modal hubs + advocacy with carriers mitigate disruption
Food security priorities
Governments often prioritize domestic availability during shocks, as seen after 2022 Russia–Ukraine disruptions and India's 2023 rice export curbs (India ~40% of global rice exports), altering export rules and stock policies. Strategic reserves and emergency measures can move prices; global cereal stocks-to-use ratio was about 29.7% in 2023/24 on ~2.8 billion tonnes production. Meneba should keep risk buffers, flexible formulations and transparent ties with authorities to preserve supply and pricing resilience.
- policy: export curbs impact volumes
- reserves: stocks-to-use ~29.7%
- strategy: maintain buffers & flexible blends
- engagement: transparent govt collaboration
CAP €386.6bn reshapes wheat mix; EU 117 Mt, ETS €85-95/t, S/U 29.7%
CAP €386.6bn (2021–27) shifts wheat mix; EU soft wheat 117 Mt (2023) and Russia+Ukraine ≈30% exports force sourcing flexibility. EU ETS ~€85–95/t (2024–H1 2025) raises energy costs but funds efficiency. Transport road 74.7%/rail 17.2% (Eurostat 2022); stocks-to-use ~29.7% (2023/24) necessitate buffers.
| Metric | Value |
|---|---|
| CAP | €386.6bn |
| EU wheat | 117 Mt (2023) |
| ETS | €85–95/t |
What is included in the product
Detailed Word Document
Explores how Political, Economic, Social, Technological, Environmental and Legal forces uniquely impact Meneba Meel BV’s milling and ingredient business, with data-backed trends and region-specific examples to highlight risks and opportunities. Designed for executives and investors, the analysis offers forward-looking insights and formatted outputs ready for plans, decks, or scenario planning.
Customizable Excel Spreadsheet
Relieves the pain of lengthy reports by providing a concise, visually segmented PESTLE summary of Meneba Meel BV that’s easy to drop into presentations, share across teams, and drive focused discussions on regulatory shifts, supply-chain risks, market trends and strategic positioning.
Economic factors
Wheat price volatility
Global crop cycles, weather extremes and geopolitics drove wheat prices to spike in 2022 (FAO Cereal Price Index rose ~38%) and remain highly volatile, affecting basis and margins. Margin management requires dynamic hedging and customer pass‑through; Meneba can offer indexed contracts to stabilise relationships while procurement agility protects contribution margins.
Energy and logistics inflation
Power, gas and transport costs are key milling inputs that can compress processing spreads as energy-driven cost spikes raise per-ton margins for Meneba Meel BV.
Surcharges and fuel clauses enable partial pass-through of short-term spikes but tend to suppress demand elasticity in the wider supply chain.
Efficiency measures, load-shifting and long-term PPAs are critical risk-reduction levers to cap energy exposure and stabilise margins.
Bakery sector demand cycles
Industrial and artisan bakery volumes closely follow consumer spending and foodservice recovery, with European foodservice reaching roughly 95% of 2019 activity by 2023, driving volume growth; private label penetration in Western Europe approaches one-third of loaf and pastry retail sales, pressuring prices while premium and craft niches grow 4–6% annually; Meneba can tailor SKUs across cost‑optimized and specialty ranges and use joint forecasting to smooth production and cut waste.
Currency and interest rates
EUR traded near 1.09 vs USD in July 2025, shifting import parity on wheat and enzymes and altering landed costs; ECB policy at about 4.00% vs Fed funds ~5.25% raised working capital charges and tightened margins. Higher financing costs force stricter customer credit terms and sharpen need for disciplined FX and credit risk management across procurement and sales.
- FX exposure: EUR/USD ~1.09
- Rates: ECB ~4.00%, Fed ~5.25%
- Impact: higher landed wheat/enzyme costs
- Focus: FX hedging, credit controls
- Value drivers: inventory turns, receivables control
Consolidation and buyer power
Large baking groups increasingly consolidate purchasing and demand strict service-level guarantees, driving tougher price negotiations and compliance; the global bakery ingredients market was valued at about USD 32.2 billion in 2023, amplifying buyer leverage across supply chains.
Meneba can protect margin by offering technical support, co‑development of tailored flours and traceability services, and by diversifying sales into adjacent food processors to reduce dependence on large bakers.
- Buyer concentration: raises pricing pressure and SLA demands
- Defense: technical support and co‑development strengthen value
- Diversification: entry into adjacent processors lowers concentration risk
CAP €386.6bn reshapes wheat mix; EU 117 Mt, ETS €85-95/t, S/U 29.7%
Wheat-price volatility (FAO Cereal Index +38% in 2022) and energy costs drive margin swings; dynamic hedging and indexed contracts stabilize margins. EUR/USD ~1.09 and ECB ~4.00% (Fed ~5.25%) raise landed costs and working‑capital charges. Demand shifts—private label ~33%—pressure prices while premium niches grow ~5% pa; diversification and technical services protect value.
| Metric | Value |
|---|---|
| EUR/USD | 1.09 |
| ECB rate | 4.00% |
| FAO cereal shock | +38% (2022) |
What You See Is What You Get
Meneba Meel BV PESTLE Analysis
The Meneba Meel BV PESTLE Analysis preview shown here is the exact document you’ll receive after purchase, fully formatted and ready to use. This is a real screenshot of the product—no placeholders or teasers, delivering the full, professionally structured file. After payment you’ll be able to download this identical final document immediately.
Original: $10.00
-65%$10.00
$3.50Description
Your Competitive Advantage Starts with This Report
Unlock strategic clarity with our PESTLE Analysis of Meneba Meel BV—three to five focused insights on political, economic, social, technological, legal, and environmental forces shaping the business. Use this concise briefing to spot risks and opportunities fast. Ideal for investors, advisors, and strategists seeking ready-to-use intelligence. Purchase the full analysis for the complete, actionable breakdown and downloadable templates.
Political factors
EU CAP and grain policy
EU Common Agricultural Policy 2021–2027 allocates about €386.6 billion, with mandatory eco‑schemes and greening rules influencing wheat area, yields and quality classes available to millers. Shifts to eco‑schemes have tightened supply of specific bread‑making wheats as EU soft wheat output was about 117 million tonnes in 2023. Meneba must align sourcing with evolving subsidy structures and engage growers and co‑ops to mitigate policy-driven volatility.
Trade tariffs and import quotas
EU trade measures on wheat, flour and enzymes affect input costs and availability, especially as Russia and Ukraine account for about 30% of global wheat exports; Black Sea corridor disruptions have historically re‑routed flows and raised premiums. Meneba benefits from diversified origins and contingency contracts to smooth supply; close monitoring of DG Trade updates is critical for tariff and quota changes.
Energy and industrial policy
EU and national energy policies—notably an EU ETS carbon price around €85–95/ton in 2024–H1 2025 plus subsidies and occasional gas price interventions—directly raise milling electricity and gas costs. Incentives for electrification and efficiency upgrades improve Meneba Meel BV’s competitiveness by lowering operational kWh and fuel use. Meneba can secure grants for heat recovery systems and variable speed drives to cut energy intensity. Policy stability determines timing of CAPEX on these measures.
Transport and infrastructure regulation
Transport and infrastructure regulation shapes Meneba Meel BV logistics: EU inland freight is 74.7% road and 17.2% rail (Eurostat 2022), Mobility Package cabotage limits (max 3 operations in 7 days) and driver rules (9h daily, 10h twice weekly) affect inbound grain/outbound flour flows; road tolls and rail access charges raise unit costs, prompting multi‑modal solutions, regional hubs and partner advocacy to reduce policy friction.
- Modal share: road 74.7%, rail 17.2% (Eurostat 2022)
- Cabotage: max 3 ops/7 days; driver limits 9h/10h
- Higher tolls/rail charges increase logistics unit costs
- Multi‑modal hubs + advocacy with carriers mitigate disruption
Food security priorities
Governments often prioritize domestic availability during shocks, as seen after 2022 Russia–Ukraine disruptions and India's 2023 rice export curbs (India ~40% of global rice exports), altering export rules and stock policies. Strategic reserves and emergency measures can move prices; global cereal stocks-to-use ratio was about 29.7% in 2023/24 on ~2.8 billion tonnes production. Meneba should keep risk buffers, flexible formulations and transparent ties with authorities to preserve supply and pricing resilience.
- policy: export curbs impact volumes
- reserves: stocks-to-use ~29.7%
- strategy: maintain buffers & flexible blends
- engagement: transparent govt collaboration
CAP €386.6bn reshapes wheat mix; EU 117 Mt, ETS €85-95/t, S/U 29.7%
CAP €386.6bn (2021–27) shifts wheat mix; EU soft wheat 117 Mt (2023) and Russia+Ukraine ≈30% exports force sourcing flexibility. EU ETS ~€85–95/t (2024–H1 2025) raises energy costs but funds efficiency. Transport road 74.7%/rail 17.2% (Eurostat 2022); stocks-to-use ~29.7% (2023/24) necessitate buffers.
| Metric | Value |
|---|---|
| CAP | €386.6bn |
| EU wheat | 117 Mt (2023) |
| ETS | €85–95/t |
What is included in the product
Detailed Word Document
Explores how Political, Economic, Social, Technological, Environmental and Legal forces uniquely impact Meneba Meel BV’s milling and ingredient business, with data-backed trends and region-specific examples to highlight risks and opportunities. Designed for executives and investors, the analysis offers forward-looking insights and formatted outputs ready for plans, decks, or scenario planning.
Customizable Excel Spreadsheet
Relieves the pain of lengthy reports by providing a concise, visually segmented PESTLE summary of Meneba Meel BV that’s easy to drop into presentations, share across teams, and drive focused discussions on regulatory shifts, supply-chain risks, market trends and strategic positioning.
Economic factors
Wheat price volatility
Global crop cycles, weather extremes and geopolitics drove wheat prices to spike in 2022 (FAO Cereal Price Index rose ~38%) and remain highly volatile, affecting basis and margins. Margin management requires dynamic hedging and customer pass‑through; Meneba can offer indexed contracts to stabilise relationships while procurement agility protects contribution margins.
Energy and logistics inflation
Power, gas and transport costs are key milling inputs that can compress processing spreads as energy-driven cost spikes raise per-ton margins for Meneba Meel BV.
Surcharges and fuel clauses enable partial pass-through of short-term spikes but tend to suppress demand elasticity in the wider supply chain.
Efficiency measures, load-shifting and long-term PPAs are critical risk-reduction levers to cap energy exposure and stabilise margins.
Bakery sector demand cycles
Industrial and artisan bakery volumes closely follow consumer spending and foodservice recovery, with European foodservice reaching roughly 95% of 2019 activity by 2023, driving volume growth; private label penetration in Western Europe approaches one-third of loaf and pastry retail sales, pressuring prices while premium and craft niches grow 4–6% annually; Meneba can tailor SKUs across cost‑optimized and specialty ranges and use joint forecasting to smooth production and cut waste.
Currency and interest rates
EUR traded near 1.09 vs USD in July 2025, shifting import parity on wheat and enzymes and altering landed costs; ECB policy at about 4.00% vs Fed funds ~5.25% raised working capital charges and tightened margins. Higher financing costs force stricter customer credit terms and sharpen need for disciplined FX and credit risk management across procurement and sales.
- FX exposure: EUR/USD ~1.09
- Rates: ECB ~4.00%, Fed ~5.25%
- Impact: higher landed wheat/enzyme costs
- Focus: FX hedging, credit controls
- Value drivers: inventory turns, receivables control
Consolidation and buyer power
Large baking groups increasingly consolidate purchasing and demand strict service-level guarantees, driving tougher price negotiations and compliance; the global bakery ingredients market was valued at about USD 32.2 billion in 2023, amplifying buyer leverage across supply chains.
Meneba can protect margin by offering technical support, co‑development of tailored flours and traceability services, and by diversifying sales into adjacent food processors to reduce dependence on large bakers.
- Buyer concentration: raises pricing pressure and SLA demands
- Defense: technical support and co‑development strengthen value
- Diversification: entry into adjacent processors lowers concentration risk
CAP €386.6bn reshapes wheat mix; EU 117 Mt, ETS €85-95/t, S/U 29.7%
Wheat-price volatility (FAO Cereal Index +38% in 2022) and energy costs drive margin swings; dynamic hedging and indexed contracts stabilize margins. EUR/USD ~1.09 and ECB ~4.00% (Fed ~5.25%) raise landed costs and working‑capital charges. Demand shifts—private label ~33%—pressure prices while premium niches grow ~5% pa; diversification and technical services protect value.
| Metric | Value |
|---|---|
| EUR/USD | 1.09 |
| ECB rate | 4.00% |
| FAO cereal shock | +38% (2022) |
What You See Is What You Get
Meneba Meel BV PESTLE Analysis
The Meneba Meel BV PESTLE Analysis preview shown here is the exact document you’ll receive after purchase, fully formatted and ready to use. This is a real screenshot of the product—no placeholders or teasers, delivering the full, professionally structured file. After payment you’ll be able to download this identical final document immediately.











