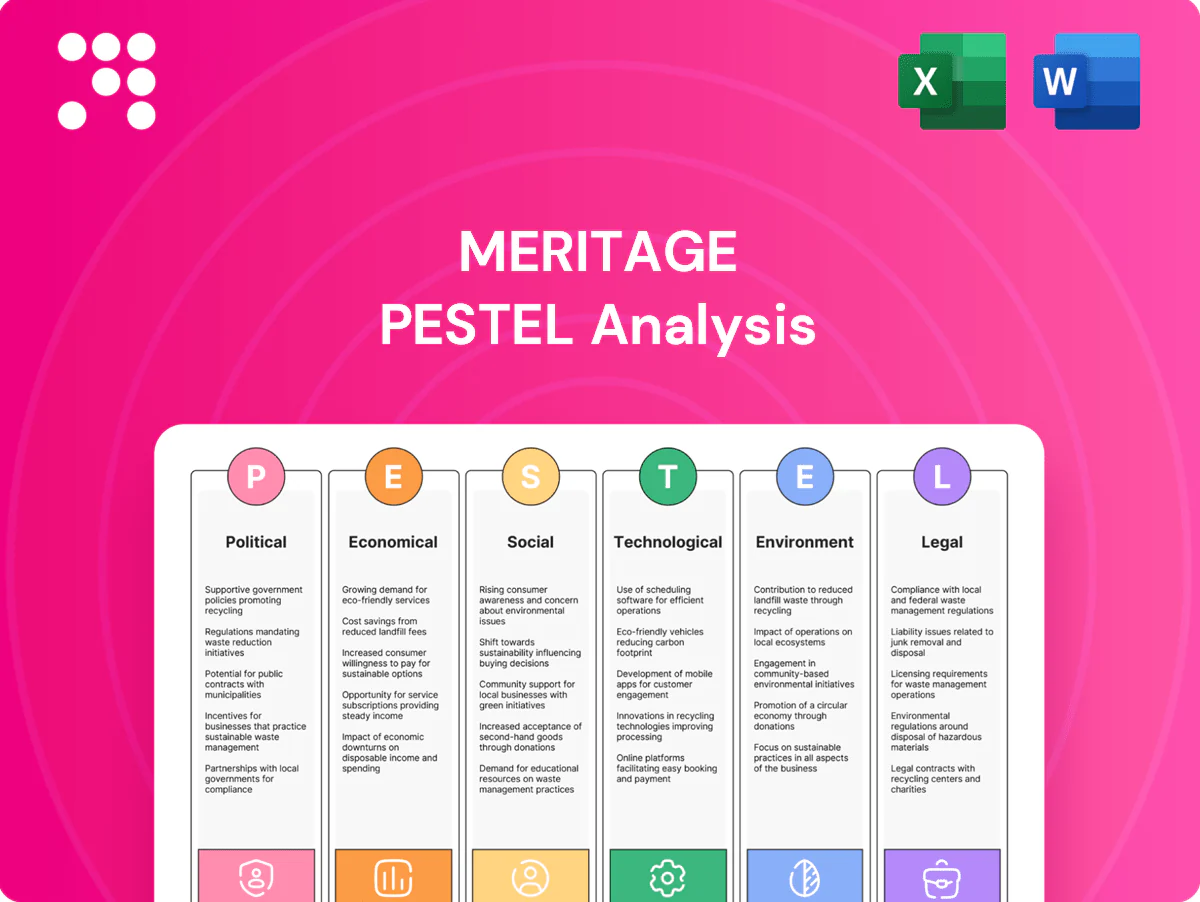
Meritage PESTLE Analysis

Make Smarter Strategic Decisions with a Complete PESTEL View
Discover how political, economic, social, technological, legal, and environmental forces are shaping Meritage's strategic path in our concise PESTLE summary. This snapshot highlights key risks and opportunities investors and managers need now. For detailed data, scenarios, and actionable recommendations, purchase the full PESTLE analysis and get immediate, ready-to-use insights.
Political factors

Minimum wage policy
Federal minimum wage remains $7.25/hr while states such as California ($16.00/hr) and New York ($15.00/hr) raise labor floors, directly increasing store-level labor costs and pressuring pricing. Multi-state operations add complexity as rates and rollout timelines differ. Meritage must optimize staffing models and productivity to preserve margins and offset ~25–35% labor share typical in retail. Proactive lobbying and scenario planning reduce policy shocks.
Labor regulation shifts
Recent NLRB shifts and growing predictive-scheduling laws expand joint-employer liability and administrative burden for franchisors, elevating exposure across the Meritage franchise system; the franchise sector employed 8.4 million workers (≈6% of private-sector employment) per IFA 2024. Franchise operators may face greater responsibility for franchise-wide labor practices, making robust compliance systems and training critical, while strategic workforce technology helps document adherence and reduce legal risk.

Permits and zoning
Local approvals for new builds, drive-thrus and remodels directly shape Meritage’s growth cadence by determining start dates and sales velocity, with politically driven traffic and noise concerns able to delay openings. Early community engagement statistically reduces opposition and shortens approval timelines. Diversifying the real estate pipeline across jurisdictions spreads permitting risk and smooths quarterly delivery variability.

Food policy and subsidies
Food policy and subsidies—through agricultural supports, SNAP (about 41 million monthly participants in FY2024) and school meal programs (NSLP ~4.8 billion lunches in 2022–23)—shape demand and input costs for beef, dairy and produce. Federal or state policy shifts can move wholesale prices and margins, impacting menu costs. Active monitoring of USDA and state actions informs purchasing and hedging; menu engineering and price-mix changes can offset volatility.
- Ag supports affect input costs
- SNAP ~41M monthly; NSLP ~4.8B lunches
- Monitor USDA/state rules for sourcing
- Menu engineering offsets price swings
Trade and tariffs
Tariffs on commodities, packaging and kitchen equipment can raise COGS and capex by roughly 2–15%, with episodic spikes; 2024 US-China trade frictions correlated with reported component lead-time increases near 20% for foodservice suppliers.
Shifts in trade relations compress supply certainty and extend lead times; hedging, multi-sourcing and inland inventory buffers reduce disruption, while vendor contracts must include clear price-adjustment and passthrough clauses.
- Impact range: 2–15% added COGS/capex
- 2024 lead-time increase: ~20% for some components
- Mitigation: hedging, multi-sourcing, inventory
- Contract focus: price-adjustment clarity
Labor, compliance and supply shocks raise costs; hedging, multisourcing and automation mitigate
Rising state minimums (federal $7.25; CA $16; NY $15), expanded NLRB/franchise liability, permitting delays and food policy (SNAP ~41M; NSLP ~4.8B lunches) increase labor, compliance and input risk; tariffs/2024 supply frictions raised COGS/capex 2–15% and some lead times ~20%; hedging, multi-sourcing and compliance systems mitigate.
| Issue | Impact | 2024 Data | Mitigation |
|---|---|---|---|
| Wages | Higher labor cost | CA $16; NY $15; fed $7.25 | Staff optimization |
| Franchise liability | Legal/admin burden | Franchise workforce 8.4M (IFA 2024) | Compliance systems |
What is included in the product
 Detailed Word Document
Examines how macro-environmental forces uniquely impact Meritage across Political, Economic, Social, Technological, Environmental, and Legal dimensions, with each section supported by current data and trends; designed to help executives and advisors identify threats, opportunities, and scenario-driven strategies aligned to regional market and regulatory dynamics.

 Customizable Excel Spreadsheet
A concise, visually segmented Meritage PESTLE summary that’s easy to drop into presentations, share across teams, and customize with notes—ideal for fast alignment and focused risk discussions during planning sessions.
Economic factors

Consumer spending trends
Disposable income and consumer confidence—Conference Board average ~100 in 2024—drive quick-service footfall and ticket size, with value-oriented items outperforming in soft patches. In downturns value menus gain share while premium mix softens; elastic pricing and targeted offers protect comp sales. Meritage's geographic mix cushions regional cycles.
Food inflation
Protein and produce inflation compressed restaurant margins, with food-away-from-home CPI up 4.6% year-over-year in 2024, driving meat and produce costs higher and shaving several hundred basis points off margins.
Dynamic pricing and portion optimization became essential responses to protect margins while long-term supply contracts and commodity hedges (used by ~30% of chains) helped stabilize input costs.
Menu innovation shifting mix toward margin-accretive items, like premium sides and plant-forward dishes, improved average check and mitigated raw-cost pressure.

Labor market tightness
Labor market tightness has driven high competition for hourly construction and field workers, lifting wages and turnover as US unemployment held around 4% in 2024–25 and construction wages saw mid-single-digit YoY gains. Enhanced benefits, scheduling flexibility, and clearer career pathways have measurably improved retention at many builders. Increased use of automation and throughput tools helps offset staffing gaps on-site. Localized pay bands align labor cost to regional market conditions.

Interest rates and capex
Rising policy rates (federal funds 5.25–5.50% mid‑2025) and a 30‑year mortgage near 7.08% (May 2025) raise financing costs for Meritage builds, remodels and land; IRR hurdles and payback periods must be recalibrated upward, slowing unprofitable projects. Phased development and sale‑leaseback structures can preserve liquidity, while strong per‑unit gross margins support selective growth.
- Higher financing: increases WACC and capex coste
- IRR/payback: reprice underwriting and land bids
- Liquidity tools: phased builds, sale‑leasebacks
- Selective growth: pursue high unit economics
Real estate dynamics
Real estate costs — rents, land prices and cap rates — drive development ROI; U.S. retail cap rates averaged about 6.8% in 2024 (CBRE), pressuring returns. Drive‑thru and suburban sites command 10–25% rent premiums as off‑premise ordering reached roughly 60% of QSR sales (NPD/Technomic 2023). Strategic relocations/closures and data‑led site selection reduce cannibalization and boost portfolio returns.
- Rents/land: cap rates ~6.8% (2024)
- Drive‑thru premium: 10–25%
- Off‑premise share: ~60% QSR sales (2023)
- Data site selection: up to ~20% less cannibalization
Labor, compliance and supply shocks raise costs; hedging, multisourcing and automation mitigate
Disposable income and consumer confidence (~100 in 2024) drive footfall and value wins; Meritage's geographic mix cushions regional cycles. Food-away-from-home CPI +4.6% YoY (2024) compressed margins, offset by hedges and menu mix. Fed funds 5.25–5.50% (mid‑2025) and 30‑yr mortgage ~7.08% (May 2025) raise WACC; retail cap rates ~6.8% (2024) pressure ROI.
| Metric | Value |
|---|---|
| Consumer confidence (Conference Board) | ~100 (2024) |
| Food-away-from-home CPI | +4.6% YoY (2024) |
| Federal funds rate | 5.25–5.50% (mid‑2025) |
| 30‑yr mortgage | ~7.08% (May 2025) |
| U.S. retail cap rate (CBRE) | ~6.8% (2024) |
| Off-premise QSR share | ~60% (2023) |
Preview the Actual Deliverable
Meritage PESTLE Analysis
The preview shown here is the exact Meritage PESTLE Analysis you’ll receive after purchase—fully formatted and ready to use. The layout, content, and structure visible are identical to the downloadable file, with no placeholders or edits needed. After payment you’ll instantly get this finished, professionally structured document.

Make Smarter Strategic Decisions with a Complete PESTEL View
Discover how political, economic, social, technological, legal, and environmental forces are shaping Meritage's strategic path in our concise PESTLE summary. This snapshot highlights key risks and opportunities investors and managers need now. For detailed data, scenarios, and actionable recommendations, purchase the full PESTLE analysis and get immediate, ready-to-use insights.
Political factors
Minimum wage policy
Federal minimum wage remains $7.25/hr while states such as California ($16.00/hr) and New York ($15.00/hr) raise labor floors, directly increasing store-level labor costs and pressuring pricing. Multi-state operations add complexity as rates and rollout timelines differ. Meritage must optimize staffing models and productivity to preserve margins and offset ~25–35% labor share typical in retail. Proactive lobbying and scenario planning reduce policy shocks.
Labor regulation shifts
Recent NLRB shifts and growing predictive-scheduling laws expand joint-employer liability and administrative burden for franchisors, elevating exposure across the Meritage franchise system; the franchise sector employed 8.4 million workers (≈6% of private-sector employment) per IFA 2024. Franchise operators may face greater responsibility for franchise-wide labor practices, making robust compliance systems and training critical, while strategic workforce technology helps document adherence and reduce legal risk.
Permits and zoning
Local approvals for new builds, drive-thrus and remodels directly shape Meritage’s growth cadence by determining start dates and sales velocity, with politically driven traffic and noise concerns able to delay openings. Early community engagement statistically reduces opposition and shortens approval timelines. Diversifying the real estate pipeline across jurisdictions spreads permitting risk and smooths quarterly delivery variability.
Food policy and subsidies
Food policy and subsidies—through agricultural supports, SNAP (about 41 million monthly participants in FY2024) and school meal programs (NSLP ~4.8 billion lunches in 2022–23)—shape demand and input costs for beef, dairy and produce. Federal or state policy shifts can move wholesale prices and margins, impacting menu costs. Active monitoring of USDA and state actions informs purchasing and hedging; menu engineering and price-mix changes can offset volatility.
- Ag supports affect input costs
- SNAP ~41M monthly; NSLP ~4.8B lunches
- Monitor USDA/state rules for sourcing
- Menu engineering offsets price swings
Trade and tariffs
Tariffs on commodities, packaging and kitchen equipment can raise COGS and capex by roughly 2–15%, with episodic spikes; 2024 US-China trade frictions correlated with reported component lead-time increases near 20% for foodservice suppliers.
Shifts in trade relations compress supply certainty and extend lead times; hedging, multi-sourcing and inland inventory buffers reduce disruption, while vendor contracts must include clear price-adjustment and passthrough clauses.
- Impact range: 2–15% added COGS/capex
- 2024 lead-time increase: ~20% for some components
- Mitigation: hedging, multi-sourcing, inventory
- Contract focus: price-adjustment clarity
Labor, compliance and supply shocks raise costs; hedging, multisourcing and automation mitigate
Rising state minimums (federal $7.25; CA $16; NY $15), expanded NLRB/franchise liability, permitting delays and food policy (SNAP ~41M; NSLP ~4.8B lunches) increase labor, compliance and input risk; tariffs/2024 supply frictions raised COGS/capex 2–15% and some lead times ~20%; hedging, multi-sourcing and compliance systems mitigate.
| Issue | Impact | 2024 Data | Mitigation |
|---|---|---|---|
| Wages | Higher labor cost | CA $16; NY $15; fed $7.25 | Staff optimization |
| Franchise liability | Legal/admin burden | Franchise workforce 8.4M (IFA 2024) | Compliance systems |
What is included in the product
Detailed Word Document
Examines how macro-environmental forces uniquely impact Meritage across Political, Economic, Social, Technological, Environmental, and Legal dimensions, with each section supported by current data and trends; designed to help executives and advisors identify threats, opportunities, and scenario-driven strategies aligned to regional market and regulatory dynamics.
Customizable Excel Spreadsheet
A concise, visually segmented Meritage PESTLE summary that’s easy to drop into presentations, share across teams, and customize with notes—ideal for fast alignment and focused risk discussions during planning sessions.
Economic factors
Consumer spending trends
Disposable income and consumer confidence—Conference Board average ~100 in 2024—drive quick-service footfall and ticket size, with value-oriented items outperforming in soft patches. In downturns value menus gain share while premium mix softens; elastic pricing and targeted offers protect comp sales. Meritage's geographic mix cushions regional cycles.
Food inflation
Protein and produce inflation compressed restaurant margins, with food-away-from-home CPI up 4.6% year-over-year in 2024, driving meat and produce costs higher and shaving several hundred basis points off margins.
Dynamic pricing and portion optimization became essential responses to protect margins while long-term supply contracts and commodity hedges (used by ~30% of chains) helped stabilize input costs.
Menu innovation shifting mix toward margin-accretive items, like premium sides and plant-forward dishes, improved average check and mitigated raw-cost pressure.
Labor market tightness
Labor market tightness has driven high competition for hourly construction and field workers, lifting wages and turnover as US unemployment held around 4% in 2024–25 and construction wages saw mid-single-digit YoY gains. Enhanced benefits, scheduling flexibility, and clearer career pathways have measurably improved retention at many builders. Increased use of automation and throughput tools helps offset staffing gaps on-site. Localized pay bands align labor cost to regional market conditions.
Interest rates and capex
Rising policy rates (federal funds 5.25–5.50% mid‑2025) and a 30‑year mortgage near 7.08% (May 2025) raise financing costs for Meritage builds, remodels and land; IRR hurdles and payback periods must be recalibrated upward, slowing unprofitable projects. Phased development and sale‑leaseback structures can preserve liquidity, while strong per‑unit gross margins support selective growth.
- Higher financing: increases WACC and capex coste
- IRR/payback: reprice underwriting and land bids
- Liquidity tools: phased builds, sale‑leasebacks
- Selective growth: pursue high unit economics
Real estate dynamics
Real estate costs — rents, land prices and cap rates — drive development ROI; U.S. retail cap rates averaged about 6.8% in 2024 (CBRE), pressuring returns. Drive‑thru and suburban sites command 10–25% rent premiums as off‑premise ordering reached roughly 60% of QSR sales (NPD/Technomic 2023). Strategic relocations/closures and data‑led site selection reduce cannibalization and boost portfolio returns.
- Rents/land: cap rates ~6.8% (2024)
- Drive‑thru premium: 10–25%
- Off‑premise share: ~60% QSR sales (2023)
- Data site selection: up to ~20% less cannibalization
Labor, compliance and supply shocks raise costs; hedging, multisourcing and automation mitigate
Disposable income and consumer confidence (~100 in 2024) drive footfall and value wins; Meritage's geographic mix cushions regional cycles. Food-away-from-home CPI +4.6% YoY (2024) compressed margins, offset by hedges and menu mix. Fed funds 5.25–5.50% (mid‑2025) and 30‑yr mortgage ~7.08% (May 2025) raise WACC; retail cap rates ~6.8% (2024) pressure ROI.
| Metric | Value |
|---|---|
| Consumer confidence (Conference Board) | ~100 (2024) |
| Food-away-from-home CPI | +4.6% YoY (2024) |
| Federal funds rate | 5.25–5.50% (mid‑2025) |
| 30‑yr mortgage | ~7.08% (May 2025) |
| U.S. retail cap rate (CBRE) | ~6.8% (2024) |
| Off-premise QSR share | ~60% (2023) |
Preview the Actual Deliverable
Meritage PESTLE Analysis
The preview shown here is the exact Meritage PESTLE Analysis you’ll receive after purchase—fully formatted and ready to use. The layout, content, and structure visible are identical to the downloadable file, with no placeholders or edits needed. After payment you’ll instantly get this finished, professionally structured document.
Original: $10.00
-65%$10.00
$3.50Description
Make Smarter Strategic Decisions with a Complete PESTEL View
Discover how political, economic, social, technological, legal, and environmental forces are shaping Meritage's strategic path in our concise PESTLE summary. This snapshot highlights key risks and opportunities investors and managers need now. For detailed data, scenarios, and actionable recommendations, purchase the full PESTLE analysis and get immediate, ready-to-use insights.
Political factors
Minimum wage policy
Federal minimum wage remains $7.25/hr while states such as California ($16.00/hr) and New York ($15.00/hr) raise labor floors, directly increasing store-level labor costs and pressuring pricing. Multi-state operations add complexity as rates and rollout timelines differ. Meritage must optimize staffing models and productivity to preserve margins and offset ~25–35% labor share typical in retail. Proactive lobbying and scenario planning reduce policy shocks.
Labor regulation shifts
Recent NLRB shifts and growing predictive-scheduling laws expand joint-employer liability and administrative burden for franchisors, elevating exposure across the Meritage franchise system; the franchise sector employed 8.4 million workers (≈6% of private-sector employment) per IFA 2024. Franchise operators may face greater responsibility for franchise-wide labor practices, making robust compliance systems and training critical, while strategic workforce technology helps document adherence and reduce legal risk.
Permits and zoning
Local approvals for new builds, drive-thrus and remodels directly shape Meritage’s growth cadence by determining start dates and sales velocity, with politically driven traffic and noise concerns able to delay openings. Early community engagement statistically reduces opposition and shortens approval timelines. Diversifying the real estate pipeline across jurisdictions spreads permitting risk and smooths quarterly delivery variability.
Food policy and subsidies
Food policy and subsidies—through agricultural supports, SNAP (about 41 million monthly participants in FY2024) and school meal programs (NSLP ~4.8 billion lunches in 2022–23)—shape demand and input costs for beef, dairy and produce. Federal or state policy shifts can move wholesale prices and margins, impacting menu costs. Active monitoring of USDA and state actions informs purchasing and hedging; menu engineering and price-mix changes can offset volatility.
- Ag supports affect input costs
- SNAP ~41M monthly; NSLP ~4.8B lunches
- Monitor USDA/state rules for sourcing
- Menu engineering offsets price swings
Trade and tariffs
Tariffs on commodities, packaging and kitchen equipment can raise COGS and capex by roughly 2–15%, with episodic spikes; 2024 US-China trade frictions correlated with reported component lead-time increases near 20% for foodservice suppliers.
Shifts in trade relations compress supply certainty and extend lead times; hedging, multi-sourcing and inland inventory buffers reduce disruption, while vendor contracts must include clear price-adjustment and passthrough clauses.
- Impact range: 2–15% added COGS/capex
- 2024 lead-time increase: ~20% for some components
- Mitigation: hedging, multi-sourcing, inventory
- Contract focus: price-adjustment clarity
Labor, compliance and supply shocks raise costs; hedging, multisourcing and automation mitigate
Rising state minimums (federal $7.25; CA $16; NY $15), expanded NLRB/franchise liability, permitting delays and food policy (SNAP ~41M; NSLP ~4.8B lunches) increase labor, compliance and input risk; tariffs/2024 supply frictions raised COGS/capex 2–15% and some lead times ~20%; hedging, multi-sourcing and compliance systems mitigate.
| Issue | Impact | 2024 Data | Mitigation |
|---|---|---|---|
| Wages | Higher labor cost | CA $16; NY $15; fed $7.25 | Staff optimization |
| Franchise liability | Legal/admin burden | Franchise workforce 8.4M (IFA 2024) | Compliance systems |
What is included in the product
Detailed Word Document
Examines how macro-environmental forces uniquely impact Meritage across Political, Economic, Social, Technological, Environmental, and Legal dimensions, with each section supported by current data and trends; designed to help executives and advisors identify threats, opportunities, and scenario-driven strategies aligned to regional market and regulatory dynamics.
Customizable Excel Spreadsheet
A concise, visually segmented Meritage PESTLE summary that’s easy to drop into presentations, share across teams, and customize with notes—ideal for fast alignment and focused risk discussions during planning sessions.
Economic factors
Consumer spending trends
Disposable income and consumer confidence—Conference Board average ~100 in 2024—drive quick-service footfall and ticket size, with value-oriented items outperforming in soft patches. In downturns value menus gain share while premium mix softens; elastic pricing and targeted offers protect comp sales. Meritage's geographic mix cushions regional cycles.
Food inflation
Protein and produce inflation compressed restaurant margins, with food-away-from-home CPI up 4.6% year-over-year in 2024, driving meat and produce costs higher and shaving several hundred basis points off margins.
Dynamic pricing and portion optimization became essential responses to protect margins while long-term supply contracts and commodity hedges (used by ~30% of chains) helped stabilize input costs.
Menu innovation shifting mix toward margin-accretive items, like premium sides and plant-forward dishes, improved average check and mitigated raw-cost pressure.
Labor market tightness
Labor market tightness has driven high competition for hourly construction and field workers, lifting wages and turnover as US unemployment held around 4% in 2024–25 and construction wages saw mid-single-digit YoY gains. Enhanced benefits, scheduling flexibility, and clearer career pathways have measurably improved retention at many builders. Increased use of automation and throughput tools helps offset staffing gaps on-site. Localized pay bands align labor cost to regional market conditions.
Interest rates and capex
Rising policy rates (federal funds 5.25–5.50% mid‑2025) and a 30‑year mortgage near 7.08% (May 2025) raise financing costs for Meritage builds, remodels and land; IRR hurdles and payback periods must be recalibrated upward, slowing unprofitable projects. Phased development and sale‑leaseback structures can preserve liquidity, while strong per‑unit gross margins support selective growth.
- Higher financing: increases WACC and capex coste
- IRR/payback: reprice underwriting and land bids
- Liquidity tools: phased builds, sale‑leasebacks
- Selective growth: pursue high unit economics
Real estate dynamics
Real estate costs — rents, land prices and cap rates — drive development ROI; U.S. retail cap rates averaged about 6.8% in 2024 (CBRE), pressuring returns. Drive‑thru and suburban sites command 10–25% rent premiums as off‑premise ordering reached roughly 60% of QSR sales (NPD/Technomic 2023). Strategic relocations/closures and data‑led site selection reduce cannibalization and boost portfolio returns.
- Rents/land: cap rates ~6.8% (2024)
- Drive‑thru premium: 10–25%
- Off‑premise share: ~60% QSR sales (2023)
- Data site selection: up to ~20% less cannibalization
Labor, compliance and supply shocks raise costs; hedging, multisourcing and automation mitigate
Disposable income and consumer confidence (~100 in 2024) drive footfall and value wins; Meritage's geographic mix cushions regional cycles. Food-away-from-home CPI +4.6% YoY (2024) compressed margins, offset by hedges and menu mix. Fed funds 5.25–5.50% (mid‑2025) and 30‑yr mortgage ~7.08% (May 2025) raise WACC; retail cap rates ~6.8% (2024) pressure ROI.
| Metric | Value |
|---|---|
| Consumer confidence (Conference Board) | ~100 (2024) |
| Food-away-from-home CPI | +4.6% YoY (2024) |
| Federal funds rate | 5.25–5.50% (mid‑2025) |
| 30‑yr mortgage | ~7.08% (May 2025) |
| U.S. retail cap rate (CBRE) | ~6.8% (2024) |
| Off-premise QSR share | ~60% (2023) |
Preview the Actual Deliverable
Meritage PESTLE Analysis
The preview shown here is the exact Meritage PESTLE Analysis you’ll receive after purchase—fully formatted and ready to use. The layout, content, and structure visible are identical to the downloadable file, with no placeholders or edits needed. After payment you’ll instantly get this finished, professionally structured document.











