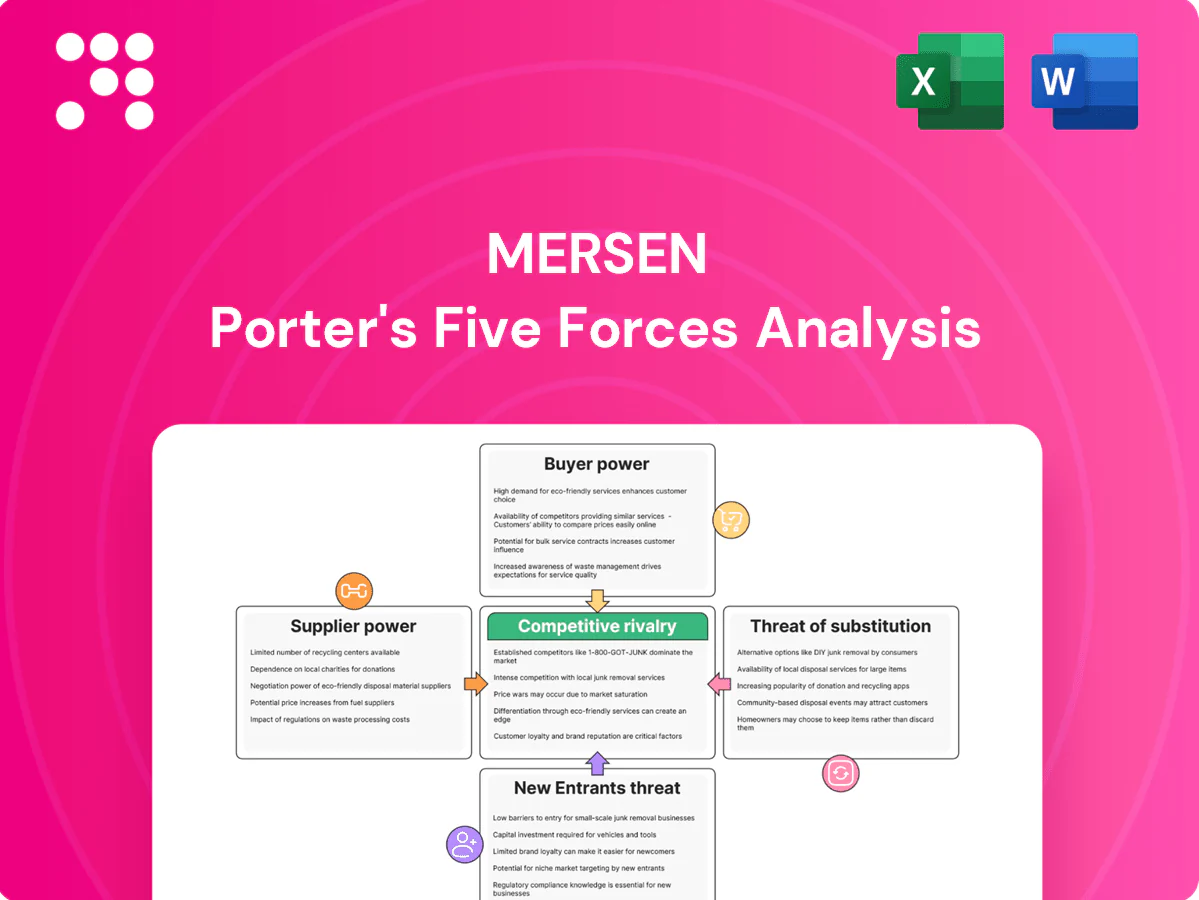
Mersen Porter's Five Forces Analysis

Go Beyond the Preview—Access the Full Strategic Report
Mersen faces moderate supplier power, specialized-product barriers deterring new entrants, evolving substitute risks from alternative materials, discerning industrial buyers, and intense incumbent rivalry shaping margins. This snapshot scratches the surface. Unlock the full Porter's Five Forces Analysis for force-by-force ratings, visuals, and actionable strategic insights.
Suppliers Bargaining Power

Concentrated critical materials
Advanced graphite, specialty ceramics, high-purity chemicals and copper are sourced from few qualified producers with geographic concentration; China accounted for about 70% of natural graphite production in 2023 and Chile about 27% of global copper mine output in 2023 (USGS). Supply disruptions or export controls can tighten availability and raise input costs quickly. Mersen uses dual sourcing and inventory buffers to mitigate risk but remains exposed to price and supply volatility.
High-spec qualification needs
Inputs must meet stringent thermal, electrical and purity specs for power and semiconductor applications, limiting supplier substitutability. Qualification cycles commonly run 6–18 months and cost between $100k–$1M, strengthening incumbent suppliers’ leverage. Requalification can delay programs 6–12 months and raise switching costs by 20–50%.

Equipment and furnace dependence
Custom high-temperature furnaces and precision machining equipment come from a small set of specialized OEMs, creating lock-in for maintenance and upgrades and elevating supplier bargaining power.
Lead times commonly run 12–26 weeks and spare-parts premiums of 20–50% are reported in industry surveys (2024), favoring suppliers on price and availability.
Preventive maintenance agreements mitigate outages but the >$1m capex per furnace and intensive upgrade cycles sustain supplier leverage over Mersen.

Energy and logistics sensitivity
- Energy volatility: industrial power ~0.16 €/kWh (2024)
- Gas benchmark: TTF ~30 €/MWh (2024)
- Logistics: carrier tightness enables 20–30% surcharges
- Mitigants: long-term contracts/regional sourcing cover ~30–50% exposure
Compliance and traceability burdens
REACH, RoHS, and sector certifications force detailed supplier documentation and audits; REACH lists over 22,000 registered substances (2024) and RoHS restricts 10 substance groups, narrowing approved vendor pools and increasing supplier leverage. Mersen’s supplier development and audits lower but do not eliminate dependency risk.
- REACH: >22,000 substances (2024)
- RoHS: 10 restricted groups
- Smaller approved-vendor lists → higher supplier leverage
- Mersen supplier development reduces but does not remove dependency
Graphite & copper supplier concentration plus long lead times heighten supply-price risk
Mersen faces concentrated suppliers for graphite, copper and specialty chemicals (China ~70% graphite 2023; Chile ~27% copper 2023), creating high price/supply vulnerability. Long qualification cycles (6–18 months) and specialized OEMs for furnaces raise switching costs; lead times 12–26 weeks and spare-part premiums 20–50%. Energy/logistics add volatility (power ~0.16 €/kWh; TTF ~30 €/MWh 2024); contracts cover ~30–50% exposure.
| Metric | Value |
|---|---|
| Graphite concentration | China ~70% (2023) |
| Copper mine output | Chile ~27% (2023) |
| Qualification time/cost | 6–18 months; €100k–€1M |
| Lead times | 12–26 weeks |
| Spare-part premium | 20–50% |
| Energy costs | 0.16 €/kWh; TTF ~30 €/MWh (2024) |
| Contract coverage | ~30–50% exposure |
| REACH | >22,000 substances (2024) |
What is included in the product
 Detailed Word Document
Tailored Porter's Five Forces analysis for Mersen that uncovers key competitive drivers, supplier and buyer leverage, entry barriers, and substitute threats affecting its pricing and profitability. Highlights disruptive forces and strategic levers to defend market share and inform investor or management decision-making.

 Customizable Excel Spreadsheet
A concise one-sheet Porter’s Five Forces for Mersen—summarizes supplier/customer power, rivalry, entry and substitute threats to pinpoint strategic pain points and enable fast, board-ready decisions.
Customers Bargaining Power

Large OEM leverage
Large OEMs in semiconductors, rail, energy, chemicals and pharma purchase at scale and negotiate aggressively, with semiconductor industry sales near USD 600 billion in 2024 (WSTS), amplifying buyer leverage. Framework agreements and competitive tenders force tighter pricing and service SLAs across bids. Multi-year volume commitments commonly exchange stability for discounts, often material to margins.
Switching costs via qualification
Engineering validation, safety certifications and long-term reliability records make switching slow and risky for mission-critical parts, with industry qualification cycles commonly taking 6–18 months, thereby reducing buyer power for highly customized Mersen solutions. The combination of product-specific testing and site approvals raises sunk costs and delivery risk. When multiple vendors hold equivalent qualifications, buyer leverage rises and procurement flexibility improves.

Product mix price sensitivity
Standard fuses and surge devices exhibit high price transparency and substitution, pressuring margins as buyers increasingly source online in 2024. Bespoke thermal and high-temperature materials retain pricing power with limited comparability and premium positioning. Shifts toward a higher share of bespoke products in 2024 bolster margin resilience for Mersen despite commodity pressure.

Aftermarket and lifecycle stickiness
Aftermarket spare parts, maintenance contracts and retrofits generate recurring revenue for Mersen and reduce buyer leverage by raising switching costs; long product lifecycles and approved-supplier policies favor continuity from OEMs to end users. Installed-base compatibility across power electronics and graphite solutions locks customers into proven replacements and engineering standards. Rapid service responsiveness and global support networks further entrench relationships and protect margins.
- Spare parts recurring revenue
- Installed-base compatibility
- Global service responsiveness
Demand cyclicality impact
Demand cyclicality amplifies customers' bargaining power: downturns in electronics or industrial capex increase price pressure and push inventory risk upstream, prompting buyers to consolidate suppliers for concessions; conversely, upcycles and tight capacity shift leverage back toward Mersen as customers compete for limited supply.
- Downturns: higher price pressure
- Buyers consolidate suppliers
- Upcycles: capacity tightness favors Mersen
OEM price pressure hits semiconductors, but long qualification cycles protect bespoke margins
Large OEM buyers (semiconductor sales ~USD 600 billion in 2024) exert strong price pressure via framework agreements and tenders, yet 6–18 month qualification cycles and recurring aftermarket revenues reduce buyer leverage for bespoke Mersen solutions; standard products face margin pressure from rising online sourcing in 2024.
| Metric | 2024 | Impact |
|---|---|---|
| Semiconductor market | ~USD 600bn (WSTS) | High buyer leverage |
| Qualification cycle | 6–18 months | Limits switching |
| Online sourcing | Rising 2024 | Pressures standard products |
What You See Is What You Get
Mersen Porter's Five Forces Analysis
This preview shows the exact Mersen Porter's Five Forces Analysis you'll receive immediately after purchase—no surprises, no placeholders. The document displayed here is the same professionally written, fully formatted file ready for download and use the moment you buy. You're looking at the actual deliverable and will get instant access to this exact analysis upon payment.

Go Beyond the Preview—Access the Full Strategic Report
Mersen faces moderate supplier power, specialized-product barriers deterring new entrants, evolving substitute risks from alternative materials, discerning industrial buyers, and intense incumbent rivalry shaping margins. This snapshot scratches the surface. Unlock the full Porter's Five Forces Analysis for force-by-force ratings, visuals, and actionable strategic insights.
Suppliers Bargaining Power
Concentrated critical materials
Advanced graphite, specialty ceramics, high-purity chemicals and copper are sourced from few qualified producers with geographic concentration; China accounted for about 70% of natural graphite production in 2023 and Chile about 27% of global copper mine output in 2023 (USGS). Supply disruptions or export controls can tighten availability and raise input costs quickly. Mersen uses dual sourcing and inventory buffers to mitigate risk but remains exposed to price and supply volatility.
High-spec qualification needs
Inputs must meet stringent thermal, electrical and purity specs for power and semiconductor applications, limiting supplier substitutability. Qualification cycles commonly run 6–18 months and cost between $100k–$1M, strengthening incumbent suppliers’ leverage. Requalification can delay programs 6–12 months and raise switching costs by 20–50%.
Equipment and furnace dependence
Custom high-temperature furnaces and precision machining equipment come from a small set of specialized OEMs, creating lock-in for maintenance and upgrades and elevating supplier bargaining power.
Lead times commonly run 12–26 weeks and spare-parts premiums of 20–50% are reported in industry surveys (2024), favoring suppliers on price and availability.
Preventive maintenance agreements mitigate outages but the >$1m capex per furnace and intensive upgrade cycles sustain supplier leverage over Mersen.
Energy and logistics sensitivity
- Energy volatility: industrial power ~0.16 €/kWh (2024)
- Gas benchmark: TTF ~30 €/MWh (2024)
- Logistics: carrier tightness enables 20–30% surcharges
- Mitigants: long-term contracts/regional sourcing cover ~30–50% exposure
Compliance and traceability burdens
REACH, RoHS, and sector certifications force detailed supplier documentation and audits; REACH lists over 22,000 registered substances (2024) and RoHS restricts 10 substance groups, narrowing approved vendor pools and increasing supplier leverage. Mersen’s supplier development and audits lower but do not eliminate dependency risk.
- REACH: >22,000 substances (2024)
- RoHS: 10 restricted groups
- Smaller approved-vendor lists → higher supplier leverage
- Mersen supplier development reduces but does not remove dependency
Graphite & copper supplier concentration plus long lead times heighten supply-price risk
Mersen faces concentrated suppliers for graphite, copper and specialty chemicals (China ~70% graphite 2023; Chile ~27% copper 2023), creating high price/supply vulnerability. Long qualification cycles (6–18 months) and specialized OEMs for furnaces raise switching costs; lead times 12–26 weeks and spare-part premiums 20–50%. Energy/logistics add volatility (power ~0.16 €/kWh; TTF ~30 €/MWh 2024); contracts cover ~30–50% exposure.
| Metric | Value |
|---|---|
| Graphite concentration | China ~70% (2023) |
| Copper mine output | Chile ~27% (2023) |
| Qualification time/cost | 6–18 months; €100k–€1M |
| Lead times | 12–26 weeks |
| Spare-part premium | 20–50% |
| Energy costs | 0.16 €/kWh; TTF ~30 €/MWh (2024) |
| Contract coverage | ~30–50% exposure |
| REACH | >22,000 substances (2024) |
What is included in the product
Detailed Word Document
Tailored Porter's Five Forces analysis for Mersen that uncovers key competitive drivers, supplier and buyer leverage, entry barriers, and substitute threats affecting its pricing and profitability. Highlights disruptive forces and strategic levers to defend market share and inform investor or management decision-making.
Customizable Excel Spreadsheet
A concise one-sheet Porter’s Five Forces for Mersen—summarizes supplier/customer power, rivalry, entry and substitute threats to pinpoint strategic pain points and enable fast, board-ready decisions.
Customers Bargaining Power
Large OEM leverage
Large OEMs in semiconductors, rail, energy, chemicals and pharma purchase at scale and negotiate aggressively, with semiconductor industry sales near USD 600 billion in 2024 (WSTS), amplifying buyer leverage. Framework agreements and competitive tenders force tighter pricing and service SLAs across bids. Multi-year volume commitments commonly exchange stability for discounts, often material to margins.
Switching costs via qualification
Engineering validation, safety certifications and long-term reliability records make switching slow and risky for mission-critical parts, with industry qualification cycles commonly taking 6–18 months, thereby reducing buyer power for highly customized Mersen solutions. The combination of product-specific testing and site approvals raises sunk costs and delivery risk. When multiple vendors hold equivalent qualifications, buyer leverage rises and procurement flexibility improves.
Product mix price sensitivity
Standard fuses and surge devices exhibit high price transparency and substitution, pressuring margins as buyers increasingly source online in 2024. Bespoke thermal and high-temperature materials retain pricing power with limited comparability and premium positioning. Shifts toward a higher share of bespoke products in 2024 bolster margin resilience for Mersen despite commodity pressure.
Aftermarket and lifecycle stickiness
Aftermarket spare parts, maintenance contracts and retrofits generate recurring revenue for Mersen and reduce buyer leverage by raising switching costs; long product lifecycles and approved-supplier policies favor continuity from OEMs to end users. Installed-base compatibility across power electronics and graphite solutions locks customers into proven replacements and engineering standards. Rapid service responsiveness and global support networks further entrench relationships and protect margins.
- Spare parts recurring revenue
- Installed-base compatibility
- Global service responsiveness
Demand cyclicality impact
Demand cyclicality amplifies customers' bargaining power: downturns in electronics or industrial capex increase price pressure and push inventory risk upstream, prompting buyers to consolidate suppliers for concessions; conversely, upcycles and tight capacity shift leverage back toward Mersen as customers compete for limited supply.
- Downturns: higher price pressure
- Buyers consolidate suppliers
- Upcycles: capacity tightness favors Mersen
OEM price pressure hits semiconductors, but long qualification cycles protect bespoke margins
Large OEM buyers (semiconductor sales ~USD 600 billion in 2024) exert strong price pressure via framework agreements and tenders, yet 6–18 month qualification cycles and recurring aftermarket revenues reduce buyer leverage for bespoke Mersen solutions; standard products face margin pressure from rising online sourcing in 2024.
| Metric | 2024 | Impact |
|---|---|---|
| Semiconductor market | ~USD 600bn (WSTS) | High buyer leverage |
| Qualification cycle | 6–18 months | Limits switching |
| Online sourcing | Rising 2024 | Pressures standard products |
What You See Is What You Get
Mersen Porter's Five Forces Analysis
This preview shows the exact Mersen Porter's Five Forces Analysis you'll receive immediately after purchase—no surprises, no placeholders. The document displayed here is the same professionally written, fully formatted file ready for download and use the moment you buy. You're looking at the actual deliverable and will get instant access to this exact analysis upon payment.
Description
Go Beyond the Preview—Access the Full Strategic Report
Mersen faces moderate supplier power, specialized-product barriers deterring new entrants, evolving substitute risks from alternative materials, discerning industrial buyers, and intense incumbent rivalry shaping margins. This snapshot scratches the surface. Unlock the full Porter's Five Forces Analysis for force-by-force ratings, visuals, and actionable strategic insights.
Suppliers Bargaining Power
Concentrated critical materials
Advanced graphite, specialty ceramics, high-purity chemicals and copper are sourced from few qualified producers with geographic concentration; China accounted for about 70% of natural graphite production in 2023 and Chile about 27% of global copper mine output in 2023 (USGS). Supply disruptions or export controls can tighten availability and raise input costs quickly. Mersen uses dual sourcing and inventory buffers to mitigate risk but remains exposed to price and supply volatility.
High-spec qualification needs
Inputs must meet stringent thermal, electrical and purity specs for power and semiconductor applications, limiting supplier substitutability. Qualification cycles commonly run 6–18 months and cost between $100k–$1M, strengthening incumbent suppliers’ leverage. Requalification can delay programs 6–12 months and raise switching costs by 20–50%.
Equipment and furnace dependence
Custom high-temperature furnaces and precision machining equipment come from a small set of specialized OEMs, creating lock-in for maintenance and upgrades and elevating supplier bargaining power.
Lead times commonly run 12–26 weeks and spare-parts premiums of 20–50% are reported in industry surveys (2024), favoring suppliers on price and availability.
Preventive maintenance agreements mitigate outages but the >$1m capex per furnace and intensive upgrade cycles sustain supplier leverage over Mersen.
Energy and logistics sensitivity
- Energy volatility: industrial power ~0.16 €/kWh (2024)
- Gas benchmark: TTF ~30 €/MWh (2024)
- Logistics: carrier tightness enables 20–30% surcharges
- Mitigants: long-term contracts/regional sourcing cover ~30–50% exposure
Compliance and traceability burdens
REACH, RoHS, and sector certifications force detailed supplier documentation and audits; REACH lists over 22,000 registered substances (2024) and RoHS restricts 10 substance groups, narrowing approved vendor pools and increasing supplier leverage. Mersen’s supplier development and audits lower but do not eliminate dependency risk.
- REACH: >22,000 substances (2024)
- RoHS: 10 restricted groups
- Smaller approved-vendor lists → higher supplier leverage
- Mersen supplier development reduces but does not remove dependency
Graphite & copper supplier concentration plus long lead times heighten supply-price risk
Mersen faces concentrated suppliers for graphite, copper and specialty chemicals (China ~70% graphite 2023; Chile ~27% copper 2023), creating high price/supply vulnerability. Long qualification cycles (6–18 months) and specialized OEMs for furnaces raise switching costs; lead times 12–26 weeks and spare-part premiums 20–50%. Energy/logistics add volatility (power ~0.16 €/kWh; TTF ~30 €/MWh 2024); contracts cover ~30–50% exposure.
| Metric | Value |
|---|---|
| Graphite concentration | China ~70% (2023) |
| Copper mine output | Chile ~27% (2023) |
| Qualification time/cost | 6–18 months; €100k–€1M |
| Lead times | 12–26 weeks |
| Spare-part premium | 20–50% |
| Energy costs | 0.16 €/kWh; TTF ~30 €/MWh (2024) |
| Contract coverage | ~30–50% exposure |
| REACH | >22,000 substances (2024) |
What is included in the product
Detailed Word Document
Tailored Porter's Five Forces analysis for Mersen that uncovers key competitive drivers, supplier and buyer leverage, entry barriers, and substitute threats affecting its pricing and profitability. Highlights disruptive forces and strategic levers to defend market share and inform investor or management decision-making.
Customizable Excel Spreadsheet
A concise one-sheet Porter’s Five Forces for Mersen—summarizes supplier/customer power, rivalry, entry and substitute threats to pinpoint strategic pain points and enable fast, board-ready decisions.
Customers Bargaining Power
Large OEM leverage
Large OEMs in semiconductors, rail, energy, chemicals and pharma purchase at scale and negotiate aggressively, with semiconductor industry sales near USD 600 billion in 2024 (WSTS), amplifying buyer leverage. Framework agreements and competitive tenders force tighter pricing and service SLAs across bids. Multi-year volume commitments commonly exchange stability for discounts, often material to margins.
Switching costs via qualification
Engineering validation, safety certifications and long-term reliability records make switching slow and risky for mission-critical parts, with industry qualification cycles commonly taking 6–18 months, thereby reducing buyer power for highly customized Mersen solutions. The combination of product-specific testing and site approvals raises sunk costs and delivery risk. When multiple vendors hold equivalent qualifications, buyer leverage rises and procurement flexibility improves.
Product mix price sensitivity
Standard fuses and surge devices exhibit high price transparency and substitution, pressuring margins as buyers increasingly source online in 2024. Bespoke thermal and high-temperature materials retain pricing power with limited comparability and premium positioning. Shifts toward a higher share of bespoke products in 2024 bolster margin resilience for Mersen despite commodity pressure.
Aftermarket and lifecycle stickiness
Aftermarket spare parts, maintenance contracts and retrofits generate recurring revenue for Mersen and reduce buyer leverage by raising switching costs; long product lifecycles and approved-supplier policies favor continuity from OEMs to end users. Installed-base compatibility across power electronics and graphite solutions locks customers into proven replacements and engineering standards. Rapid service responsiveness and global support networks further entrench relationships and protect margins.
- Spare parts recurring revenue
- Installed-base compatibility
- Global service responsiveness
Demand cyclicality impact
Demand cyclicality amplifies customers' bargaining power: downturns in electronics or industrial capex increase price pressure and push inventory risk upstream, prompting buyers to consolidate suppliers for concessions; conversely, upcycles and tight capacity shift leverage back toward Mersen as customers compete for limited supply.
- Downturns: higher price pressure
- Buyers consolidate suppliers
- Upcycles: capacity tightness favors Mersen
OEM price pressure hits semiconductors, but long qualification cycles protect bespoke margins
Large OEM buyers (semiconductor sales ~USD 600 billion in 2024) exert strong price pressure via framework agreements and tenders, yet 6–18 month qualification cycles and recurring aftermarket revenues reduce buyer leverage for bespoke Mersen solutions; standard products face margin pressure from rising online sourcing in 2024.
| Metric | 2024 | Impact |
|---|---|---|
| Semiconductor market | ~USD 600bn (WSTS) | High buyer leverage |
| Qualification cycle | 6–18 months | Limits switching |
| Online sourcing | Rising 2024 | Pressures standard products |
What You See Is What You Get
Mersen Porter's Five Forces Analysis
This preview shows the exact Mersen Porter's Five Forces Analysis you'll receive immediately after purchase—no surprises, no placeholders. The document displayed here is the same professionally written, fully formatted file ready for download and use the moment you buy. You're looking at the actual deliverable and will get instant access to this exact analysis upon payment.











