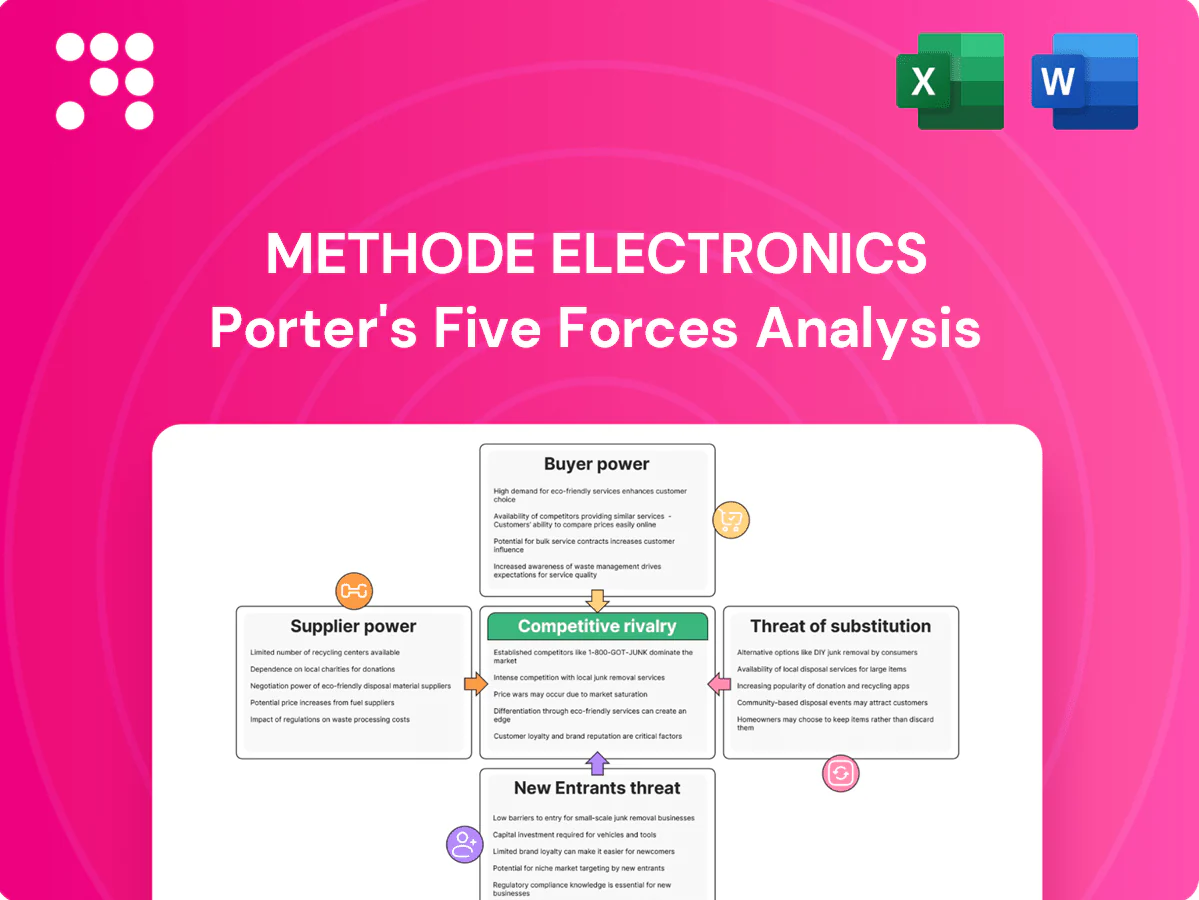
Methode Electronics Porter's Five Forces Analysis

A Must-Have Tool for Decision-Makers
Methode Electronics faces moderate rivalry from diversified automotive and industrial electronics suppliers, strong buyer pressure from OEMs, and manageable supplier concentration for key components. Emerging technologies and substitutes raise strategic risks while scale and customer relationships are defensive assets. This brief overview hints at the complexity—unlock the full Porter's Five Forces Analysis for force-by-force ratings, visuals, and actionable strategic insight.
Suppliers Bargaining Power

Specialized components
Many inputs — ASICs, optical modules and high-temperature polymers — are niche and hard to substitute, limiting interchangeable sources. Suppliers with proprietary IP can command pricing and prioritization, and in 2024 tightness in specialty components persisted. Automotive and industrial qualification cycles typically run 12–24 months, reinforcing supplier lock-in. Methode mitigates via multi-sourcing and in-house engineering but cannot fully eliminate dependence.
Raw material concentration
Copper supply tightness (Chile ~28% of mine output), China’s ~60% dominance in rare earth production, and a semiconductor market near $600B in 2024 create cyclical constraints and geopolitical risk that boost suppliers’ leverage over Methode Electronics. Price volatility in 2024 transferred bargaining power upstream, with long-term contracts and hedging smoothing costs but failing to prevent shortages. Cost pass-through to customers has been partial and delayed, compressing margins.

Capex-intensive tooling
Custom tooling and test fixtures create program lock-in with suppliers, making switches costly due to sunk tooling investments, PPAP requalification and timeline risks. This elevates supplier leverage on change orders and ramp-ups, allowing pricing and delivery concessions. Volume commitments and vendor-managed inventory provide a trade-off, exchanging flexibility for improved terms and reduced unit costs.

Logistics and lead times
Complex global supply chains expose Methode to lead-time shocks, with industry lead times up roughly 25% versus pre-pandemic levels in 2024; scarce supplier capacity means vendors allocate to higher-margin OEMs first, pressuring order fulfillment. Buffer inventories mitigate disruption but typically raise working capital by double-digit percentages. Nearshoring or dual‑continent sourcing in 2024 reduced single-region vendor leverage for many electronics firms.
- lead-times +25% vs pre-2020
- capacity allocation favors higher-margin customers
- buffers increase working capital (double-digit %)
- nearshoring/dual sourcing lowers single-region dependency
Supplier ecosystem breadth
Supplier power up; $1.13B, lead-times +25%
Supplier power is elevated for niche ASICs, optical modules and high-temp polymers, driving pricing and allocation risk despite Methode’s $1.13B 2024 scale. Industry lead-times rose ~25% vs pre-2020 and global semiconductor market ~ $600B in 2024, amplifying supplier leverage; multi-sourcing, NPI collaboration and long-term contracts partially mitigate exposure.
| Metric | 2024 Value |
|---|---|
| Methode revenue | $1.13B |
| Lead-times vs pre-2020 | +25% |
| Global semi market | $600B |
| China rare earth share | ~60% |
| Chile copper mine share | ~28% |
What is included in the product
 Detailed Word Document
Tailored Porter's Five Forces analysis for Methode Electronics that uncovers competitive drivers, customer and supplier power, barriers to entry, threat of substitutes, and emerging disruptions to assess pricing pressure and strategic positioning.

 Customizable Excel Spreadsheet
Clear, one-sheet Porter's Five Forces for Methode Electronics—instantly visualize competitive pressure with a spider chart and customizable pressure levels so teams can swap in current data, copy into decks, and make faster strategic decisions without complex tools.
Customers Bargaining Power

OEM concentration
Automotive OEMs and cloud hyperscalers are highly concentrated, multi-billion-dollar buyers whose combined hyperscaler capex exceeded $100 billion in 2024, enabling aggressive pricing, strict payment terms and annual cost-downs. Design wins lock revenue but prompt continuous rebids and cost pressure. Deep relationships, on-time delivery and performance metrics (quality, yield, warranty) are critical to retain share.
High switching costs
Qualification requirements such as IATF 16949 and functional safety standard ISO 26262 plus deep software/ECU integration create high switching barriers that temper buyer power during program runs. Mid-program leverage is limited, but at model refresh—typically every 4–6 years—OEMs solicit competitive quotes to extract concessions. Methode can defend price at refresh by delivering differentiated electrical and software performance validated to those certifications.

Customization vs. commoditization
Customization in Custom HMI, power distribution and sensor assemblies reduces comparability and raises customer stickiness, supporting Methode Electronics which reported about $1.24 billion in revenue in fiscal 2024. Standard connectors and cables remain price-focused, shrinking margins. Methode captures premium where engineering value is clear and measurable. Outcome-based specs shift buying to total cost of ownership rather than unit price.

Demand cyclicality
Auto and consumer demand cyclicality increases buyer leverage in downturns; customers pushed Methode for inventory support and expedite/de-expedite flexibility during 2023–24, pressuring margins. Offering consignment or buffer stock won programs but raised working capital and reduced gross margin. Methode reported FY2024 revenue of $1.08B, and diversification across industrial and medical verticals helped smooth exposure.
- Buyers press inventory support and flexibility
- Consignment/buffer stock wins programs at cost
- FY2024 revenue: $1.08B
- Vertical diversification reduces cyclicality
Quality and delivery leverage
- PPAP/scorecards drive penalties
- OTIF ≥95% / PPM ≤50–100 ppm (2024 OEM norms)
- KPIs enable preferred-supplier access
- Field failures flip leverage to buyers
- Traceability & reliability analytics protect position
Hyperscalers and OEMs squeeze pricing; design wins lock revenue, RFQs periodically reset leverage
Automotive OEMs and hyperscalers (combined hyperscaler capex >$100B in 2024) exert strong price and payment pressure; design wins lock revenue but invite continuous rebids. Certification and deep integration raise switching costs, yet model-refresh RFQs (every 4–6 years) reset leverage. Methode's FY2024 revenue: $1.08B; OTIF ≥95% and PPM ≤50–100 ppm govern penalties and supplier status.
| Metric | 2024 |
|---|---|
| Hyperscaler capex | >$100B |
| Methode FY2024 rev | $1.08B |
| OTIF target | ≥95% |
| PPM target | ≤50–100 |
Same Document Delivered
Methode Electronics Porter's Five Forces Analysis
This Porter’s Five Forces analysis of Methode Electronics provides a concise assessment of supplier power, buyer power, threat of new entrants, threat of substitutes, and competitive rivalry as they pertain to the company’s electronic components and solutions business. It identifies key industry drivers, strategic risks, and levers for competitive advantage. This preview shows the exact document you'll receive immediately after purchase—no surprises, no placeholders.

A Must-Have Tool for Decision-Makers
Methode Electronics faces moderate rivalry from diversified automotive and industrial electronics suppliers, strong buyer pressure from OEMs, and manageable supplier concentration for key components. Emerging technologies and substitutes raise strategic risks while scale and customer relationships are defensive assets. This brief overview hints at the complexity—unlock the full Porter's Five Forces Analysis for force-by-force ratings, visuals, and actionable strategic insight.
Suppliers Bargaining Power
Specialized components
Many inputs — ASICs, optical modules and high-temperature polymers — are niche and hard to substitute, limiting interchangeable sources. Suppliers with proprietary IP can command pricing and prioritization, and in 2024 tightness in specialty components persisted. Automotive and industrial qualification cycles typically run 12–24 months, reinforcing supplier lock-in. Methode mitigates via multi-sourcing and in-house engineering but cannot fully eliminate dependence.
Raw material concentration
Copper supply tightness (Chile ~28% of mine output), China’s ~60% dominance in rare earth production, and a semiconductor market near $600B in 2024 create cyclical constraints and geopolitical risk that boost suppliers’ leverage over Methode Electronics. Price volatility in 2024 transferred bargaining power upstream, with long-term contracts and hedging smoothing costs but failing to prevent shortages. Cost pass-through to customers has been partial and delayed, compressing margins.
Capex-intensive tooling
Custom tooling and test fixtures create program lock-in with suppliers, making switches costly due to sunk tooling investments, PPAP requalification and timeline risks. This elevates supplier leverage on change orders and ramp-ups, allowing pricing and delivery concessions. Volume commitments and vendor-managed inventory provide a trade-off, exchanging flexibility for improved terms and reduced unit costs.
Logistics and lead times
Complex global supply chains expose Methode to lead-time shocks, with industry lead times up roughly 25% versus pre-pandemic levels in 2024; scarce supplier capacity means vendors allocate to higher-margin OEMs first, pressuring order fulfillment. Buffer inventories mitigate disruption but typically raise working capital by double-digit percentages. Nearshoring or dual‑continent sourcing in 2024 reduced single-region vendor leverage for many electronics firms.
- lead-times +25% vs pre-2020
- capacity allocation favors higher-margin customers
- buffers increase working capital (double-digit %)
- nearshoring/dual sourcing lowers single-region dependency
Supplier ecosystem breadth
Supplier power up; $1.13B, lead-times +25%
Supplier power is elevated for niche ASICs, optical modules and high-temp polymers, driving pricing and allocation risk despite Methode’s $1.13B 2024 scale. Industry lead-times rose ~25% vs pre-2020 and global semiconductor market ~ $600B in 2024, amplifying supplier leverage; multi-sourcing, NPI collaboration and long-term contracts partially mitigate exposure.
| Metric | 2024 Value |
|---|---|
| Methode revenue | $1.13B |
| Lead-times vs pre-2020 | +25% |
| Global semi market | $600B |
| China rare earth share | ~60% |
| Chile copper mine share | ~28% |
What is included in the product
Detailed Word Document
Tailored Porter's Five Forces analysis for Methode Electronics that uncovers competitive drivers, customer and supplier power, barriers to entry, threat of substitutes, and emerging disruptions to assess pricing pressure and strategic positioning.
Customizable Excel Spreadsheet
Clear, one-sheet Porter's Five Forces for Methode Electronics—instantly visualize competitive pressure with a spider chart and customizable pressure levels so teams can swap in current data, copy into decks, and make faster strategic decisions without complex tools.
Customers Bargaining Power
OEM concentration
Automotive OEMs and cloud hyperscalers are highly concentrated, multi-billion-dollar buyers whose combined hyperscaler capex exceeded $100 billion in 2024, enabling aggressive pricing, strict payment terms and annual cost-downs. Design wins lock revenue but prompt continuous rebids and cost pressure. Deep relationships, on-time delivery and performance metrics (quality, yield, warranty) are critical to retain share.
High switching costs
Qualification requirements such as IATF 16949 and functional safety standard ISO 26262 plus deep software/ECU integration create high switching barriers that temper buyer power during program runs. Mid-program leverage is limited, but at model refresh—typically every 4–6 years—OEMs solicit competitive quotes to extract concessions. Methode can defend price at refresh by delivering differentiated electrical and software performance validated to those certifications.
Customization vs. commoditization
Customization in Custom HMI, power distribution and sensor assemblies reduces comparability and raises customer stickiness, supporting Methode Electronics which reported about $1.24 billion in revenue in fiscal 2024. Standard connectors and cables remain price-focused, shrinking margins. Methode captures premium where engineering value is clear and measurable. Outcome-based specs shift buying to total cost of ownership rather than unit price.
Demand cyclicality
Auto and consumer demand cyclicality increases buyer leverage in downturns; customers pushed Methode for inventory support and expedite/de-expedite flexibility during 2023–24, pressuring margins. Offering consignment or buffer stock won programs but raised working capital and reduced gross margin. Methode reported FY2024 revenue of $1.08B, and diversification across industrial and medical verticals helped smooth exposure.
- Buyers press inventory support and flexibility
- Consignment/buffer stock wins programs at cost
- FY2024 revenue: $1.08B
- Vertical diversification reduces cyclicality
Quality and delivery leverage
- PPAP/scorecards drive penalties
- OTIF ≥95% / PPM ≤50–100 ppm (2024 OEM norms)
- KPIs enable preferred-supplier access
- Field failures flip leverage to buyers
- Traceability & reliability analytics protect position
Hyperscalers and OEMs squeeze pricing; design wins lock revenue, RFQs periodically reset leverage
Automotive OEMs and hyperscalers (combined hyperscaler capex >$100B in 2024) exert strong price and payment pressure; design wins lock revenue but invite continuous rebids. Certification and deep integration raise switching costs, yet model-refresh RFQs (every 4–6 years) reset leverage. Methode's FY2024 revenue: $1.08B; OTIF ≥95% and PPM ≤50–100 ppm govern penalties and supplier status.
| Metric | 2024 |
|---|---|
| Hyperscaler capex | >$100B |
| Methode FY2024 rev | $1.08B |
| OTIF target | ≥95% |
| PPM target | ≤50–100 |
Same Document Delivered
Methode Electronics Porter's Five Forces Analysis
This Porter’s Five Forces analysis of Methode Electronics provides a concise assessment of supplier power, buyer power, threat of new entrants, threat of substitutes, and competitive rivalry as they pertain to the company’s electronic components and solutions business. It identifies key industry drivers, strategic risks, and levers for competitive advantage. This preview shows the exact document you'll receive immediately after purchase—no surprises, no placeholders.
Original: $10.00
-65%$10.00
$3.50Description
A Must-Have Tool for Decision-Makers
Methode Electronics faces moderate rivalry from diversified automotive and industrial electronics suppliers, strong buyer pressure from OEMs, and manageable supplier concentration for key components. Emerging technologies and substitutes raise strategic risks while scale and customer relationships are defensive assets. This brief overview hints at the complexity—unlock the full Porter's Five Forces Analysis for force-by-force ratings, visuals, and actionable strategic insight.
Suppliers Bargaining Power
Specialized components
Many inputs — ASICs, optical modules and high-temperature polymers — are niche and hard to substitute, limiting interchangeable sources. Suppliers with proprietary IP can command pricing and prioritization, and in 2024 tightness in specialty components persisted. Automotive and industrial qualification cycles typically run 12–24 months, reinforcing supplier lock-in. Methode mitigates via multi-sourcing and in-house engineering but cannot fully eliminate dependence.
Raw material concentration
Copper supply tightness (Chile ~28% of mine output), China’s ~60% dominance in rare earth production, and a semiconductor market near $600B in 2024 create cyclical constraints and geopolitical risk that boost suppliers’ leverage over Methode Electronics. Price volatility in 2024 transferred bargaining power upstream, with long-term contracts and hedging smoothing costs but failing to prevent shortages. Cost pass-through to customers has been partial and delayed, compressing margins.
Capex-intensive tooling
Custom tooling and test fixtures create program lock-in with suppliers, making switches costly due to sunk tooling investments, PPAP requalification and timeline risks. This elevates supplier leverage on change orders and ramp-ups, allowing pricing and delivery concessions. Volume commitments and vendor-managed inventory provide a trade-off, exchanging flexibility for improved terms and reduced unit costs.
Logistics and lead times
Complex global supply chains expose Methode to lead-time shocks, with industry lead times up roughly 25% versus pre-pandemic levels in 2024; scarce supplier capacity means vendors allocate to higher-margin OEMs first, pressuring order fulfillment. Buffer inventories mitigate disruption but typically raise working capital by double-digit percentages. Nearshoring or dual‑continent sourcing in 2024 reduced single-region vendor leverage for many electronics firms.
- lead-times +25% vs pre-2020
- capacity allocation favors higher-margin customers
- buffers increase working capital (double-digit %)
- nearshoring/dual sourcing lowers single-region dependency
Supplier ecosystem breadth
Supplier power up; $1.13B, lead-times +25%
Supplier power is elevated for niche ASICs, optical modules and high-temp polymers, driving pricing and allocation risk despite Methode’s $1.13B 2024 scale. Industry lead-times rose ~25% vs pre-2020 and global semiconductor market ~ $600B in 2024, amplifying supplier leverage; multi-sourcing, NPI collaboration and long-term contracts partially mitigate exposure.
| Metric | 2024 Value |
|---|---|
| Methode revenue | $1.13B |
| Lead-times vs pre-2020 | +25% |
| Global semi market | $600B |
| China rare earth share | ~60% |
| Chile copper mine share | ~28% |
What is included in the product
Detailed Word Document
Tailored Porter's Five Forces analysis for Methode Electronics that uncovers competitive drivers, customer and supplier power, barriers to entry, threat of substitutes, and emerging disruptions to assess pricing pressure and strategic positioning.
Customizable Excel Spreadsheet
Clear, one-sheet Porter's Five Forces for Methode Electronics—instantly visualize competitive pressure with a spider chart and customizable pressure levels so teams can swap in current data, copy into decks, and make faster strategic decisions without complex tools.
Customers Bargaining Power
OEM concentration
Automotive OEMs and cloud hyperscalers are highly concentrated, multi-billion-dollar buyers whose combined hyperscaler capex exceeded $100 billion in 2024, enabling aggressive pricing, strict payment terms and annual cost-downs. Design wins lock revenue but prompt continuous rebids and cost pressure. Deep relationships, on-time delivery and performance metrics (quality, yield, warranty) are critical to retain share.
High switching costs
Qualification requirements such as IATF 16949 and functional safety standard ISO 26262 plus deep software/ECU integration create high switching barriers that temper buyer power during program runs. Mid-program leverage is limited, but at model refresh—typically every 4–6 years—OEMs solicit competitive quotes to extract concessions. Methode can defend price at refresh by delivering differentiated electrical and software performance validated to those certifications.
Customization vs. commoditization
Customization in Custom HMI, power distribution and sensor assemblies reduces comparability and raises customer stickiness, supporting Methode Electronics which reported about $1.24 billion in revenue in fiscal 2024. Standard connectors and cables remain price-focused, shrinking margins. Methode captures premium where engineering value is clear and measurable. Outcome-based specs shift buying to total cost of ownership rather than unit price.
Demand cyclicality
Auto and consumer demand cyclicality increases buyer leverage in downturns; customers pushed Methode for inventory support and expedite/de-expedite flexibility during 2023–24, pressuring margins. Offering consignment or buffer stock won programs but raised working capital and reduced gross margin. Methode reported FY2024 revenue of $1.08B, and diversification across industrial and medical verticals helped smooth exposure.
- Buyers press inventory support and flexibility
- Consignment/buffer stock wins programs at cost
- FY2024 revenue: $1.08B
- Vertical diversification reduces cyclicality
Quality and delivery leverage
- PPAP/scorecards drive penalties
- OTIF ≥95% / PPM ≤50–100 ppm (2024 OEM norms)
- KPIs enable preferred-supplier access
- Field failures flip leverage to buyers
- Traceability & reliability analytics protect position
Hyperscalers and OEMs squeeze pricing; design wins lock revenue, RFQs periodically reset leverage
Automotive OEMs and hyperscalers (combined hyperscaler capex >$100B in 2024) exert strong price and payment pressure; design wins lock revenue but invite continuous rebids. Certification and deep integration raise switching costs, yet model-refresh RFQs (every 4–6 years) reset leverage. Methode's FY2024 revenue: $1.08B; OTIF ≥95% and PPM ≤50–100 ppm govern penalties and supplier status.
| Metric | 2024 |
|---|---|
| Hyperscaler capex | >$100B |
| Methode FY2024 rev | $1.08B |
| OTIF target | ≥95% |
| PPM target | ≤50–100 |
Same Document Delivered
Methode Electronics Porter's Five Forces Analysis
This Porter’s Five Forces analysis of Methode Electronics provides a concise assessment of supplier power, buyer power, threat of new entrants, threat of substitutes, and competitive rivalry as they pertain to the company’s electronic components and solutions business. It identifies key industry drivers, strategic risks, and levers for competitive advantage. This preview shows the exact document you'll receive immediately after purchase—no surprises, no placeholders.











