MetLife Boston Consulting Group Matrix

Actionable Strategy Starts Here
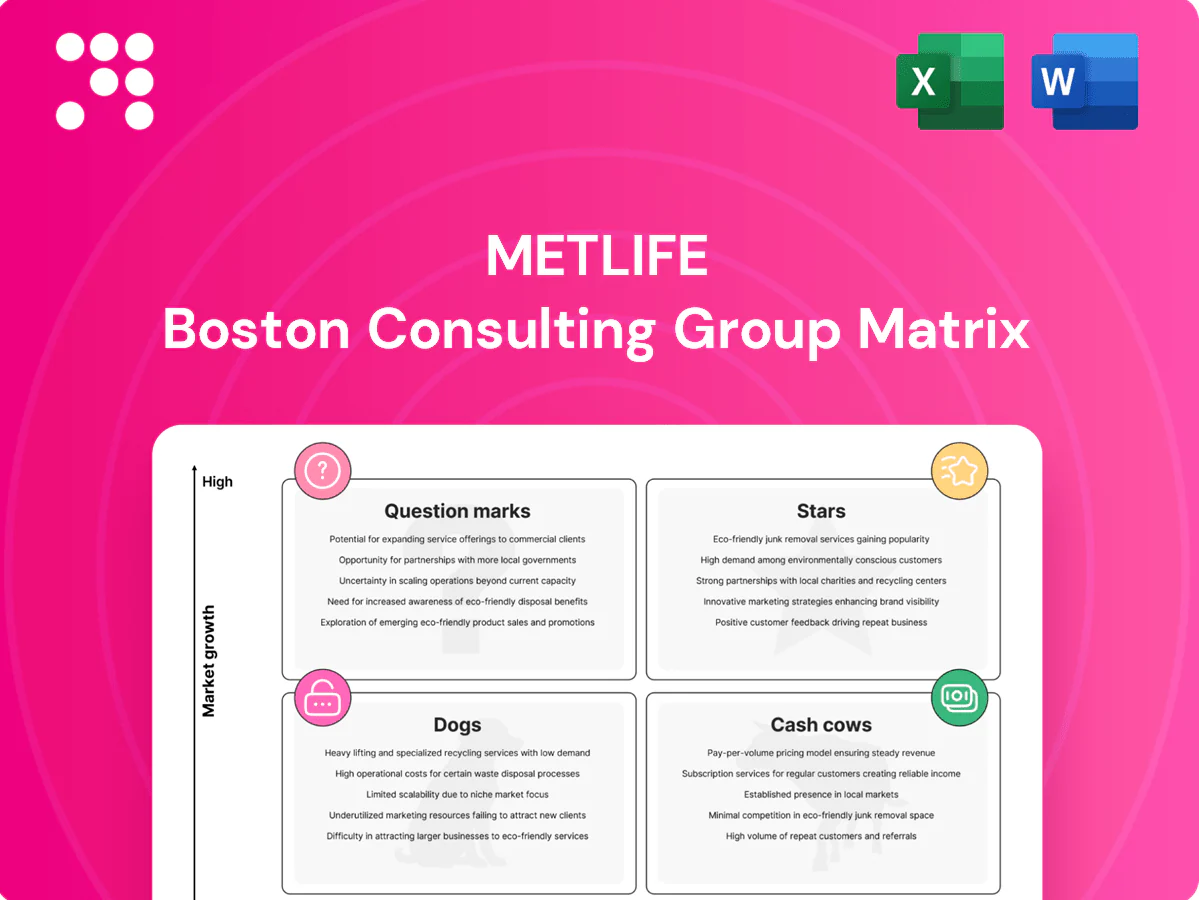
Quick snapshot: MetLife’s BCG Matrix shows which insurance lines are winning market share, which are steady cash cows, and which need tough choices—think protection vs. investment products. This preview teases the quadrant placements; the full BCG Matrix gives you precise rankings, revenue drivers, and actionable moves to reallocate capital or double down. Skip the guesswork—buy the complete report for a ready-to-use Word analysis plus an Excel summary that helps you present, decide, and act fast.
Stars

Group dental & vision
MetLife holds a leading slice of employer-paid dental and vision, with these offerings increasingly viewed as must-have benefits driving widening employer adoption. High renewal rates, large national accounts, and steady add-ons continually push MetLife’s share higher. Continued investment in marketing and broker relationships is needed to keep MetLife front-of-pack and lock in dominance as the market expands.
Group disability & absence
MetLife leverages strong scale and integrated administration with tight HRIS connections—serving approximately 100 million customers globally—to position group disability and absence in the leader lane. Demand is rising as employers modernize leave management and face tighter compliance, justifying ongoing investment in tech and service. The unit consumes capex and operating investment now, but maintaining share will convert growth into tomorrow’s cash cow.

Multinational benefits (pooling/captives)
Global employers demand consistency and savings, and MetLife’s network across 60+ countries delivers both; cross-border pooling volumes rose about 8% in 2024 as finance teams chased transparency and capital efficiency. Winning deals requires consultative selling and specialized operations, driving upfront cost premiums near 20%. The payoff is sticky, multi-country relationships with significant lifetime value and strategic heft for MetLife.

Emerging markets life & protection
Emerging markets life & protection are Stars: rising middle classes and expanding bancassurance drove LatAm premiums up ~9% and Asia ex-Japan ~11% in 2024, keeping protection growth well above GDP; MetLife leverages recognizable brands and bancassurance footholds across multiple markets while investing in agents, digital and compliance to sustain momentum.
- Rising middle class
- Expanding distribution
- Regulatory tailwinds
- Brand + bancassurance
- Ongoing spend on agents/digital/compliance
Voluntary benefits bundles
Employees increased payroll-funded voluntary enrollments about 12% year-over-year in 2024, driving clear growth in supplemental coverages; MetLife’s accident, critical illness and hospital indemnity breadth secures shelf space across benefits platforms.
Ongoing investment in enrollment technology, targeted communications and broker-led campaigns is required to convert interest into sustained adoption; scale plus this growth places MetLife’s voluntary bundles in star territory.
- 2024 uptake: ~12% YoY growth
- Product breadth: accident, critical illness, hospital indemnity
- Needs: enrollment tech, comms, broker campaigns
- Outcome: scale + growth = star
Benefits momentum: dental/vision, disability, cross-border + emerging markets surge
MetLife’s Stars—dental/vision, group disability, cross-border pooling, emerging-market protection and voluntary benefits—show strong 2024 momentum: dental/vision employer adoption and high renewals; group disability backed by ~100m customers; cross-border pooling +8% in 2024; LatAm premiums +9% and Asia ex-Japan +11%; voluntary uptake ~12% YoY. Continued marketing, tech and compliance investment needed to cement leadership and convert to cash cows.
| Product | 2024 metric | Footprint | Key spend |
|---|---|---|---|
| Dental/Vision | High renewals, rising employer adoption | US national | Marketing/broker |
| Group disability | Scale: ~100m customers | Global | Tech/service |
| Cross-border pooling | Volumes +8% | 60+ countries | Consultative sales |
| Emerging protection | LatAm +9%, Asia ex-JP +11% | Multiple markets | Agents/digital/compliance |
| Voluntary | Uptake ~12% YoY | Employer platforms | Enrollment tech/comms |
What is included in the product
 Detailed Word Document
In-depth review of MetLife’s products across BCG quadrants, with strategic moves—invest, hold, divest—and risks per quadrant.

 Customizable Excel Spreadsheet
One-page MetLife BCG matrix highlighting priorities and relieving execs from analysis overload.
Cash Cows

Individual life (mature markets)
Individual life in mature markets is a cash cow for MetLife: large in‑force blocks and strong brand trust generate predictable, durable cash flow. Growth is modest while disciplined underwriting preserves solid margins and low capex needs aside from maintenance and compliance. Focus is on milking the book by optimizing claims and lapse management and reallocating excess cash to fund targeted growth bets.
Annuities & retirement income
MetLife’s annuities and retirement income are classic cash cows: spread income and recurring fees from established blocks remain sizable, supporting stable cash generation; as of 2024 U.S. annuity reserves are about 3.0 trillion, reflecting market scale. The overall market is mature, though niches like income guarantees show renewed demand. Hedging and ALM processes are highly developed, keeping cost of hedging and capital efficient, so the franchise can be preserved and cash harvested for growth plays.

MetLife Investment Management (fee business)
Third‑party AUM plus general account management brings steady fees—MIM manages over $700 billion of AUM and advisement as of 2024, producing recurring fee income. Real estate and private credit platforms provide durable, sticky revenue and rising allocation. Growth is moderate, but operating leverage is attractive; maintain performance, distribution and risk and cash keeps coming.

Group life (core employer benefit)
Group life as MetLife's core employer benefit delivers high penetration, low churn and efficient administration, making it a dependable earner; MetLife serves about 90 million customers globally (company reporting through 2024), giving the business line scale and predictable cash flow.
The category is mature, requiring limited incremental spend beyond service and pricing discipline, allowing group life margins to subsidize newer benefit expansions and product investments.
Mortgage loans & real assets portfolio
Mortgage loans and real assets form MetLife’s cash-cow engine: conservative underwriting and long-duration holdings sustain stable spread and predictable income, with the company reporting roughly $685 billion in total assets at year-end 2023 supporting scale and credit depth. Incremental cost is minimal thanks to existing infrastructure, so disciplined allocation harvests steady cash flows rather than flashy growth.
- Stable spread: conservative underwriting
- Duration: long-duration assets support income
- Scale: ~685B total assets (YE 2023)
- Low incremental cost: infrastructure in place
- Strategy: disciplined allocation, cash-flow harvest
Annuities, AUM and group benefits: predictable cash flow powering targeted growth
MetLife cash cows—individual life, annuities, group benefits, mortgage loans and real assets—generate predictable, low‑capex cash flow from large in‑force books and disciplined underwriting. U.S. annuity reserves ~3.0T (2024), MIM AUM >700B (2024), ~90M customers (through 2024), total assets ~685B (YE2023); excess cash funds targeted growth. Focus: optimize lapses/claims, ALM/hedging, and redeploy cash.
| Line | Metric |
|---|---|
| Annuities | Reserves ~3.0T (2024) |
| Asset Mgmt | MIM AUM >700B (2024) |
| Customers | ~90M (through 2024) |
| Total assets | ~685B (YE2023) |
What You’re Viewing Is Included
MetLife BCG Matrix
The MetLife BCG Matrix you're previewing on this page is the exact same polished document you'll receive after purchase. No watermarks, no placeholder text—just a fully formatted, strategy-ready report tailored for portfolio assessment. Built with market-backed insights and clear visuals, the file is immediately usable for presentations or internal planning. After purchase you'll get the same editable file sent straight to your inbox—no surprises, no extra steps.

Actionable Strategy Starts Here
Quick snapshot: MetLife’s BCG Matrix shows which insurance lines are winning market share, which are steady cash cows, and which need tough choices—think protection vs. investment products. This preview teases the quadrant placements; the full BCG Matrix gives you precise rankings, revenue drivers, and actionable moves to reallocate capital or double down. Skip the guesswork—buy the complete report for a ready-to-use Word analysis plus an Excel summary that helps you present, decide, and act fast.
Stars
Group dental & vision
MetLife holds a leading slice of employer-paid dental and vision, with these offerings increasingly viewed as must-have benefits driving widening employer adoption. High renewal rates, large national accounts, and steady add-ons continually push MetLife’s share higher. Continued investment in marketing and broker relationships is needed to keep MetLife front-of-pack and lock in dominance as the market expands.
Group disability & absence
MetLife leverages strong scale and integrated administration with tight HRIS connections—serving approximately 100 million customers globally—to position group disability and absence in the leader lane. Demand is rising as employers modernize leave management and face tighter compliance, justifying ongoing investment in tech and service. The unit consumes capex and operating investment now, but maintaining share will convert growth into tomorrow’s cash cow.
Multinational benefits (pooling/captives)
Global employers demand consistency and savings, and MetLife’s network across 60+ countries delivers both; cross-border pooling volumes rose about 8% in 2024 as finance teams chased transparency and capital efficiency. Winning deals requires consultative selling and specialized operations, driving upfront cost premiums near 20%. The payoff is sticky, multi-country relationships with significant lifetime value and strategic heft for MetLife.
Emerging markets life & protection
Emerging markets life & protection are Stars: rising middle classes and expanding bancassurance drove LatAm premiums up ~9% and Asia ex-Japan ~11% in 2024, keeping protection growth well above GDP; MetLife leverages recognizable brands and bancassurance footholds across multiple markets while investing in agents, digital and compliance to sustain momentum.
- Rising middle class
- Expanding distribution
- Regulatory tailwinds
- Brand + bancassurance
- Ongoing spend on agents/digital/compliance
Voluntary benefits bundles
Employees increased payroll-funded voluntary enrollments about 12% year-over-year in 2024, driving clear growth in supplemental coverages; MetLife’s accident, critical illness and hospital indemnity breadth secures shelf space across benefits platforms.
Ongoing investment in enrollment technology, targeted communications and broker-led campaigns is required to convert interest into sustained adoption; scale plus this growth places MetLife’s voluntary bundles in star territory.
- 2024 uptake: ~12% YoY growth
- Product breadth: accident, critical illness, hospital indemnity
- Needs: enrollment tech, comms, broker campaigns
- Outcome: scale + growth = star
Benefits momentum: dental/vision, disability, cross-border + emerging markets surge
MetLife’s Stars—dental/vision, group disability, cross-border pooling, emerging-market protection and voluntary benefits—show strong 2024 momentum: dental/vision employer adoption and high renewals; group disability backed by ~100m customers; cross-border pooling +8% in 2024; LatAm premiums +9% and Asia ex-Japan +11%; voluntary uptake ~12% YoY. Continued marketing, tech and compliance investment needed to cement leadership and convert to cash cows.
| Product | 2024 metric | Footprint | Key spend |
|---|---|---|---|
| Dental/Vision | High renewals, rising employer adoption | US national | Marketing/broker |
| Group disability | Scale: ~100m customers | Global | Tech/service |
| Cross-border pooling | Volumes +8% | 60+ countries | Consultative sales |
| Emerging protection | LatAm +9%, Asia ex-JP +11% | Multiple markets | Agents/digital/compliance |
| Voluntary | Uptake ~12% YoY | Employer platforms | Enrollment tech/comms |
What is included in the product
Detailed Word Document
In-depth review of MetLife’s products across BCG quadrants, with strategic moves—invest, hold, divest—and risks per quadrant.
Customizable Excel Spreadsheet
One-page MetLife BCG matrix highlighting priorities and relieving execs from analysis overload.
Cash Cows
Individual life (mature markets)
Individual life in mature markets is a cash cow for MetLife: large in‑force blocks and strong brand trust generate predictable, durable cash flow. Growth is modest while disciplined underwriting preserves solid margins and low capex needs aside from maintenance and compliance. Focus is on milking the book by optimizing claims and lapse management and reallocating excess cash to fund targeted growth bets.
Annuities & retirement income
MetLife’s annuities and retirement income are classic cash cows: spread income and recurring fees from established blocks remain sizable, supporting stable cash generation; as of 2024 U.S. annuity reserves are about 3.0 trillion, reflecting market scale. The overall market is mature, though niches like income guarantees show renewed demand. Hedging and ALM processes are highly developed, keeping cost of hedging and capital efficient, so the franchise can be preserved and cash harvested for growth plays.
MetLife Investment Management (fee business)
Third‑party AUM plus general account management brings steady fees—MIM manages over $700 billion of AUM and advisement as of 2024, producing recurring fee income. Real estate and private credit platforms provide durable, sticky revenue and rising allocation. Growth is moderate, but operating leverage is attractive; maintain performance, distribution and risk and cash keeps coming.
Group life (core employer benefit)
Group life as MetLife's core employer benefit delivers high penetration, low churn and efficient administration, making it a dependable earner; MetLife serves about 90 million customers globally (company reporting through 2024), giving the business line scale and predictable cash flow.
The category is mature, requiring limited incremental spend beyond service and pricing discipline, allowing group life margins to subsidize newer benefit expansions and product investments.
Mortgage loans & real assets portfolio
Mortgage loans and real assets form MetLife’s cash-cow engine: conservative underwriting and long-duration holdings sustain stable spread and predictable income, with the company reporting roughly $685 billion in total assets at year-end 2023 supporting scale and credit depth. Incremental cost is minimal thanks to existing infrastructure, so disciplined allocation harvests steady cash flows rather than flashy growth.
- Stable spread: conservative underwriting
- Duration: long-duration assets support income
- Scale: ~685B total assets (YE 2023)
- Low incremental cost: infrastructure in place
- Strategy: disciplined allocation, cash-flow harvest
Annuities, AUM and group benefits: predictable cash flow powering targeted growth
MetLife cash cows—individual life, annuities, group benefits, mortgage loans and real assets—generate predictable, low‑capex cash flow from large in‑force books and disciplined underwriting. U.S. annuity reserves ~3.0T (2024), MIM AUM >700B (2024), ~90M customers (through 2024), total assets ~685B (YE2023); excess cash funds targeted growth. Focus: optimize lapses/claims, ALM/hedging, and redeploy cash.
| Line | Metric |
|---|---|
| Annuities | Reserves ~3.0T (2024) |
| Asset Mgmt | MIM AUM >700B (2024) |
| Customers | ~90M (through 2024) |
| Total assets | ~685B (YE2023) |
What You’re Viewing Is Included
MetLife BCG Matrix
The MetLife BCG Matrix you're previewing on this page is the exact same polished document you'll receive after purchase. No watermarks, no placeholder text—just a fully formatted, strategy-ready report tailored for portfolio assessment. Built with market-backed insights and clear visuals, the file is immediately usable for presentations or internal planning. After purchase you'll get the same editable file sent straight to your inbox—no surprises, no extra steps.
Description
Actionable Strategy Starts Here
Quick snapshot: MetLife’s BCG Matrix shows which insurance lines are winning market share, which are steady cash cows, and which need tough choices—think protection vs. investment products. This preview teases the quadrant placements; the full BCG Matrix gives you precise rankings, revenue drivers, and actionable moves to reallocate capital or double down. Skip the guesswork—buy the complete report for a ready-to-use Word analysis plus an Excel summary that helps you present, decide, and act fast.
Stars
Group dental & vision
MetLife holds a leading slice of employer-paid dental and vision, with these offerings increasingly viewed as must-have benefits driving widening employer adoption. High renewal rates, large national accounts, and steady add-ons continually push MetLife’s share higher. Continued investment in marketing and broker relationships is needed to keep MetLife front-of-pack and lock in dominance as the market expands.
Group disability & absence
MetLife leverages strong scale and integrated administration with tight HRIS connections—serving approximately 100 million customers globally—to position group disability and absence in the leader lane. Demand is rising as employers modernize leave management and face tighter compliance, justifying ongoing investment in tech and service. The unit consumes capex and operating investment now, but maintaining share will convert growth into tomorrow’s cash cow.
Multinational benefits (pooling/captives)
Global employers demand consistency and savings, and MetLife’s network across 60+ countries delivers both; cross-border pooling volumes rose about 8% in 2024 as finance teams chased transparency and capital efficiency. Winning deals requires consultative selling and specialized operations, driving upfront cost premiums near 20%. The payoff is sticky, multi-country relationships with significant lifetime value and strategic heft for MetLife.
Emerging markets life & protection
Emerging markets life & protection are Stars: rising middle classes and expanding bancassurance drove LatAm premiums up ~9% and Asia ex-Japan ~11% in 2024, keeping protection growth well above GDP; MetLife leverages recognizable brands and bancassurance footholds across multiple markets while investing in agents, digital and compliance to sustain momentum.
- Rising middle class
- Expanding distribution
- Regulatory tailwinds
- Brand + bancassurance
- Ongoing spend on agents/digital/compliance
Voluntary benefits bundles
Employees increased payroll-funded voluntary enrollments about 12% year-over-year in 2024, driving clear growth in supplemental coverages; MetLife’s accident, critical illness and hospital indemnity breadth secures shelf space across benefits platforms.
Ongoing investment in enrollment technology, targeted communications and broker-led campaigns is required to convert interest into sustained adoption; scale plus this growth places MetLife’s voluntary bundles in star territory.
- 2024 uptake: ~12% YoY growth
- Product breadth: accident, critical illness, hospital indemnity
- Needs: enrollment tech, comms, broker campaigns
- Outcome: scale + growth = star
Benefits momentum: dental/vision, disability, cross-border + emerging markets surge
MetLife’s Stars—dental/vision, group disability, cross-border pooling, emerging-market protection and voluntary benefits—show strong 2024 momentum: dental/vision employer adoption and high renewals; group disability backed by ~100m customers; cross-border pooling +8% in 2024; LatAm premiums +9% and Asia ex-Japan +11%; voluntary uptake ~12% YoY. Continued marketing, tech and compliance investment needed to cement leadership and convert to cash cows.
| Product | 2024 metric | Footprint | Key spend |
|---|---|---|---|
| Dental/Vision | High renewals, rising employer adoption | US national | Marketing/broker |
| Group disability | Scale: ~100m customers | Global | Tech/service |
| Cross-border pooling | Volumes +8% | 60+ countries | Consultative sales |
| Emerging protection | LatAm +9%, Asia ex-JP +11% | Multiple markets | Agents/digital/compliance |
| Voluntary | Uptake ~12% YoY | Employer platforms | Enrollment tech/comms |
What is included in the product
Detailed Word Document
In-depth review of MetLife’s products across BCG quadrants, with strategic moves—invest, hold, divest—and risks per quadrant.
Customizable Excel Spreadsheet
One-page MetLife BCG matrix highlighting priorities and relieving execs from analysis overload.
Cash Cows
Individual life (mature markets)
Individual life in mature markets is a cash cow for MetLife: large in‑force blocks and strong brand trust generate predictable, durable cash flow. Growth is modest while disciplined underwriting preserves solid margins and low capex needs aside from maintenance and compliance. Focus is on milking the book by optimizing claims and lapse management and reallocating excess cash to fund targeted growth bets.
Annuities & retirement income
MetLife’s annuities and retirement income are classic cash cows: spread income and recurring fees from established blocks remain sizable, supporting stable cash generation; as of 2024 U.S. annuity reserves are about 3.0 trillion, reflecting market scale. The overall market is mature, though niches like income guarantees show renewed demand. Hedging and ALM processes are highly developed, keeping cost of hedging and capital efficient, so the franchise can be preserved and cash harvested for growth plays.
MetLife Investment Management (fee business)
Third‑party AUM plus general account management brings steady fees—MIM manages over $700 billion of AUM and advisement as of 2024, producing recurring fee income. Real estate and private credit platforms provide durable, sticky revenue and rising allocation. Growth is moderate, but operating leverage is attractive; maintain performance, distribution and risk and cash keeps coming.
Group life (core employer benefit)
Group life as MetLife's core employer benefit delivers high penetration, low churn and efficient administration, making it a dependable earner; MetLife serves about 90 million customers globally (company reporting through 2024), giving the business line scale and predictable cash flow.
The category is mature, requiring limited incremental spend beyond service and pricing discipline, allowing group life margins to subsidize newer benefit expansions and product investments.
Mortgage loans & real assets portfolio
Mortgage loans and real assets form MetLife’s cash-cow engine: conservative underwriting and long-duration holdings sustain stable spread and predictable income, with the company reporting roughly $685 billion in total assets at year-end 2023 supporting scale and credit depth. Incremental cost is minimal thanks to existing infrastructure, so disciplined allocation harvests steady cash flows rather than flashy growth.
- Stable spread: conservative underwriting
- Duration: long-duration assets support income
- Scale: ~685B total assets (YE 2023)
- Low incremental cost: infrastructure in place
- Strategy: disciplined allocation, cash-flow harvest
Annuities, AUM and group benefits: predictable cash flow powering targeted growth
MetLife cash cows—individual life, annuities, group benefits, mortgage loans and real assets—generate predictable, low‑capex cash flow from large in‑force books and disciplined underwriting. U.S. annuity reserves ~3.0T (2024), MIM AUM >700B (2024), ~90M customers (through 2024), total assets ~685B (YE2023); excess cash funds targeted growth. Focus: optimize lapses/claims, ALM/hedging, and redeploy cash.
| Line | Metric |
|---|---|
| Annuities | Reserves ~3.0T (2024) |
| Asset Mgmt | MIM AUM >700B (2024) |
| Customers | ~90M (through 2024) |
| Total assets | ~685B (YE2023) |
What You’re Viewing Is Included
MetLife BCG Matrix
The MetLife BCG Matrix you're previewing on this page is the exact same polished document you'll receive after purchase. No watermarks, no placeholder text—just a fully formatted, strategy-ready report tailored for portfolio assessment. Built with market-backed insights and clear visuals, the file is immediately usable for presentations or internal planning. After purchase you'll get the same editable file sent straight to your inbox—no surprises, no extra steps.











