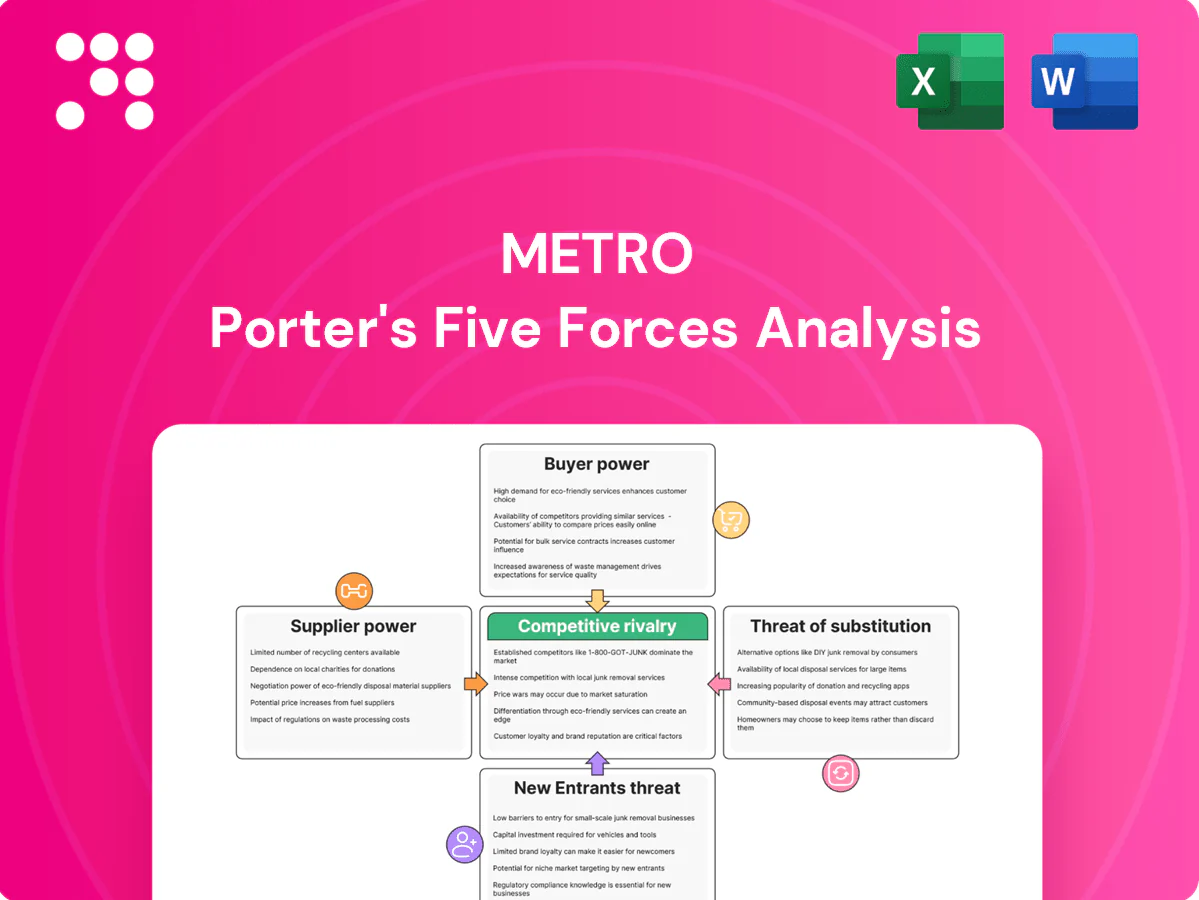
Metro Porter's Five Forces Analysis

From Overview to Strategy Blueprint
Metro's Porter's Five Forces snapshot highlights competitive rivalry, supplier and buyer power, threat of entrants, and substitute risks in concise terms. It flags where Metro holds leverage and where vulnerabilities lie. This brief only scratches the surface. Unlock the full Porter's Five Forces Analysis to gain detailed, actionable insights tailored to Metro.
Suppliers Bargaining Power

Consolidated CPG brands
Consolidated CPG brands wield significant leverage—top 10 global packaged-goods firms account for roughly half of category sales (Euromonitor 2024), giving them brand equity and ad muscle that compresses retailer margins. Metro offsets this with multi-year contracts, scale pooling across grocery and pharmacy, and vendor scorecards. Must-carry national brands remain traffic drivers, limiting Metro’s negotiating leverage, while reliance on promotional funding complicates deal structures.
Fragmented fresh producers
Fruits, vegetables and some meat categories are highly fragmented, giving Metro multiple sourcing options across over 600 food stores in Quebec and Ontario, which strengthens its bargaining power and supply flexibility. Weather shocks and seasonality periodically tighten supply and push wholesale prices higher. Local sourcing preferences in Quebec and Ontario can limit substitution, especially for provincially promoted products. This duality creates both leverage and occasional cost vulnerability for Metro.

Private label leverage
Metro’s private labels such as Irresistibles and Selection function as credible alternatives to national brands, strengthening Metro’s negotiating leverage by enabling margin-accretive substitutions and price flexibility. This reduces dependence on any single supplier and limits supplier hold-up risk. Effective leverage hinges on reliable contract manufacturers and rigorous quality control to sustain brand trust and consistent margins.

Regulated agri supply chains
Canadian supply management in dairy, poultry and eggs caps volumes and supports farm-gate prices, with Canadian dairy retail prices roughly 25% above US levels in 2024; this limits Metro’s ability to drive down staple costs. Predictable quotas aid procurement planning but compress retail pricing flexibility, while import quotas and high tariffs (TRQs) keep supplier power elevated.
- Supply management: national quotas
- Dairy retail ≈25% above US (2024)
- Imports often <5% via TRQs
- Higher farm-gate prices, limited price leverage
Pharma and health supply
With drugstores Metro interfaces with pharma manufacturers and wholesalers under strict regulation, where formularies and government pricing mechanisms (eg Medicaid rebates in the US) cap reimbursement and restrict negotiation. Generics accounted for about 90% of US prescriptions by volume in 2024, which limits supplier pricing power on branded drugs but shifts leverage to generic makers. Scale from Metro’s pharmacy network improves terms on OTC and front-store health SKUs, yet compliance costs and episodic shortages elevate supplier influence and risk.
- Regulation: tight pricing controls reduce flexibility
- Generics 2024: ~90% of US prescriptions by volume (FDA)
- Scale: stronger on OTC/front-store, weaker on regulated formulary items
- Risks: compliance burdens and supply shortages raise supplier leverage
Concentrated CPGs, supply-managed dairy and seasonality limit retailer supplier leverage
Concentrated CPGs (top 10 ≈50% category sales, Euromonitor 2024) and supply-managed dairy/poultry (dairy retail ≈25% above US, 2024) limit Metro’s supplier leverage despite multi-year contracts, private-labels (Irresistibles/Selection) and scale across >600 stores. Generics ≈90% Rx vol (US, 2024) shifts pharmacy leverage to generic makers, while weather and seasonality create episodic supplier risk.
| Metric | 2024 |
|---|---|
| Top-10 CPG share | ≈50% (Euromonitor) |
| Dairy retail vs US | ≈+25% |
| Stores (QC+ON) | >600 |
| Generics Rx vol | ≈90% (US) |
What is included in the product
 Detailed Word Document
Comprehensive Porter’s Five Forces analysis tailored for Metro, uncovering competitive dynamics, buyer and supplier power, entry barriers, substitute threats, and disruptive risks—supported by industry data and strategic implications for pricing, profitability, and defensive opportunities.

 Customizable Excel Spreadsheet
A single-sheet Metro Porter Five Forces summary that clarifies competitive pressures at a glance, with editable force levels and radar-chart visualization—ideal for rapid strategic decisions, slide-ready reporting, and quick scenario comparisons without technical overhead.
Customers Bargaining Power

Price-sensitive shoppers
Canadian shoppers remained highly price-aware in 2024 as grocery prices rose about 3.1% year-over-year, fueling deal-chasing and outsize sensitivity to promotions. Metro’s discount banners like Super C and frequent promotions reduce defection risk by offering lower-price anchors against national rivals. However persistent price gaps versus Walmart and Costco—often several percentage points—keep buyer bargaining power elevated, making perceived value critical to retain baskets.
Low switching costs
Low switching costs allow shoppers to move among Loblaw (~27% share in 2024), Sobeys (~20%), Walmart (~12%), Costco (~7%) and dollar/online rivals with little friction. Apps, digital flyers and price-matching heighten price transparency and reduce loyalty depth. Convenience and proximity partially counteract this ease, but rewards programs rarely lock in customers long-term.

Loyalty and data programs
Metro’s loyalty ecosystem, with over 5 million members as of 2024, and personalization capabilities can materially dampen buyer power. Tailored offers raise perceived value and drive repeat visits, reportedly increasing visit frequency by double-digit percentages in similar retail programs. Data-driven pricing narrows promotional leakage, but effectiveness hinges on reward richness versus competitors’ offers.

Omnichannel expectations
Shoppers now demand omnichannel options—click-and-collect, precise delivery windows and reliable substitutions—and 2024 data show about 62% prioritize delivery timing when choosing a grocer. Service lapses cause rapid churn to rivals and platform marketplaces, so speed and picking accuracy materially reduce buyer leverage. Fee structures and assortment breadth remain key differentiators.
- Delivery-window priority: 62%
- Click-and-collect adoption: high
- Churn sensitivity: rapid
- Differentiators: fees, assortment
Independent/franchise partners
Distribution and franchising create a cohort of B2B buyers with significant negotiating clout; Metro operates around 750 stores in 34 countries (2024). Their performance and satisfaction directly affect volumes and network stability. Contract terms balance support services with required standards, and regional concentration can amplify partner influence.
- B2B bargaining strength: consolidated partners
- Operational impact: volumes tied to partner performance
- Contracts: trade-offs between support and compliance
- Concentration risk: regional clusters raise leverage
Buyer power high: 3.1% inflation, 62% want delivery
Retail customers in 2024 held elevated bargaining power as grocery inflation of 3.1% drove price sensitivity and promotion chasing. Metro’s loyalty base (5m members) and discount banners mitigate churn but price gaps to Walmart/Costco sustain leverage. Omnichannel demands (62% prioritize delivery window) and low switching costs keep buyer power high.
| Metric | 2024 |
|---|---|
| Grocery inflation | 3.1% |
| Metro loyalty members | 5,000,000 |
| Delivery priority | 62% |
| Market shares (Loblaw/Sobeys/Walmart/Costco) | 27/20/12/7% |
Full Version Awaits
Metro Porter's Five Forces Analysis
This preview shows the exact Metro Porter's Five Forces Analysis you'll receive upon purchase—no placeholders or samples. The document displayed is the full, professionally formatted analysis, ready for download and immediate use. You're viewing the final deliverable; buy and get instant access to this same file.

From Overview to Strategy Blueprint
Metro's Porter's Five Forces snapshot highlights competitive rivalry, supplier and buyer power, threat of entrants, and substitute risks in concise terms. It flags where Metro holds leverage and where vulnerabilities lie. This brief only scratches the surface. Unlock the full Porter's Five Forces Analysis to gain detailed, actionable insights tailored to Metro.
Suppliers Bargaining Power
Consolidated CPG brands
Consolidated CPG brands wield significant leverage—top 10 global packaged-goods firms account for roughly half of category sales (Euromonitor 2024), giving them brand equity and ad muscle that compresses retailer margins. Metro offsets this with multi-year contracts, scale pooling across grocery and pharmacy, and vendor scorecards. Must-carry national brands remain traffic drivers, limiting Metro’s negotiating leverage, while reliance on promotional funding complicates deal structures.
Fragmented fresh producers
Fruits, vegetables and some meat categories are highly fragmented, giving Metro multiple sourcing options across over 600 food stores in Quebec and Ontario, which strengthens its bargaining power and supply flexibility. Weather shocks and seasonality periodically tighten supply and push wholesale prices higher. Local sourcing preferences in Quebec and Ontario can limit substitution, especially for provincially promoted products. This duality creates both leverage and occasional cost vulnerability for Metro.
Private label leverage
Metro’s private labels such as Irresistibles and Selection function as credible alternatives to national brands, strengthening Metro’s negotiating leverage by enabling margin-accretive substitutions and price flexibility. This reduces dependence on any single supplier and limits supplier hold-up risk. Effective leverage hinges on reliable contract manufacturers and rigorous quality control to sustain brand trust and consistent margins.
Regulated agri supply chains
Canadian supply management in dairy, poultry and eggs caps volumes and supports farm-gate prices, with Canadian dairy retail prices roughly 25% above US levels in 2024; this limits Metro’s ability to drive down staple costs. Predictable quotas aid procurement planning but compress retail pricing flexibility, while import quotas and high tariffs (TRQs) keep supplier power elevated.
- Supply management: national quotas
- Dairy retail ≈25% above US (2024)
- Imports often <5% via TRQs
- Higher farm-gate prices, limited price leverage
Pharma and health supply
With drugstores Metro interfaces with pharma manufacturers and wholesalers under strict regulation, where formularies and government pricing mechanisms (eg Medicaid rebates in the US) cap reimbursement and restrict negotiation. Generics accounted for about 90% of US prescriptions by volume in 2024, which limits supplier pricing power on branded drugs but shifts leverage to generic makers. Scale from Metro’s pharmacy network improves terms on OTC and front-store health SKUs, yet compliance costs and episodic shortages elevate supplier influence and risk.
- Regulation: tight pricing controls reduce flexibility
- Generics 2024: ~90% of US prescriptions by volume (FDA)
- Scale: stronger on OTC/front-store, weaker on regulated formulary items
- Risks: compliance burdens and supply shortages raise supplier leverage
Concentrated CPGs, supply-managed dairy and seasonality limit retailer supplier leverage
Concentrated CPGs (top 10 ≈50% category sales, Euromonitor 2024) and supply-managed dairy/poultry (dairy retail ≈25% above US, 2024) limit Metro’s supplier leverage despite multi-year contracts, private-labels (Irresistibles/Selection) and scale across >600 stores. Generics ≈90% Rx vol (US, 2024) shifts pharmacy leverage to generic makers, while weather and seasonality create episodic supplier risk.
| Metric | 2024 |
|---|---|
| Top-10 CPG share | ≈50% (Euromonitor) |
| Dairy retail vs US | ≈+25% |
| Stores (QC+ON) | >600 |
| Generics Rx vol | ≈90% (US) |
What is included in the product
Detailed Word Document
Comprehensive Porter’s Five Forces analysis tailored for Metro, uncovering competitive dynamics, buyer and supplier power, entry barriers, substitute threats, and disruptive risks—supported by industry data and strategic implications for pricing, profitability, and defensive opportunities.
Customizable Excel Spreadsheet
A single-sheet Metro Porter Five Forces summary that clarifies competitive pressures at a glance, with editable force levels and radar-chart visualization—ideal for rapid strategic decisions, slide-ready reporting, and quick scenario comparisons without technical overhead.
Customers Bargaining Power
Price-sensitive shoppers
Canadian shoppers remained highly price-aware in 2024 as grocery prices rose about 3.1% year-over-year, fueling deal-chasing and outsize sensitivity to promotions. Metro’s discount banners like Super C and frequent promotions reduce defection risk by offering lower-price anchors against national rivals. However persistent price gaps versus Walmart and Costco—often several percentage points—keep buyer bargaining power elevated, making perceived value critical to retain baskets.
Low switching costs
Low switching costs allow shoppers to move among Loblaw (~27% share in 2024), Sobeys (~20%), Walmart (~12%), Costco (~7%) and dollar/online rivals with little friction. Apps, digital flyers and price-matching heighten price transparency and reduce loyalty depth. Convenience and proximity partially counteract this ease, but rewards programs rarely lock in customers long-term.
Loyalty and data programs
Metro’s loyalty ecosystem, with over 5 million members as of 2024, and personalization capabilities can materially dampen buyer power. Tailored offers raise perceived value and drive repeat visits, reportedly increasing visit frequency by double-digit percentages in similar retail programs. Data-driven pricing narrows promotional leakage, but effectiveness hinges on reward richness versus competitors’ offers.
Omnichannel expectations
Shoppers now demand omnichannel options—click-and-collect, precise delivery windows and reliable substitutions—and 2024 data show about 62% prioritize delivery timing when choosing a grocer. Service lapses cause rapid churn to rivals and platform marketplaces, so speed and picking accuracy materially reduce buyer leverage. Fee structures and assortment breadth remain key differentiators.
- Delivery-window priority: 62%
- Click-and-collect adoption: high
- Churn sensitivity: rapid
- Differentiators: fees, assortment
Independent/franchise partners
Distribution and franchising create a cohort of B2B buyers with significant negotiating clout; Metro operates around 750 stores in 34 countries (2024). Their performance and satisfaction directly affect volumes and network stability. Contract terms balance support services with required standards, and regional concentration can amplify partner influence.
- B2B bargaining strength: consolidated partners
- Operational impact: volumes tied to partner performance
- Contracts: trade-offs between support and compliance
- Concentration risk: regional clusters raise leverage
Buyer power high: 3.1% inflation, 62% want delivery
Retail customers in 2024 held elevated bargaining power as grocery inflation of 3.1% drove price sensitivity and promotion chasing. Metro’s loyalty base (5m members) and discount banners mitigate churn but price gaps to Walmart/Costco sustain leverage. Omnichannel demands (62% prioritize delivery window) and low switching costs keep buyer power high.
| Metric | 2024 |
|---|---|
| Grocery inflation | 3.1% |
| Metro loyalty members | 5,000,000 |
| Delivery priority | 62% |
| Market shares (Loblaw/Sobeys/Walmart/Costco) | 27/20/12/7% |
Full Version Awaits
Metro Porter's Five Forces Analysis
This preview shows the exact Metro Porter's Five Forces Analysis you'll receive upon purchase—no placeholders or samples. The document displayed is the full, professionally formatted analysis, ready for download and immediate use. You're viewing the final deliverable; buy and get instant access to this same file.
Original: $10.00
-65%$10.00
$3.50Description
From Overview to Strategy Blueprint
Metro's Porter's Five Forces snapshot highlights competitive rivalry, supplier and buyer power, threat of entrants, and substitute risks in concise terms. It flags where Metro holds leverage and where vulnerabilities lie. This brief only scratches the surface. Unlock the full Porter's Five Forces Analysis to gain detailed, actionable insights tailored to Metro.
Suppliers Bargaining Power
Consolidated CPG brands
Consolidated CPG brands wield significant leverage—top 10 global packaged-goods firms account for roughly half of category sales (Euromonitor 2024), giving them brand equity and ad muscle that compresses retailer margins. Metro offsets this with multi-year contracts, scale pooling across grocery and pharmacy, and vendor scorecards. Must-carry national brands remain traffic drivers, limiting Metro’s negotiating leverage, while reliance on promotional funding complicates deal structures.
Fragmented fresh producers
Fruits, vegetables and some meat categories are highly fragmented, giving Metro multiple sourcing options across over 600 food stores in Quebec and Ontario, which strengthens its bargaining power and supply flexibility. Weather shocks and seasonality periodically tighten supply and push wholesale prices higher. Local sourcing preferences in Quebec and Ontario can limit substitution, especially for provincially promoted products. This duality creates both leverage and occasional cost vulnerability for Metro.
Private label leverage
Metro’s private labels such as Irresistibles and Selection function as credible alternatives to national brands, strengthening Metro’s negotiating leverage by enabling margin-accretive substitutions and price flexibility. This reduces dependence on any single supplier and limits supplier hold-up risk. Effective leverage hinges on reliable contract manufacturers and rigorous quality control to sustain brand trust and consistent margins.
Regulated agri supply chains
Canadian supply management in dairy, poultry and eggs caps volumes and supports farm-gate prices, with Canadian dairy retail prices roughly 25% above US levels in 2024; this limits Metro’s ability to drive down staple costs. Predictable quotas aid procurement planning but compress retail pricing flexibility, while import quotas and high tariffs (TRQs) keep supplier power elevated.
- Supply management: national quotas
- Dairy retail ≈25% above US (2024)
- Imports often <5% via TRQs
- Higher farm-gate prices, limited price leverage
Pharma and health supply
With drugstores Metro interfaces with pharma manufacturers and wholesalers under strict regulation, where formularies and government pricing mechanisms (eg Medicaid rebates in the US) cap reimbursement and restrict negotiation. Generics accounted for about 90% of US prescriptions by volume in 2024, which limits supplier pricing power on branded drugs but shifts leverage to generic makers. Scale from Metro’s pharmacy network improves terms on OTC and front-store health SKUs, yet compliance costs and episodic shortages elevate supplier influence and risk.
- Regulation: tight pricing controls reduce flexibility
- Generics 2024: ~90% of US prescriptions by volume (FDA)
- Scale: stronger on OTC/front-store, weaker on regulated formulary items
- Risks: compliance burdens and supply shortages raise supplier leverage
Concentrated CPGs, supply-managed dairy and seasonality limit retailer supplier leverage
Concentrated CPGs (top 10 ≈50% category sales, Euromonitor 2024) and supply-managed dairy/poultry (dairy retail ≈25% above US, 2024) limit Metro’s supplier leverage despite multi-year contracts, private-labels (Irresistibles/Selection) and scale across >600 stores. Generics ≈90% Rx vol (US, 2024) shifts pharmacy leverage to generic makers, while weather and seasonality create episodic supplier risk.
| Metric | 2024 |
|---|---|
| Top-10 CPG share | ≈50% (Euromonitor) |
| Dairy retail vs US | ≈+25% |
| Stores (QC+ON) | >600 |
| Generics Rx vol | ≈90% (US) |
What is included in the product
Detailed Word Document
Comprehensive Porter’s Five Forces analysis tailored for Metro, uncovering competitive dynamics, buyer and supplier power, entry barriers, substitute threats, and disruptive risks—supported by industry data and strategic implications for pricing, profitability, and defensive opportunities.
Customizable Excel Spreadsheet
A single-sheet Metro Porter Five Forces summary that clarifies competitive pressures at a glance, with editable force levels and radar-chart visualization—ideal for rapid strategic decisions, slide-ready reporting, and quick scenario comparisons without technical overhead.
Customers Bargaining Power
Price-sensitive shoppers
Canadian shoppers remained highly price-aware in 2024 as grocery prices rose about 3.1% year-over-year, fueling deal-chasing and outsize sensitivity to promotions. Metro’s discount banners like Super C and frequent promotions reduce defection risk by offering lower-price anchors against national rivals. However persistent price gaps versus Walmart and Costco—often several percentage points—keep buyer bargaining power elevated, making perceived value critical to retain baskets.
Low switching costs
Low switching costs allow shoppers to move among Loblaw (~27% share in 2024), Sobeys (~20%), Walmart (~12%), Costco (~7%) and dollar/online rivals with little friction. Apps, digital flyers and price-matching heighten price transparency and reduce loyalty depth. Convenience and proximity partially counteract this ease, but rewards programs rarely lock in customers long-term.
Loyalty and data programs
Metro’s loyalty ecosystem, with over 5 million members as of 2024, and personalization capabilities can materially dampen buyer power. Tailored offers raise perceived value and drive repeat visits, reportedly increasing visit frequency by double-digit percentages in similar retail programs. Data-driven pricing narrows promotional leakage, but effectiveness hinges on reward richness versus competitors’ offers.
Omnichannel expectations
Shoppers now demand omnichannel options—click-and-collect, precise delivery windows and reliable substitutions—and 2024 data show about 62% prioritize delivery timing when choosing a grocer. Service lapses cause rapid churn to rivals and platform marketplaces, so speed and picking accuracy materially reduce buyer leverage. Fee structures and assortment breadth remain key differentiators.
- Delivery-window priority: 62%
- Click-and-collect adoption: high
- Churn sensitivity: rapid
- Differentiators: fees, assortment
Independent/franchise partners
Distribution and franchising create a cohort of B2B buyers with significant negotiating clout; Metro operates around 750 stores in 34 countries (2024). Their performance and satisfaction directly affect volumes and network stability. Contract terms balance support services with required standards, and regional concentration can amplify partner influence.
- B2B bargaining strength: consolidated partners
- Operational impact: volumes tied to partner performance
- Contracts: trade-offs between support and compliance
- Concentration risk: regional clusters raise leverage
Buyer power high: 3.1% inflation, 62% want delivery
Retail customers in 2024 held elevated bargaining power as grocery inflation of 3.1% drove price sensitivity and promotion chasing. Metro’s loyalty base (5m members) and discount banners mitigate churn but price gaps to Walmart/Costco sustain leverage. Omnichannel demands (62% prioritize delivery window) and low switching costs keep buyer power high.
| Metric | 2024 |
|---|---|
| Grocery inflation | 3.1% |
| Metro loyalty members | 5,000,000 |
| Delivery priority | 62% |
| Market shares (Loblaw/Sobeys/Walmart/Costco) | 27/20/12/7% |
Full Version Awaits
Metro Porter's Five Forces Analysis
This preview shows the exact Metro Porter's Five Forces Analysis you'll receive upon purchase—no placeholders or samples. The document displayed is the full, professionally formatted analysis, ready for download and immediate use. You're viewing the final deliverable; buy and get instant access to this same file.











