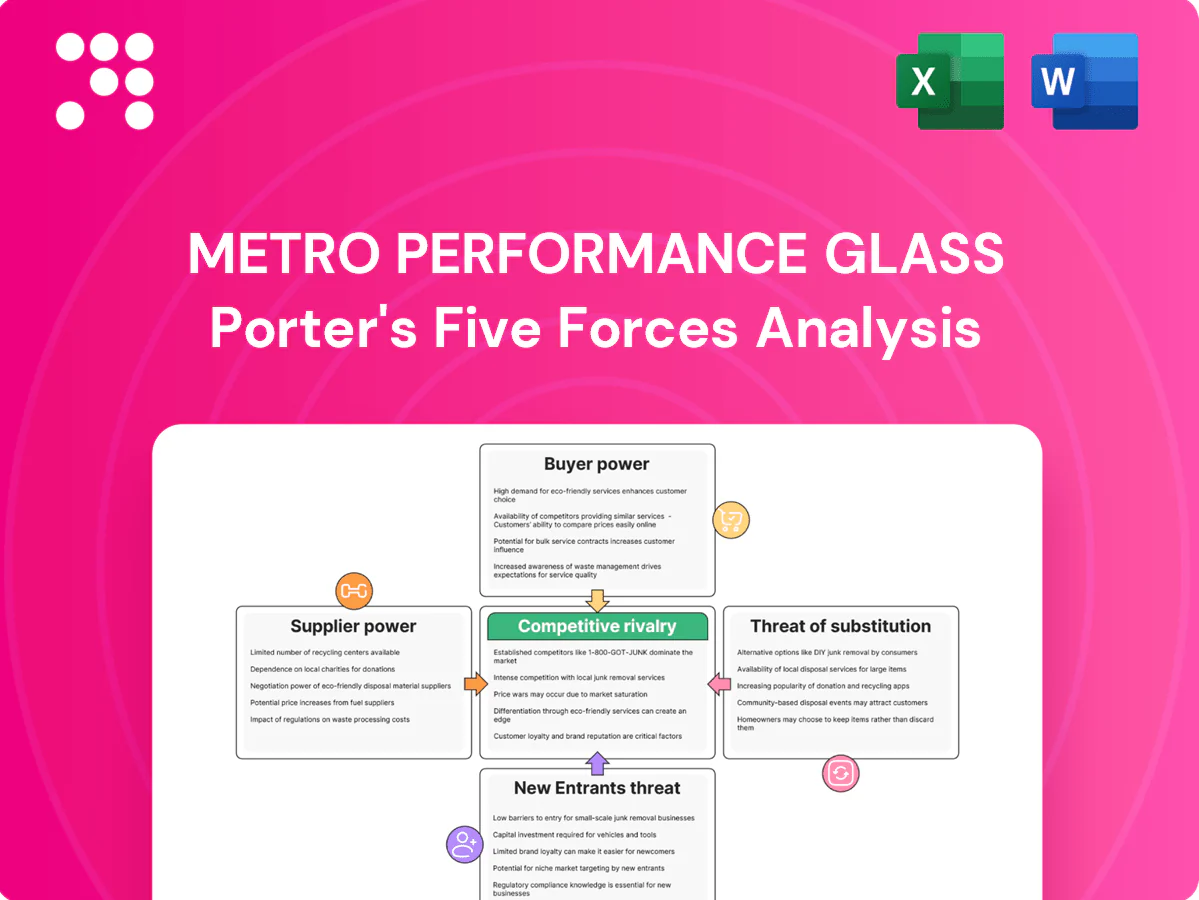
Metro Performance Glass Porter's Five Forces Analysis

Don't Miss the Bigger Picture
Metro Performance Glass faces moderate buyer power, concentrated supplier risks, and rising competitive intensity as market consolidation and product substitutes evolve; regulatory and capital barriers temper new entrants. This snapshot highlights key pressures shaping margins and strategic choices. Unlock the full Porter's Five Forces Analysis to explore force-by-force ratings, visuals, and actionable implications. Purchase the complete report for a consultant-grade breakdown tailored to investment and strategic planning.
Suppliers Bargaining Power

Concentrated float glass sources
Global float glass supply is highly concentrated with the five majors (AGC, NSG, Saint-Gobain, Guardian, Xinyi) accounting for roughly 60% of capacity in 2024, limiting Metro’s leverage on base glass pricing and contractual terms.
New Zealand’s isolation compounds this: high-spec architectural glass is predominantly imported, with ocean transit commonly 30–45 days and import dependence often cited near 80–90%, increasing exposure to lead‑time risk.
Mill outages or allocations at key producers quickly ripple through Metro’s production schedules and margins; vendor diversification reduces single‑source risk but true alternative upstream capacity remains constrained.
Specialty inputs and coatings
Low‑E coatings, laminates, interlayers, spacers and hardware often come from niche suppliers with proprietary specs, increasing switching costs and strengthening supplier bargaining power. Substituting components can trigger costly re‑certification under AS/NZS standards, a requirement reiterated in 2024 regulatory guidance. Dependency is strongest for premium, energy‑efficient products where supplier uniqueness limits alternatives.

Energy, freight, and FX exposure
Glass processing is energy intensive—energy can represent around 20–30% of manufacturing costs—and freight is heavy, embedding volatility into COGS; global Brent averaged about USD 86/bbl in 2024, keeping input fuel and power costs elevated.
Shipping to NZ/AU and domestic logistics face rate and capacity risk, with 2024 Shanghai–NZ spot container rates near USD 1,800–2,200 per FEU, increasing landed costs.
FX swings matter: USD/NZD averaged ~0.62 and EUR/NZD ~0.67 in 2024, directly raising import bills; suppliers can pass through surcharges faster than downstream prices adjust, compressing margins.

Standards and compliance lock‑in
Compliance with AS/NZS standards (eg AS/NZS 2208 glass safety, AS/NZS 4667 performance) narrows acceptable supplier pools for Metro Performance Glass, while approved vendor lists on major projects tend to entrench incumbents; requalification of new inputs typically requires multi-stage testing and months of validation, increasing upfront spend and lead times, which raises supplier leverage in price and terms negotiations.
- Standards: AS/NZS 2208, 4667
- Effects: narrower pool, entrenched vendors
- Costs: months of testing/requalification
- Result: higher supplier bargaining power
Scale-based negotiation limits
Metro Performance Glass has domestic scale in New Zealand but remains a relatively small purchaser versus global glass makers; in 2024 the top global suppliers (NSG, Saint-Gobain, AGC, Guardian) still account for the bulk of manufacturing capacity, limiting Metro’s access to global volume rebates and priority allocation.
- Scale gap reduces rebate leverage
- Suppliers prioritize larger Australian processors
- Price–service trade‑offs tighten margins in 2024
Top 5 own ~60% of glass; NZ import costs pinch margins
Global float glass is highly concentrated: five majors held ~60% of capacity in 2024, limiting Metro’s pricing leverage.
NZ imports ~80–90% of high‑spec glass; 30–45 day transit, Shanghai–NZ spot FEU ~USD1,800–2,200 in 2024, raising landed costs.
Specialty inputs and AS/NZS requalification (months) boost switching costs; energy/freight volatility (Brent ~USD86/bbl, USD/NZD ~0.62 in 2024) compress margins.
| Metric | 2024 |
|---|---|
| Top‑5 capacity | ~60% |
| NZ import share | 80–90% |
| Shanghai–NZ FEU | USD1,800–2,200 |
| Brent | ~USD86/bbl |
What is included in the product
 Detailed Word Document
Tailored Porter's Five Forces analysis for Metro Performance Glass that uncovers key drivers of competitive rivalry, buyer and supplier power, threat of substitutes, and barriers to entry. It identifies disruptive threats and strategic levers affecting pricing and profitability, with actionable insights to inform investor materials, strategy decks, or academic work.

 Customizable Excel Spreadsheet
One-sheet Porter's Five Forces for Metro Performance Glass that instantly clarifies competitive pressure—customize force levels, swap your data and annotations, and export a clean spider chart for decks or reports.
Customers Bargaining Power

Consolidated builders and fabricators
Consolidated builders, window fabricators and commercial glaziers coordinate large, competitive tenders that heighten price sensitivity and bargaining power toward suppliers; Metro Performance Glass is listed on ASX as MPG (2024) and routinely negotiates framework agreements demanding rebates, extended payment terms and service SLAs. Losing a few anchor accounts can materially reduce plant utilization and compress margins.
Project-driven pricing pressure
Project bids prioritize total installed cost, driving aggressive discounting and benchmarking of commoditized SKUs against imports as buyers routinely solicit 3–6 quotes. Margin recovery depends on winning work with complex specs and performance value-add rather than standard glazed units. Long project cycles, typically 12–24 months in 2024, delay pass-through of input cost spikes, compressing short-term margins.

Moderate switching costs
Buyers can switch processors for standard insulating glass units, particularly in Australia where major processors in Sydney, Melbourne and Brisbane create alternatives; IBISWorld reports Australian glass product manufacturing revenue at about A$1.1bn in 2024. Custom IGUs, curved, laminated or oversized panels, plus warranty continuity, shop drawings and site coordination, raise frictions, so net switching costs range low–moderate depending on product complexity.

Specification influence by architects
Architects and consultants strongly shape glazing specifications, often naming proprietary make-ups or preferred suppliers that narrow buyer optionality and push projects toward differentiated, higher-margin systems rather than commoditized glass.
Value engineering during 2024 projects regularly re-opens supplier competition mid-contract, pressuring price and margins; early architect engagement by Metro reduces shift to price-only procurement and preserves spec-driven value capture.
- Spec control: architects can lock supply into proprietary systems
- Optionality loss: named suppliers reduce buyer leverage
- VE risk: mid-project value engineering increases competitive pressure
- Mitigation: early engagement preserves specification and margins
Service, lead-time, and OTIF as levers
On-time, in-full (OTIF) delivery and rapid site responsiveness materially drive buyer satisfaction for Metro Performance Glass; industry OTIF targets typically exceed 95% and failures trigger contractor liquidated damages exposure, raising service weighting in awards. Buyers quantify these non-price factors during negotiations to extract concessions, while superior logistics and consistent OTIF can mitigate price pressure.
- OTIF target: 95%+
- Service weighting: increases award competitiveness
- Logistics edge: offsets price concessions
Buyers use 3–6 tenders; OTIF 95%+ lifts service weighting
Buyers exercise high price leverage via 3–6 quote tenders and value-engineering; losing anchors cuts utilisation for MPG (ASX: MPG, 2024). Project cycles 12–24 months delay cost pass-through; OTIF target >95% raises service weighting. Complex IGUs and architect specs reduce optionality, enabling margin recovery on differentiated systems.
| Metric | 2024 |
|---|---|
| Industry revenue (AU) | A$1.1bn |
| Quotes solicited | 3–6 |
| Project cycle | 12–24m |
| OTIF target | 95%+ |
What You See Is What You Get
Metro Performance Glass Porter's Five Forces Analysis
This preview shows the exact Metro Performance Glass Porter's Five Forces analysis you'll receive upon purchase—no placeholders or samples. The full document is professionally formatted, ready for immediate download and use. What you see here is the final deliverable.

Don't Miss the Bigger Picture
Metro Performance Glass faces moderate buyer power, concentrated supplier risks, and rising competitive intensity as market consolidation and product substitutes evolve; regulatory and capital barriers temper new entrants. This snapshot highlights key pressures shaping margins and strategic choices. Unlock the full Porter's Five Forces Analysis to explore force-by-force ratings, visuals, and actionable implications. Purchase the complete report for a consultant-grade breakdown tailored to investment and strategic planning.
Suppliers Bargaining Power
Concentrated float glass sources
Global float glass supply is highly concentrated with the five majors (AGC, NSG, Saint-Gobain, Guardian, Xinyi) accounting for roughly 60% of capacity in 2024, limiting Metro’s leverage on base glass pricing and contractual terms.
New Zealand’s isolation compounds this: high-spec architectural glass is predominantly imported, with ocean transit commonly 30–45 days and import dependence often cited near 80–90%, increasing exposure to lead‑time risk.
Mill outages or allocations at key producers quickly ripple through Metro’s production schedules and margins; vendor diversification reduces single‑source risk but true alternative upstream capacity remains constrained.
Specialty inputs and coatings
Low‑E coatings, laminates, interlayers, spacers and hardware often come from niche suppliers with proprietary specs, increasing switching costs and strengthening supplier bargaining power. Substituting components can trigger costly re‑certification under AS/NZS standards, a requirement reiterated in 2024 regulatory guidance. Dependency is strongest for premium, energy‑efficient products where supplier uniqueness limits alternatives.
Energy, freight, and FX exposure
Glass processing is energy intensive—energy can represent around 20–30% of manufacturing costs—and freight is heavy, embedding volatility into COGS; global Brent averaged about USD 86/bbl in 2024, keeping input fuel and power costs elevated.
Shipping to NZ/AU and domestic logistics face rate and capacity risk, with 2024 Shanghai–NZ spot container rates near USD 1,800–2,200 per FEU, increasing landed costs.
FX swings matter: USD/NZD averaged ~0.62 and EUR/NZD ~0.67 in 2024, directly raising import bills; suppliers can pass through surcharges faster than downstream prices adjust, compressing margins.
Standards and compliance lock‑in
Compliance with AS/NZS standards (eg AS/NZS 2208 glass safety, AS/NZS 4667 performance) narrows acceptable supplier pools for Metro Performance Glass, while approved vendor lists on major projects tend to entrench incumbents; requalification of new inputs typically requires multi-stage testing and months of validation, increasing upfront spend and lead times, which raises supplier leverage in price and terms negotiations.
- Standards: AS/NZS 2208, 4667
- Effects: narrower pool, entrenched vendors
- Costs: months of testing/requalification
- Result: higher supplier bargaining power
Scale-based negotiation limits
Metro Performance Glass has domestic scale in New Zealand but remains a relatively small purchaser versus global glass makers; in 2024 the top global suppliers (NSG, Saint-Gobain, AGC, Guardian) still account for the bulk of manufacturing capacity, limiting Metro’s access to global volume rebates and priority allocation.
- Scale gap reduces rebate leverage
- Suppliers prioritize larger Australian processors
- Price–service trade‑offs tighten margins in 2024
Top 5 own ~60% of glass; NZ import costs pinch margins
Global float glass is highly concentrated: five majors held ~60% of capacity in 2024, limiting Metro’s pricing leverage.
NZ imports ~80–90% of high‑spec glass; 30–45 day transit, Shanghai–NZ spot FEU ~USD1,800–2,200 in 2024, raising landed costs.
Specialty inputs and AS/NZS requalification (months) boost switching costs; energy/freight volatility (Brent ~USD86/bbl, USD/NZD ~0.62 in 2024) compress margins.
| Metric | 2024 |
|---|---|
| Top‑5 capacity | ~60% |
| NZ import share | 80–90% |
| Shanghai–NZ FEU | USD1,800–2,200 |
| Brent | ~USD86/bbl |
What is included in the product
Detailed Word Document
Tailored Porter's Five Forces analysis for Metro Performance Glass that uncovers key drivers of competitive rivalry, buyer and supplier power, threat of substitutes, and barriers to entry. It identifies disruptive threats and strategic levers affecting pricing and profitability, with actionable insights to inform investor materials, strategy decks, or academic work.
Customizable Excel Spreadsheet
One-sheet Porter's Five Forces for Metro Performance Glass that instantly clarifies competitive pressure—customize force levels, swap your data and annotations, and export a clean spider chart for decks or reports.
Customers Bargaining Power
Consolidated builders and fabricators
Consolidated builders, window fabricators and commercial glaziers coordinate large, competitive tenders that heighten price sensitivity and bargaining power toward suppliers; Metro Performance Glass is listed on ASX as MPG (2024) and routinely negotiates framework agreements demanding rebates, extended payment terms and service SLAs. Losing a few anchor accounts can materially reduce plant utilization and compress margins.
Project-driven pricing pressure
Project bids prioritize total installed cost, driving aggressive discounting and benchmarking of commoditized SKUs against imports as buyers routinely solicit 3–6 quotes. Margin recovery depends on winning work with complex specs and performance value-add rather than standard glazed units. Long project cycles, typically 12–24 months in 2024, delay pass-through of input cost spikes, compressing short-term margins.
Moderate switching costs
Buyers can switch processors for standard insulating glass units, particularly in Australia where major processors in Sydney, Melbourne and Brisbane create alternatives; IBISWorld reports Australian glass product manufacturing revenue at about A$1.1bn in 2024. Custom IGUs, curved, laminated or oversized panels, plus warranty continuity, shop drawings and site coordination, raise frictions, so net switching costs range low–moderate depending on product complexity.
Specification influence by architects
Architects and consultants strongly shape glazing specifications, often naming proprietary make-ups or preferred suppliers that narrow buyer optionality and push projects toward differentiated, higher-margin systems rather than commoditized glass.
Value engineering during 2024 projects regularly re-opens supplier competition mid-contract, pressuring price and margins; early architect engagement by Metro reduces shift to price-only procurement and preserves spec-driven value capture.
- Spec control: architects can lock supply into proprietary systems
- Optionality loss: named suppliers reduce buyer leverage
- VE risk: mid-project value engineering increases competitive pressure
- Mitigation: early engagement preserves specification and margins
Service, lead-time, and OTIF as levers
On-time, in-full (OTIF) delivery and rapid site responsiveness materially drive buyer satisfaction for Metro Performance Glass; industry OTIF targets typically exceed 95% and failures trigger contractor liquidated damages exposure, raising service weighting in awards. Buyers quantify these non-price factors during negotiations to extract concessions, while superior logistics and consistent OTIF can mitigate price pressure.
- OTIF target: 95%+
- Service weighting: increases award competitiveness
- Logistics edge: offsets price concessions
Buyers use 3–6 tenders; OTIF 95%+ lifts service weighting
Buyers exercise high price leverage via 3–6 quote tenders and value-engineering; losing anchors cuts utilisation for MPG (ASX: MPG, 2024). Project cycles 12–24 months delay cost pass-through; OTIF target >95% raises service weighting. Complex IGUs and architect specs reduce optionality, enabling margin recovery on differentiated systems.
| Metric | 2024 |
|---|---|
| Industry revenue (AU) | A$1.1bn |
| Quotes solicited | 3–6 |
| Project cycle | 12–24m |
| OTIF target | 95%+ |
What You See Is What You Get
Metro Performance Glass Porter's Five Forces Analysis
This preview shows the exact Metro Performance Glass Porter's Five Forces analysis you'll receive upon purchase—no placeholders or samples. The full document is professionally formatted, ready for immediate download and use. What you see here is the final deliverable.
Original: $10.00
-65%$10.00
$3.50Description
Don't Miss the Bigger Picture
Metro Performance Glass faces moderate buyer power, concentrated supplier risks, and rising competitive intensity as market consolidation and product substitutes evolve; regulatory and capital barriers temper new entrants. This snapshot highlights key pressures shaping margins and strategic choices. Unlock the full Porter's Five Forces Analysis to explore force-by-force ratings, visuals, and actionable implications. Purchase the complete report for a consultant-grade breakdown tailored to investment and strategic planning.
Suppliers Bargaining Power
Concentrated float glass sources
Global float glass supply is highly concentrated with the five majors (AGC, NSG, Saint-Gobain, Guardian, Xinyi) accounting for roughly 60% of capacity in 2024, limiting Metro’s leverage on base glass pricing and contractual terms.
New Zealand’s isolation compounds this: high-spec architectural glass is predominantly imported, with ocean transit commonly 30–45 days and import dependence often cited near 80–90%, increasing exposure to lead‑time risk.
Mill outages or allocations at key producers quickly ripple through Metro’s production schedules and margins; vendor diversification reduces single‑source risk but true alternative upstream capacity remains constrained.
Specialty inputs and coatings
Low‑E coatings, laminates, interlayers, spacers and hardware often come from niche suppliers with proprietary specs, increasing switching costs and strengthening supplier bargaining power. Substituting components can trigger costly re‑certification under AS/NZS standards, a requirement reiterated in 2024 regulatory guidance. Dependency is strongest for premium, energy‑efficient products where supplier uniqueness limits alternatives.
Energy, freight, and FX exposure
Glass processing is energy intensive—energy can represent around 20–30% of manufacturing costs—and freight is heavy, embedding volatility into COGS; global Brent averaged about USD 86/bbl in 2024, keeping input fuel and power costs elevated.
Shipping to NZ/AU and domestic logistics face rate and capacity risk, with 2024 Shanghai–NZ spot container rates near USD 1,800–2,200 per FEU, increasing landed costs.
FX swings matter: USD/NZD averaged ~0.62 and EUR/NZD ~0.67 in 2024, directly raising import bills; suppliers can pass through surcharges faster than downstream prices adjust, compressing margins.
Standards and compliance lock‑in
Compliance with AS/NZS standards (eg AS/NZS 2208 glass safety, AS/NZS 4667 performance) narrows acceptable supplier pools for Metro Performance Glass, while approved vendor lists on major projects tend to entrench incumbents; requalification of new inputs typically requires multi-stage testing and months of validation, increasing upfront spend and lead times, which raises supplier leverage in price and terms negotiations.
- Standards: AS/NZS 2208, 4667
- Effects: narrower pool, entrenched vendors
- Costs: months of testing/requalification
- Result: higher supplier bargaining power
Scale-based negotiation limits
Metro Performance Glass has domestic scale in New Zealand but remains a relatively small purchaser versus global glass makers; in 2024 the top global suppliers (NSG, Saint-Gobain, AGC, Guardian) still account for the bulk of manufacturing capacity, limiting Metro’s access to global volume rebates and priority allocation.
- Scale gap reduces rebate leverage
- Suppliers prioritize larger Australian processors
- Price–service trade‑offs tighten margins in 2024
Top 5 own ~60% of glass; NZ import costs pinch margins
Global float glass is highly concentrated: five majors held ~60% of capacity in 2024, limiting Metro’s pricing leverage.
NZ imports ~80–90% of high‑spec glass; 30–45 day transit, Shanghai–NZ spot FEU ~USD1,800–2,200 in 2024, raising landed costs.
Specialty inputs and AS/NZS requalification (months) boost switching costs; energy/freight volatility (Brent ~USD86/bbl, USD/NZD ~0.62 in 2024) compress margins.
| Metric | 2024 |
|---|---|
| Top‑5 capacity | ~60% |
| NZ import share | 80–90% |
| Shanghai–NZ FEU | USD1,800–2,200 |
| Brent | ~USD86/bbl |
What is included in the product
Detailed Word Document
Tailored Porter's Five Forces analysis for Metro Performance Glass that uncovers key drivers of competitive rivalry, buyer and supplier power, threat of substitutes, and barriers to entry. It identifies disruptive threats and strategic levers affecting pricing and profitability, with actionable insights to inform investor materials, strategy decks, or academic work.
Customizable Excel Spreadsheet
One-sheet Porter's Five Forces for Metro Performance Glass that instantly clarifies competitive pressure—customize force levels, swap your data and annotations, and export a clean spider chart for decks or reports.
Customers Bargaining Power
Consolidated builders and fabricators
Consolidated builders, window fabricators and commercial glaziers coordinate large, competitive tenders that heighten price sensitivity and bargaining power toward suppliers; Metro Performance Glass is listed on ASX as MPG (2024) and routinely negotiates framework agreements demanding rebates, extended payment terms and service SLAs. Losing a few anchor accounts can materially reduce plant utilization and compress margins.
Project-driven pricing pressure
Project bids prioritize total installed cost, driving aggressive discounting and benchmarking of commoditized SKUs against imports as buyers routinely solicit 3–6 quotes. Margin recovery depends on winning work with complex specs and performance value-add rather than standard glazed units. Long project cycles, typically 12–24 months in 2024, delay pass-through of input cost spikes, compressing short-term margins.
Moderate switching costs
Buyers can switch processors for standard insulating glass units, particularly in Australia where major processors in Sydney, Melbourne and Brisbane create alternatives; IBISWorld reports Australian glass product manufacturing revenue at about A$1.1bn in 2024. Custom IGUs, curved, laminated or oversized panels, plus warranty continuity, shop drawings and site coordination, raise frictions, so net switching costs range low–moderate depending on product complexity.
Specification influence by architects
Architects and consultants strongly shape glazing specifications, often naming proprietary make-ups or preferred suppliers that narrow buyer optionality and push projects toward differentiated, higher-margin systems rather than commoditized glass.
Value engineering during 2024 projects regularly re-opens supplier competition mid-contract, pressuring price and margins; early architect engagement by Metro reduces shift to price-only procurement and preserves spec-driven value capture.
- Spec control: architects can lock supply into proprietary systems
- Optionality loss: named suppliers reduce buyer leverage
- VE risk: mid-project value engineering increases competitive pressure
- Mitigation: early engagement preserves specification and margins
Service, lead-time, and OTIF as levers
On-time, in-full (OTIF) delivery and rapid site responsiveness materially drive buyer satisfaction for Metro Performance Glass; industry OTIF targets typically exceed 95% and failures trigger contractor liquidated damages exposure, raising service weighting in awards. Buyers quantify these non-price factors during negotiations to extract concessions, while superior logistics and consistent OTIF can mitigate price pressure.
- OTIF target: 95%+
- Service weighting: increases award competitiveness
- Logistics edge: offsets price concessions
Buyers use 3–6 tenders; OTIF 95%+ lifts service weighting
Buyers exercise high price leverage via 3–6 quote tenders and value-engineering; losing anchors cuts utilisation for MPG (ASX: MPG, 2024). Project cycles 12–24 months delay cost pass-through; OTIF target >95% raises service weighting. Complex IGUs and architect specs reduce optionality, enabling margin recovery on differentiated systems.
| Metric | 2024 |
|---|---|
| Industry revenue (AU) | A$1.1bn |
| Quotes solicited | 3–6 |
| Project cycle | 12–24m |
| OTIF target | 95%+ |
What You See Is What You Get
Metro Performance Glass Porter's Five Forces Analysis
This preview shows the exact Metro Performance Glass Porter's Five Forces analysis you'll receive upon purchase—no placeholders or samples. The full document is professionally formatted, ready for immediate download and use. What you see here is the final deliverable.











