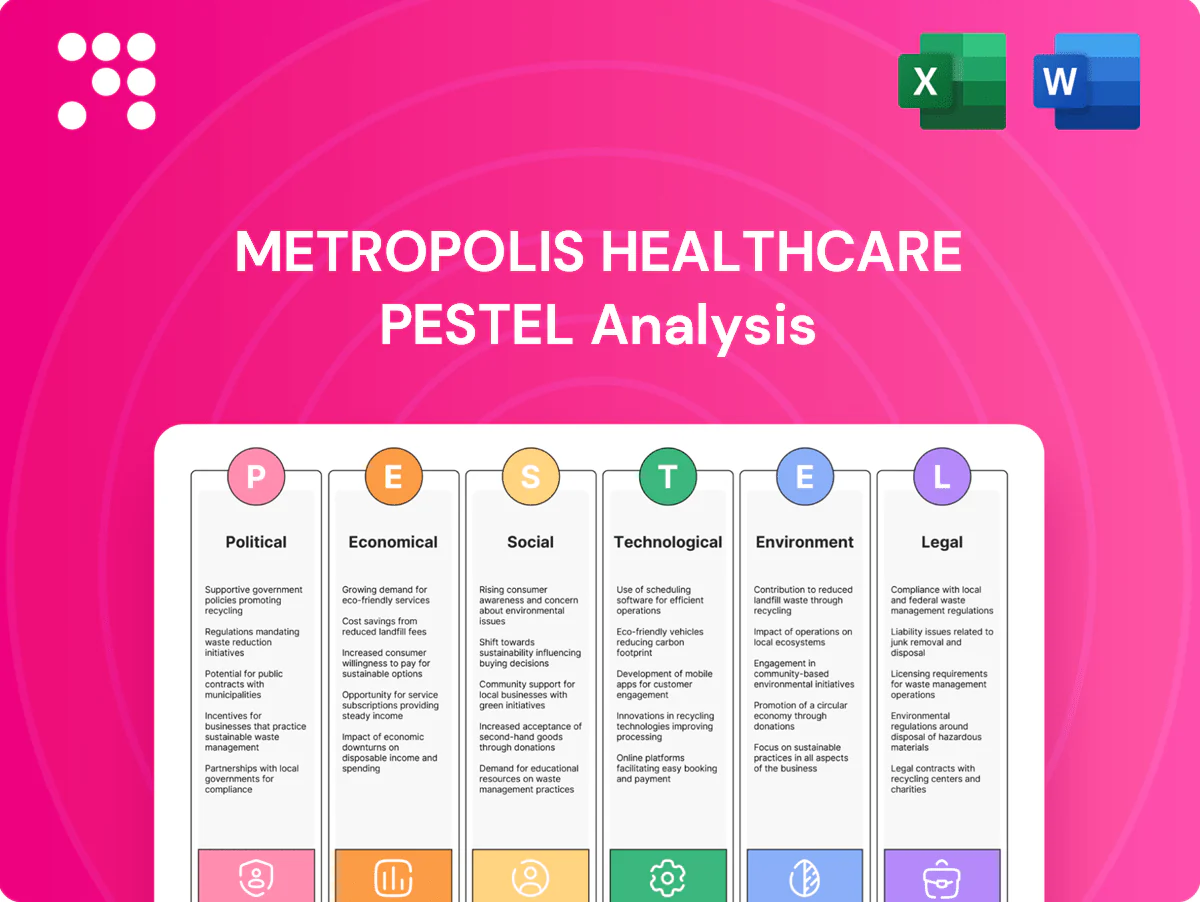
Metropolis Healthcare PESTLE Analysis

Your Competitive Advantage Starts with This Report
Gain strategic clarity with our PESTLE Analysis of Metropolis Healthcare. Explore political, economic, social, technological, legal, and environmental forces shaping its growth and risks. Ideal for investors and strategists seeking actionable insights. Purchase the full, downloadable report now.
Political factors

Healthcare policy priorities
Government emphasis on universal health coverage and diagnostics—via Ayushman Bharat PM-JAY (covers over 100 million families, ~500 million beneficiaries)—shapes demand and reimbursements for Metropolis. Programs and state schemes can push test volumes in tier‑2/3 centers, while public health spending (about 1.3% of GDP in 2022–23, with targets to rise) and election cycles may alter funding cadence. Strategic engagement in PPPs can secure stable long‑term volumes.
Regulatory oversight bodies
Policies from MoHFW, ICMR and state health departments determine test approvals, accreditation and reporting protocols, directly shaping Metropolis Healthcare’s laboratory operations and quality systems. Alignment with national disease-control priorities, such as TB and NCD screening programs, influences strategic menu expansion and capital allocation. Sudden advisories during outbreaks can force rapid reprioritization of capacity and logistics. Proactive compliance minimizes service disruptions and protects revenue continuity.

Trade and import dynamics
Import duties and customs norms raise procurement costs for analyzers, reagents and consumables, influencing unit economics and pricing power; India's PLI scheme for medical devices (outlay INR 3,420 crore) and state-level incentives encourage local sourcing to lower duty exposure. Geopolitical frictions, seen during 2020–22 supply shocks, can disrupt supply of specialized kits, pushing Metropolis to diversify vendors. Hedging procurement across multiple manufacturers reduces concentration risk and stabilizes margins.

Taxation and incentives
GST on diagnostic inputs falls largely in the 12–18% slabs while certain diagnostic services remain exempt under GST rules, influencing test pricing and patient billing; clear pass-through of GST rate changes helps protect margins. State-level capex and infrastructure incentives (available in several states) support lab expansion. Removal of weighted R&D deductions in 2020 altered incentive calculus and affects innovation spend.
- GST on inputs: 12–18%
- Some diagnostics: GST-exempt
- State capex incentives: support expansion
- R&D weighted deduction removed in 2020: impacts innovation spend
Public health campaigns
Public health campaigns such as national NCD screening (NCDs cause about 74% of global deaths, ~41 million annually) and India’s TB drives (India notified ~2.6 million TB cases in 2022) expand demand for preventive testing and can shift Metropolis Healthcare’s volume mix seasonally and during outbreaks.
- Boosts preventive testing uptake
- Shifts test mix seasonally/outbreaks
- Enhances policy credibility
- Requires strong data governance for govt programs
UHC and ~500M beneficiaries drive diagnostics; taxes and PLI reshape sourcing
Government push for UHC/PM-JAY (~500m beneficiaries) and rising public health spend (~1.3% GDP 2022–23) drives diagnostic demand, esp in tier‑2/3. MoHFW/ICMR rules, TB (~2.6m notified 2022) and NCD programs (~41m global deaths) dictate test menu and compliance. Import duties, GST 12–18% and PLI (INR 3,420cr) affect procurement and local sourcing.
| Metric | Value |
|---|---|
| PM-JAY beneficiaries | ~500 million |
| Public health spend | ~1.3% of GDP (2022–23) |
| TB notifications (2022) | ~2.6 million |
| Global NCD deaths | ~41 million/year |
| PLI medical devices | INR 3,420 crore |
| GST on inputs | 12–18% |
What is included in the product
 Detailed Word Document
Explores how Political, Economic, Social, Technological, Environmental and Legal forces shape Metropolis Healthcare’s growth and risks, with data-backed trends and region-specific regulatory context to inform executives, investors and strategists and deliver forward-looking insights for scenario planning.

 Customizable Excel Spreadsheet
A concise, visually segmented PESTLE summary of Metropolis Healthcare that relieves meeting-prep pain—easy to drop into presentations, edit with region- or business-line notes, and share across teams to support external risk and market-position discussions.
Economic factors

Macroeconomic cycles
Robust macro cycles support Metropolis: India GDP ~6.8% in 2024 and rising employment boost discretionary testing beyond essentials, while downturns shift volumes toward price‑sensitive panels. Inflation (CPI ~5.4% in 2024) and an INR ~83/USD raise wages, utilities and reagent import costs, compressing margins. Counter‑cyclical illness demand and public schemes like Ayushman Bharat (≈500 million covered) soften revenue volatility.
Insurance and reimbursement
Rising private insurance and cashless plans boost Metropolis’s home and center diagnostics uptake, while PM-JAY covers about 500 million beneficiaries, increasing volume but at lower tariff rates. Reimbursement rates and TPA contract terms materially affect realizations per test and average revenue per sample. Government-scheme volumes support utilization but compress margins. Efficient claims management shortens DSO and improves cash flow.

Input cost volatility
Currency swings (notably INR volatility vs USD/EUR in 2023–24) raised imported equipment and reagent costs, while energy and logistics inflation pushed per-test costs higher by mid-single digits; long-term supply contracts and vendor diversification helped cap price spikes, and automation and central-lab productivity gains reduced per-test costs—Metropolis reported double-digit capacity uplift from automation initiatives in recent years.

Network expansion economics
Hub-and-spoke labs and collection centers require disciplined capex; Metropolis scaled 130+ labs and ~4,000 collection points by FY24 to justify high initial investment. Scale reduces unit costs via higher analyzer utilization, improving margins as throughput rises. Entry into underpenetrated Tier II–III cities unlocks operating leverage with faster contribution-margin recovery. Site selection and route optimization accelerate breakeven, often within 12–18 months.
- Capex discipline
- Analyzer utilization cuts unit cost
- Tier II/III expansion = leverage
- Site/route = faster breakeven
Competitive pricing pressure
Regional labs and online aggregators have intensified price competition for Metropolis, compressing average realizations; Metropolis reported consolidated revenue of INR 2,067 crore in FY24, highlighting margin sensitivity to pricing pressure. Bundled wellness packages and subscription models can erode yields if unmanaged, but differentiation through quality, sub-24-hour TAT and over 250 specialized tests supports premium pricing. Tiered offerings enable capture across value and premium segments while protecting volumes.
- Regional/online competition — higher price elasticity
- Bundled packages — margin dilution risk
- Quality/TAT/specialized tests — pricing defense
- Tiered portfolio — aligns with varied consumer price points
UHC and ~500M beneficiaries drive diagnostics; taxes and PLI reshape sourcing
Robust macro (India GDP ~6.8% in 2024) and rising insurance/PM-JAY (~500m covered) lift volumes but compress margins via lower tariffs; CPI ~5.4% and INR ~83/USD raise wages, energy and import costs. Scale (130+ labs, ~4,000 collection points; INR 2,067 crore revenue FY24) and automation (double-digit capacity uplift) improve unit economics; hub‑and‑spoke capex drives 12–18 month breakeven.
| Metric | Value |
|---|---|
| India GDP 2024 | ~6.8% |
| CPI 2024 | ~5.4% |
| INR/USD | ~83 |
| PM-JAY coverage | ~500m |
| Metropolis FY24 rev | INR 2,067 Cr |
| Labs / collection pts | 130+ / ~4,000 |
Preview the Actual Deliverable
Metropolis Healthcare PESTLE Analysis
The Metropolis Healthcare PESTLE Analysis preview shown here is the exact document you’ll receive after purchase—fully formatted and ready to use. The layout, content, and structure visible are identical to the downloadable file. No placeholders or teasers—this is the final, professional report you’ll own immediately after checkout.

Your Competitive Advantage Starts with This Report
Gain strategic clarity with our PESTLE Analysis of Metropolis Healthcare. Explore political, economic, social, technological, legal, and environmental forces shaping its growth and risks. Ideal for investors and strategists seeking actionable insights. Purchase the full, downloadable report now.
Political factors
Healthcare policy priorities
Government emphasis on universal health coverage and diagnostics—via Ayushman Bharat PM-JAY (covers over 100 million families, ~500 million beneficiaries)—shapes demand and reimbursements for Metropolis. Programs and state schemes can push test volumes in tier‑2/3 centers, while public health spending (about 1.3% of GDP in 2022–23, with targets to rise) and election cycles may alter funding cadence. Strategic engagement in PPPs can secure stable long‑term volumes.
Regulatory oversight bodies
Policies from MoHFW, ICMR and state health departments determine test approvals, accreditation and reporting protocols, directly shaping Metropolis Healthcare’s laboratory operations and quality systems. Alignment with national disease-control priorities, such as TB and NCD screening programs, influences strategic menu expansion and capital allocation. Sudden advisories during outbreaks can force rapid reprioritization of capacity and logistics. Proactive compliance minimizes service disruptions and protects revenue continuity.
Trade and import dynamics
Import duties and customs norms raise procurement costs for analyzers, reagents and consumables, influencing unit economics and pricing power; India's PLI scheme for medical devices (outlay INR 3,420 crore) and state-level incentives encourage local sourcing to lower duty exposure. Geopolitical frictions, seen during 2020–22 supply shocks, can disrupt supply of specialized kits, pushing Metropolis to diversify vendors. Hedging procurement across multiple manufacturers reduces concentration risk and stabilizes margins.
Taxation and incentives
GST on diagnostic inputs falls largely in the 12–18% slabs while certain diagnostic services remain exempt under GST rules, influencing test pricing and patient billing; clear pass-through of GST rate changes helps protect margins. State-level capex and infrastructure incentives (available in several states) support lab expansion. Removal of weighted R&D deductions in 2020 altered incentive calculus and affects innovation spend.
- GST on inputs: 12–18%
- Some diagnostics: GST-exempt
- State capex incentives: support expansion
- R&D weighted deduction removed in 2020: impacts innovation spend
Public health campaigns
Public health campaigns such as national NCD screening (NCDs cause about 74% of global deaths, ~41 million annually) and India’s TB drives (India notified ~2.6 million TB cases in 2022) expand demand for preventive testing and can shift Metropolis Healthcare’s volume mix seasonally and during outbreaks.
- Boosts preventive testing uptake
- Shifts test mix seasonally/outbreaks
- Enhances policy credibility
- Requires strong data governance for govt programs
UHC and ~500M beneficiaries drive diagnostics; taxes and PLI reshape sourcing
Government push for UHC/PM-JAY (~500m beneficiaries) and rising public health spend (~1.3% GDP 2022–23) drives diagnostic demand, esp in tier‑2/3. MoHFW/ICMR rules, TB (~2.6m notified 2022) and NCD programs (~41m global deaths) dictate test menu and compliance. Import duties, GST 12–18% and PLI (INR 3,420cr) affect procurement and local sourcing.
| Metric | Value |
|---|---|
| PM-JAY beneficiaries | ~500 million |
| Public health spend | ~1.3% of GDP (2022–23) |
| TB notifications (2022) | ~2.6 million |
| Global NCD deaths | ~41 million/year |
| PLI medical devices | INR 3,420 crore |
| GST on inputs | 12–18% |
What is included in the product
Detailed Word Document
Explores how Political, Economic, Social, Technological, Environmental and Legal forces shape Metropolis Healthcare’s growth and risks, with data-backed trends and region-specific regulatory context to inform executives, investors and strategists and deliver forward-looking insights for scenario planning.
Customizable Excel Spreadsheet
A concise, visually segmented PESTLE summary of Metropolis Healthcare that relieves meeting-prep pain—easy to drop into presentations, edit with region- or business-line notes, and share across teams to support external risk and market-position discussions.
Economic factors
Macroeconomic cycles
Robust macro cycles support Metropolis: India GDP ~6.8% in 2024 and rising employment boost discretionary testing beyond essentials, while downturns shift volumes toward price‑sensitive panels. Inflation (CPI ~5.4% in 2024) and an INR ~83/USD raise wages, utilities and reagent import costs, compressing margins. Counter‑cyclical illness demand and public schemes like Ayushman Bharat (≈500 million covered) soften revenue volatility.
Insurance and reimbursement
Rising private insurance and cashless plans boost Metropolis’s home and center diagnostics uptake, while PM-JAY covers about 500 million beneficiaries, increasing volume but at lower tariff rates. Reimbursement rates and TPA contract terms materially affect realizations per test and average revenue per sample. Government-scheme volumes support utilization but compress margins. Efficient claims management shortens DSO and improves cash flow.
Input cost volatility
Currency swings (notably INR volatility vs USD/EUR in 2023–24) raised imported equipment and reagent costs, while energy and logistics inflation pushed per-test costs higher by mid-single digits; long-term supply contracts and vendor diversification helped cap price spikes, and automation and central-lab productivity gains reduced per-test costs—Metropolis reported double-digit capacity uplift from automation initiatives in recent years.
Network expansion economics
Hub-and-spoke labs and collection centers require disciplined capex; Metropolis scaled 130+ labs and ~4,000 collection points by FY24 to justify high initial investment. Scale reduces unit costs via higher analyzer utilization, improving margins as throughput rises. Entry into underpenetrated Tier II–III cities unlocks operating leverage with faster contribution-margin recovery. Site selection and route optimization accelerate breakeven, often within 12–18 months.
- Capex discipline
- Analyzer utilization cuts unit cost
- Tier II/III expansion = leverage
- Site/route = faster breakeven
Competitive pricing pressure
Regional labs and online aggregators have intensified price competition for Metropolis, compressing average realizations; Metropolis reported consolidated revenue of INR 2,067 crore in FY24, highlighting margin sensitivity to pricing pressure. Bundled wellness packages and subscription models can erode yields if unmanaged, but differentiation through quality, sub-24-hour TAT and over 250 specialized tests supports premium pricing. Tiered offerings enable capture across value and premium segments while protecting volumes.
- Regional/online competition — higher price elasticity
- Bundled packages — margin dilution risk
- Quality/TAT/specialized tests — pricing defense
- Tiered portfolio — aligns with varied consumer price points
UHC and ~500M beneficiaries drive diagnostics; taxes and PLI reshape sourcing
Robust macro (India GDP ~6.8% in 2024) and rising insurance/PM-JAY (~500m covered) lift volumes but compress margins via lower tariffs; CPI ~5.4% and INR ~83/USD raise wages, energy and import costs. Scale (130+ labs, ~4,000 collection points; INR 2,067 crore revenue FY24) and automation (double-digit capacity uplift) improve unit economics; hub‑and‑spoke capex drives 12–18 month breakeven.
| Metric | Value |
|---|---|
| India GDP 2024 | ~6.8% |
| CPI 2024 | ~5.4% |
| INR/USD | ~83 |
| PM-JAY coverage | ~500m |
| Metropolis FY24 rev | INR 2,067 Cr |
| Labs / collection pts | 130+ / ~4,000 |
Preview the Actual Deliverable
Metropolis Healthcare PESTLE Analysis
The Metropolis Healthcare PESTLE Analysis preview shown here is the exact document you’ll receive after purchase—fully formatted and ready to use. The layout, content, and structure visible are identical to the downloadable file. No placeholders or teasers—this is the final, professional report you’ll own immediately after checkout.
Original: $10.00
-65%$10.00
$3.50Description
Your Competitive Advantage Starts with This Report
Gain strategic clarity with our PESTLE Analysis of Metropolis Healthcare. Explore political, economic, social, technological, legal, and environmental forces shaping its growth and risks. Ideal for investors and strategists seeking actionable insights. Purchase the full, downloadable report now.
Political factors
Healthcare policy priorities
Government emphasis on universal health coverage and diagnostics—via Ayushman Bharat PM-JAY (covers over 100 million families, ~500 million beneficiaries)—shapes demand and reimbursements for Metropolis. Programs and state schemes can push test volumes in tier‑2/3 centers, while public health spending (about 1.3% of GDP in 2022–23, with targets to rise) and election cycles may alter funding cadence. Strategic engagement in PPPs can secure stable long‑term volumes.
Regulatory oversight bodies
Policies from MoHFW, ICMR and state health departments determine test approvals, accreditation and reporting protocols, directly shaping Metropolis Healthcare’s laboratory operations and quality systems. Alignment with national disease-control priorities, such as TB and NCD screening programs, influences strategic menu expansion and capital allocation. Sudden advisories during outbreaks can force rapid reprioritization of capacity and logistics. Proactive compliance minimizes service disruptions and protects revenue continuity.
Trade and import dynamics
Import duties and customs norms raise procurement costs for analyzers, reagents and consumables, influencing unit economics and pricing power; India's PLI scheme for medical devices (outlay INR 3,420 crore) and state-level incentives encourage local sourcing to lower duty exposure. Geopolitical frictions, seen during 2020–22 supply shocks, can disrupt supply of specialized kits, pushing Metropolis to diversify vendors. Hedging procurement across multiple manufacturers reduces concentration risk and stabilizes margins.
Taxation and incentives
GST on diagnostic inputs falls largely in the 12–18% slabs while certain diagnostic services remain exempt under GST rules, influencing test pricing and patient billing; clear pass-through of GST rate changes helps protect margins. State-level capex and infrastructure incentives (available in several states) support lab expansion. Removal of weighted R&D deductions in 2020 altered incentive calculus and affects innovation spend.
- GST on inputs: 12–18%
- Some diagnostics: GST-exempt
- State capex incentives: support expansion
- R&D weighted deduction removed in 2020: impacts innovation spend
Public health campaigns
Public health campaigns such as national NCD screening (NCDs cause about 74% of global deaths, ~41 million annually) and India’s TB drives (India notified ~2.6 million TB cases in 2022) expand demand for preventive testing and can shift Metropolis Healthcare’s volume mix seasonally and during outbreaks.
- Boosts preventive testing uptake
- Shifts test mix seasonally/outbreaks
- Enhances policy credibility
- Requires strong data governance for govt programs
UHC and ~500M beneficiaries drive diagnostics; taxes and PLI reshape sourcing
Government push for UHC/PM-JAY (~500m beneficiaries) and rising public health spend (~1.3% GDP 2022–23) drives diagnostic demand, esp in tier‑2/3. MoHFW/ICMR rules, TB (~2.6m notified 2022) and NCD programs (~41m global deaths) dictate test menu and compliance. Import duties, GST 12–18% and PLI (INR 3,420cr) affect procurement and local sourcing.
| Metric | Value |
|---|---|
| PM-JAY beneficiaries | ~500 million |
| Public health spend | ~1.3% of GDP (2022–23) |
| TB notifications (2022) | ~2.6 million |
| Global NCD deaths | ~41 million/year |
| PLI medical devices | INR 3,420 crore |
| GST on inputs | 12–18% |
What is included in the product
Detailed Word Document
Explores how Political, Economic, Social, Technological, Environmental and Legal forces shape Metropolis Healthcare’s growth and risks, with data-backed trends and region-specific regulatory context to inform executives, investors and strategists and deliver forward-looking insights for scenario planning.
Customizable Excel Spreadsheet
A concise, visually segmented PESTLE summary of Metropolis Healthcare that relieves meeting-prep pain—easy to drop into presentations, edit with region- or business-line notes, and share across teams to support external risk and market-position discussions.
Economic factors
Macroeconomic cycles
Robust macro cycles support Metropolis: India GDP ~6.8% in 2024 and rising employment boost discretionary testing beyond essentials, while downturns shift volumes toward price‑sensitive panels. Inflation (CPI ~5.4% in 2024) and an INR ~83/USD raise wages, utilities and reagent import costs, compressing margins. Counter‑cyclical illness demand and public schemes like Ayushman Bharat (≈500 million covered) soften revenue volatility.
Insurance and reimbursement
Rising private insurance and cashless plans boost Metropolis’s home and center diagnostics uptake, while PM-JAY covers about 500 million beneficiaries, increasing volume but at lower tariff rates. Reimbursement rates and TPA contract terms materially affect realizations per test and average revenue per sample. Government-scheme volumes support utilization but compress margins. Efficient claims management shortens DSO and improves cash flow.
Input cost volatility
Currency swings (notably INR volatility vs USD/EUR in 2023–24) raised imported equipment and reagent costs, while energy and logistics inflation pushed per-test costs higher by mid-single digits; long-term supply contracts and vendor diversification helped cap price spikes, and automation and central-lab productivity gains reduced per-test costs—Metropolis reported double-digit capacity uplift from automation initiatives in recent years.
Network expansion economics
Hub-and-spoke labs and collection centers require disciplined capex; Metropolis scaled 130+ labs and ~4,000 collection points by FY24 to justify high initial investment. Scale reduces unit costs via higher analyzer utilization, improving margins as throughput rises. Entry into underpenetrated Tier II–III cities unlocks operating leverage with faster contribution-margin recovery. Site selection and route optimization accelerate breakeven, often within 12–18 months.
- Capex discipline
- Analyzer utilization cuts unit cost
- Tier II/III expansion = leverage
- Site/route = faster breakeven
Competitive pricing pressure
Regional labs and online aggregators have intensified price competition for Metropolis, compressing average realizations; Metropolis reported consolidated revenue of INR 2,067 crore in FY24, highlighting margin sensitivity to pricing pressure. Bundled wellness packages and subscription models can erode yields if unmanaged, but differentiation through quality, sub-24-hour TAT and over 250 specialized tests supports premium pricing. Tiered offerings enable capture across value and premium segments while protecting volumes.
- Regional/online competition — higher price elasticity
- Bundled packages — margin dilution risk
- Quality/TAT/specialized tests — pricing defense
- Tiered portfolio — aligns with varied consumer price points
UHC and ~500M beneficiaries drive diagnostics; taxes and PLI reshape sourcing
Robust macro (India GDP ~6.8% in 2024) and rising insurance/PM-JAY (~500m covered) lift volumes but compress margins via lower tariffs; CPI ~5.4% and INR ~83/USD raise wages, energy and import costs. Scale (130+ labs, ~4,000 collection points; INR 2,067 crore revenue FY24) and automation (double-digit capacity uplift) improve unit economics; hub‑and‑spoke capex drives 12–18 month breakeven.
| Metric | Value |
|---|---|
| India GDP 2024 | ~6.8% |
| CPI 2024 | ~5.4% |
| INR/USD | ~83 |
| PM-JAY coverage | ~500m |
| Metropolis FY24 rev | INR 2,067 Cr |
| Labs / collection pts | 130+ / ~4,000 |
Preview the Actual Deliverable
Metropolis Healthcare PESTLE Analysis
The Metropolis Healthcare PESTLE Analysis preview shown here is the exact document you’ll receive after purchase—fully formatted and ready to use. The layout, content, and structure visible are identical to the downloadable file. No placeholders or teasers—this is the final, professional report you’ll own immediately after checkout.











