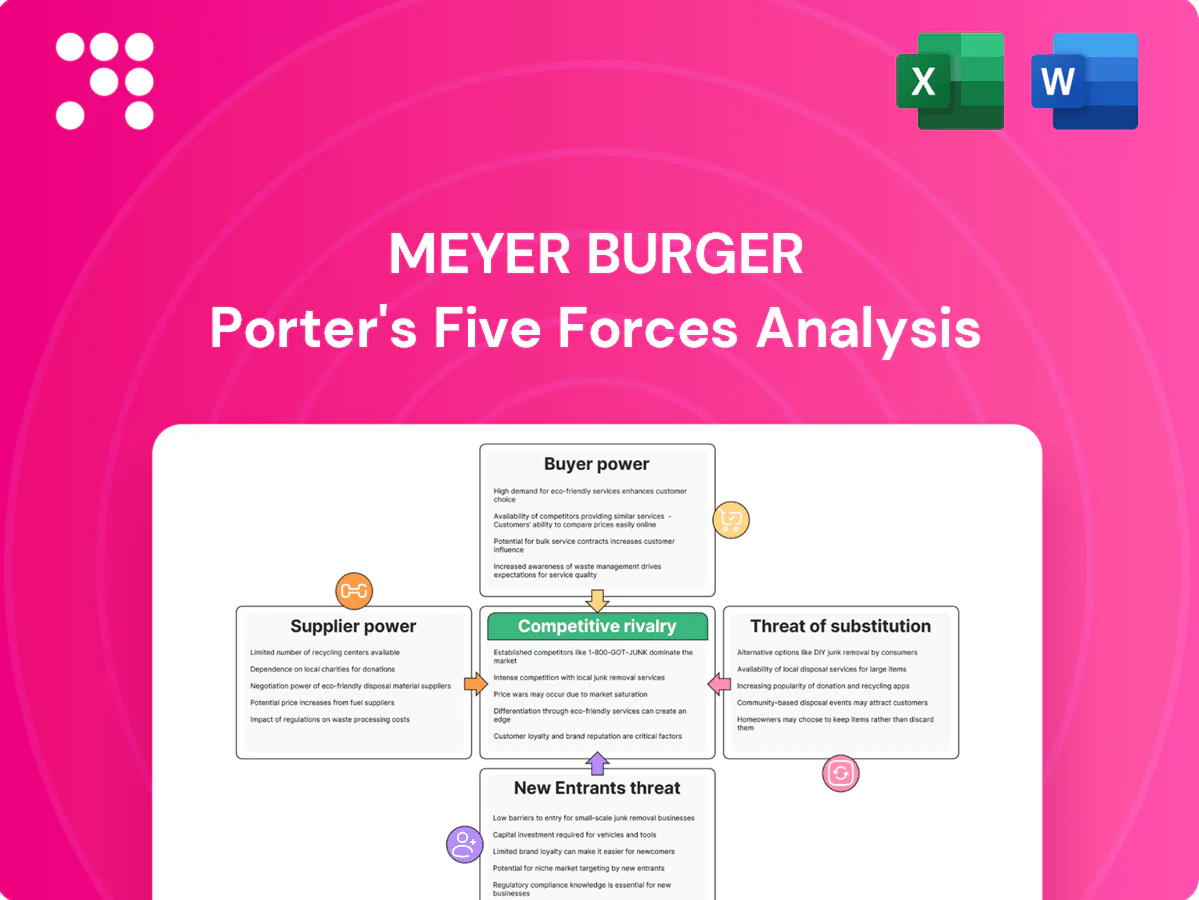
Meyer Burger Porter's Five Forces Analysis

Elevate Your Analysis with the Complete Porter's Five Forces Analysis
Meyer Burger faces moderate supplier power and rising buyer sophistication amid growing PV competition, while scale and tech differentiation limit new entrants and substitutes. This brief snapshot only scratches the surface. Unlock the full Porter's Five Forces Analysis to explore Meyer Burger’s competitive dynamics and actionable insights.
Suppliers Bargaining Power

Concentrated high-purity wafer sources
HJT cell performance depends on n-type, low-defect wafers supplied by a concentrated upstream set; the top three suppliers control roughly 70% of high-purity n-type wafer capacity in 2024, raising switching costs and pricing leverage. Limited qualified sources increase allocation risk; long-term offtakes and dual-sourcing reduce but do not eliminate dependence. Any disruption directly cuts yield and throughput, impacting margins and project timelines.
Silver paste and specialty materials intensity
HJT lines consume significant silver paste and specialty chemicals/gases, where in 2024 only a handful of vendors met the tight formulation and purity specs required, boosting supplier leverage. Material-cost volatility and formulation lock-in raise switching costs, while process requalification to alternative pastes is time-consuming and risky for yield. Ongoing silver-thrifting in 2024 has reduced exposure but remains a multi-year transition, keeping supplier bargaining power elevated.

Precision equipment and spare parts
Critical tools (PECVD, PVD, laser, stringing/SmartWire) depend on precision components and custom spares, creating concentrated demand for specialized OEMs and tier‑1 sub‑suppliers in 2024. OEM/sub‑supplier concentration gives suppliers pricing power and elevated lead‑time risk for Meyer Burger, with preventive maintenance contracts smoothing uptime but increasing vendor dependence. Qualifying alternate suppliers requires downtime and capex, raising switching costs and operational risk.

Energy, glass, and encapsulant inputs
Modules need energy-intensive glass, EVA/POE and backsheets with regional logistics limits; EU industrial electricity averaged about €0.22/kWh in 2024 (Eurostat), tightening margins and boosting supplier leverage. Local European sourcing lowers geopolitical risk but raises costs versus Asia. Multi-year supply contracts and inventory buffers reduce but do not eliminate input-price exposure.
- Energy: EU industrial €0.22/kWh (2024)
- Inputs: glass, EVA/POE, backsheets
- Risk trade-off: lower geopolitical risk vs higher cost
- Mitigation: multi-year contracts + inventory
IP, licensing, and process know-how
Advanced HJT/SWCT stacks rely on proprietary coatings and co-developed process recipes, and dependence on unique consumables or licensed steps raises royalty exposure and limits negotiation room; protecting core IP in 2024 offsets supplier leverage but interoperability still ties operations to specific vendors, so technical collaborations must be structured to avoid lock-in.
- IP protection reduces supplier bargaining but does not eliminate vendor dependence
- Licensed steps can add mid-single-digit to low-double-digit cost pressure on modules
- Structured collaborations and cross-licensing lower lock-in risk
Supplier concentration (top-3 ~70%) and EU energy €0.22/kWh squeeze margins
Supplier power is high: top‑3 n‑type wafer suppliers hold ~70% capacity (2024), raising switching costs and allocation risk. Critical pastes/chemicals and OEM tools are concentrated in a few vendors, keeping pricing and lead‑time leverage elevated. EU energy €0.22/kWh (2024) and branded IP royalties (mid‑single to low‑double digit %) further pressure margins; long‑term contracts and dual‑sourcing partially mitigate.
| Metric | 2024 |
|---|---|
| Top‑3 wafer share | ~70% |
| EU industrial energy | €0.22/kWh |
What is included in the product
 Detailed Word Document
Comprehensive Porter's Five Forces assessment tailored to Meyer Burger, highlighting competitive rivalry, supplier and buyer power, entry barriers, and substitution risks to inform strategic positioning.

 Customizable Excel Spreadsheet
A concise Meyer Burger Porter's Five Forces one-sheet that quantifies supplier, buyer, entrant, substitute and rivalry pressures—ideal for quick strategic pivots, boardroom slides, or investor briefings.
Customers Bargaining Power

Large buyers with tender-driven pricing
Utility-scale EPCs, distributors and installers aggregate volumes through competitive tenders that compress supplier margins and enable alternative sourcing. Bankability criteria (IEC/UL, 25-year performance/warranty, typical end-of-life ≥80% with ~0.5%/yr degradation) push tight specs and favor buyers. Meyer Burger must defend pricing by differentiating on higher commercial HJT module performance (>22%), European origin and demonstrated reliability.
Performance premium vs price sensitivity
HJT cell efficiencies reached ~25–26% in 2024 with stronger low‑temperature performance, supporting a performance premium, but buyers still benchmark on $/W where TOPCon spot prices dipped to about $0.14/W in 2024, pressuring discounts. Demonstrated LCOE advantages of roughly 5–12% and lower degradation rates (~0.25%/yr vs 0.5%/yr) justify premiums in selective segments, and education plus TCO tools reduce pure price bargaining.

Switching costs vary by segment
Equipment buyers face high switching costs from line integration, proprietary process IP and long commissioning cycles, while module buyers have moderate switching costs thanks to standardized M10/G12 form factors and IEC 61215/61730 certifications. Framework agreements and multi-year project pipelines increase customer dependence over time. After-sales 24/7 service and uptime SLAs (commonly >98%) materially lower propensity to switch.

Policy and subsidy pass-through
Quality, warranty, and bankability leverage
Buyers push Meyer Burger for extended warranties, liquidated damages and performance guarantees, tying concessions to the companys field-proven yield and balance-sheet strength.
Claims risk and warranty reserves are core to price talks; lenders and finance partners increasingly demand third-party testing and insurer or bank endorsements to lower buyer leverage.
- Buyers: extended warranties, LDs, performance guarantees
- Prerequisites: strong balance sheet, field data, third-party test
- Price drivers: claims risk, warranty reserves
- Mitigants: finance partner endorsements, insurer backing
Buyers demand warranties as HJT 25-26% vs TOPCon $0.14/W squeezes premiums
Meyer Burger faces strong buyer leverage: utility EPCs and distributors compress margins via tenders and expect subsidy pass-through (IRA/EU 2024). HJT performance (25–26% in 2024) and LCOE edge (5–12%) justify selective premiums versus TOPCon ~$0.14/W, but buyers demand warranties, LDs and bankable third‑party tests.
| Metric | 2024 Value | Buyer Impact |
|---|---|---|
| HJT eff. | 25–26% | Performance premium |
| TOPCon price | $0.14/W | Price pressure |
| Degradation | ~0.25%/yr vs 0.5% | Warranty leverage |
| SLAs | >98% | Switching cost |
Preview the Actual Deliverable
Meyer Burger Porter's Five Forces Analysis
This preview shows the exact Meyer Burger Porter's Five Forces analysis you'll receive immediately after purchase—no placeholders. The document is fully formatted, ready for download and use, and contains the complete assessment of competitive rivalry, supplier and buyer power, and threats of entry and substitutes. You get instant access to this exact file upon payment.

Elevate Your Analysis with the Complete Porter's Five Forces Analysis
Meyer Burger faces moderate supplier power and rising buyer sophistication amid growing PV competition, while scale and tech differentiation limit new entrants and substitutes. This brief snapshot only scratches the surface. Unlock the full Porter's Five Forces Analysis to explore Meyer Burger’s competitive dynamics and actionable insights.
Suppliers Bargaining Power
Concentrated high-purity wafer sources
HJT cell performance depends on n-type, low-defect wafers supplied by a concentrated upstream set; the top three suppliers control roughly 70% of high-purity n-type wafer capacity in 2024, raising switching costs and pricing leverage. Limited qualified sources increase allocation risk; long-term offtakes and dual-sourcing reduce but do not eliminate dependence. Any disruption directly cuts yield and throughput, impacting margins and project timelines.
Silver paste and specialty materials intensity
HJT lines consume significant silver paste and specialty chemicals/gases, where in 2024 only a handful of vendors met the tight formulation and purity specs required, boosting supplier leverage. Material-cost volatility and formulation lock-in raise switching costs, while process requalification to alternative pastes is time-consuming and risky for yield. Ongoing silver-thrifting in 2024 has reduced exposure but remains a multi-year transition, keeping supplier bargaining power elevated.
Precision equipment and spare parts
Critical tools (PECVD, PVD, laser, stringing/SmartWire) depend on precision components and custom spares, creating concentrated demand for specialized OEMs and tier‑1 sub‑suppliers in 2024. OEM/sub‑supplier concentration gives suppliers pricing power and elevated lead‑time risk for Meyer Burger, with preventive maintenance contracts smoothing uptime but increasing vendor dependence. Qualifying alternate suppliers requires downtime and capex, raising switching costs and operational risk.
Energy, glass, and encapsulant inputs
Modules need energy-intensive glass, EVA/POE and backsheets with regional logistics limits; EU industrial electricity averaged about €0.22/kWh in 2024 (Eurostat), tightening margins and boosting supplier leverage. Local European sourcing lowers geopolitical risk but raises costs versus Asia. Multi-year supply contracts and inventory buffers reduce but do not eliminate input-price exposure.
- Energy: EU industrial €0.22/kWh (2024)
- Inputs: glass, EVA/POE, backsheets
- Risk trade-off: lower geopolitical risk vs higher cost
- Mitigation: multi-year contracts + inventory
IP, licensing, and process know-how
Advanced HJT/SWCT stacks rely on proprietary coatings and co-developed process recipes, and dependence on unique consumables or licensed steps raises royalty exposure and limits negotiation room; protecting core IP in 2024 offsets supplier leverage but interoperability still ties operations to specific vendors, so technical collaborations must be structured to avoid lock-in.
- IP protection reduces supplier bargaining but does not eliminate vendor dependence
- Licensed steps can add mid-single-digit to low-double-digit cost pressure on modules
- Structured collaborations and cross-licensing lower lock-in risk
Supplier concentration (top-3 ~70%) and EU energy €0.22/kWh squeeze margins
Supplier power is high: top‑3 n‑type wafer suppliers hold ~70% capacity (2024), raising switching costs and allocation risk. Critical pastes/chemicals and OEM tools are concentrated in a few vendors, keeping pricing and lead‑time leverage elevated. EU energy €0.22/kWh (2024) and branded IP royalties (mid‑single to low‑double digit %) further pressure margins; long‑term contracts and dual‑sourcing partially mitigate.
| Metric | 2024 |
|---|---|
| Top‑3 wafer share | ~70% |
| EU industrial energy | €0.22/kWh |
What is included in the product
Detailed Word Document
Comprehensive Porter's Five Forces assessment tailored to Meyer Burger, highlighting competitive rivalry, supplier and buyer power, entry barriers, and substitution risks to inform strategic positioning.
Customizable Excel Spreadsheet
A concise Meyer Burger Porter's Five Forces one-sheet that quantifies supplier, buyer, entrant, substitute and rivalry pressures—ideal for quick strategic pivots, boardroom slides, or investor briefings.
Customers Bargaining Power
Large buyers with tender-driven pricing
Utility-scale EPCs, distributors and installers aggregate volumes through competitive tenders that compress supplier margins and enable alternative sourcing. Bankability criteria (IEC/UL, 25-year performance/warranty, typical end-of-life ≥80% with ~0.5%/yr degradation) push tight specs and favor buyers. Meyer Burger must defend pricing by differentiating on higher commercial HJT module performance (>22%), European origin and demonstrated reliability.
Performance premium vs price sensitivity
HJT cell efficiencies reached ~25–26% in 2024 with stronger low‑temperature performance, supporting a performance premium, but buyers still benchmark on $/W where TOPCon spot prices dipped to about $0.14/W in 2024, pressuring discounts. Demonstrated LCOE advantages of roughly 5–12% and lower degradation rates (~0.25%/yr vs 0.5%/yr) justify premiums in selective segments, and education plus TCO tools reduce pure price bargaining.
Switching costs vary by segment
Equipment buyers face high switching costs from line integration, proprietary process IP and long commissioning cycles, while module buyers have moderate switching costs thanks to standardized M10/G12 form factors and IEC 61215/61730 certifications. Framework agreements and multi-year project pipelines increase customer dependence over time. After-sales 24/7 service and uptime SLAs (commonly >98%) materially lower propensity to switch.
Policy and subsidy pass-through
Quality, warranty, and bankability leverage
Buyers push Meyer Burger for extended warranties, liquidated damages and performance guarantees, tying concessions to the companys field-proven yield and balance-sheet strength.
Claims risk and warranty reserves are core to price talks; lenders and finance partners increasingly demand third-party testing and insurer or bank endorsements to lower buyer leverage.
- Buyers: extended warranties, LDs, performance guarantees
- Prerequisites: strong balance sheet, field data, third-party test
- Price drivers: claims risk, warranty reserves
- Mitigants: finance partner endorsements, insurer backing
Buyers demand warranties as HJT 25-26% vs TOPCon $0.14/W squeezes premiums
Meyer Burger faces strong buyer leverage: utility EPCs and distributors compress margins via tenders and expect subsidy pass-through (IRA/EU 2024). HJT performance (25–26% in 2024) and LCOE edge (5–12%) justify selective premiums versus TOPCon ~$0.14/W, but buyers demand warranties, LDs and bankable third‑party tests.
| Metric | 2024 Value | Buyer Impact |
|---|---|---|
| HJT eff. | 25–26% | Performance premium |
| TOPCon price | $0.14/W | Price pressure |
| Degradation | ~0.25%/yr vs 0.5% | Warranty leverage |
| SLAs | >98% | Switching cost |
Preview the Actual Deliverable
Meyer Burger Porter's Five Forces Analysis
This preview shows the exact Meyer Burger Porter's Five Forces analysis you'll receive immediately after purchase—no placeholders. The document is fully formatted, ready for download and use, and contains the complete assessment of competitive rivalry, supplier and buyer power, and threats of entry and substitutes. You get instant access to this exact file upon payment.
Original: $10.00
-65%$10.00
$3.50Description
Elevate Your Analysis with the Complete Porter's Five Forces Analysis
Meyer Burger faces moderate supplier power and rising buyer sophistication amid growing PV competition, while scale and tech differentiation limit new entrants and substitutes. This brief snapshot only scratches the surface. Unlock the full Porter's Five Forces Analysis to explore Meyer Burger’s competitive dynamics and actionable insights.
Suppliers Bargaining Power
Concentrated high-purity wafer sources
HJT cell performance depends on n-type, low-defect wafers supplied by a concentrated upstream set; the top three suppliers control roughly 70% of high-purity n-type wafer capacity in 2024, raising switching costs and pricing leverage. Limited qualified sources increase allocation risk; long-term offtakes and dual-sourcing reduce but do not eliminate dependence. Any disruption directly cuts yield and throughput, impacting margins and project timelines.
Silver paste and specialty materials intensity
HJT lines consume significant silver paste and specialty chemicals/gases, where in 2024 only a handful of vendors met the tight formulation and purity specs required, boosting supplier leverage. Material-cost volatility and formulation lock-in raise switching costs, while process requalification to alternative pastes is time-consuming and risky for yield. Ongoing silver-thrifting in 2024 has reduced exposure but remains a multi-year transition, keeping supplier bargaining power elevated.
Precision equipment and spare parts
Critical tools (PECVD, PVD, laser, stringing/SmartWire) depend on precision components and custom spares, creating concentrated demand for specialized OEMs and tier‑1 sub‑suppliers in 2024. OEM/sub‑supplier concentration gives suppliers pricing power and elevated lead‑time risk for Meyer Burger, with preventive maintenance contracts smoothing uptime but increasing vendor dependence. Qualifying alternate suppliers requires downtime and capex, raising switching costs and operational risk.
Energy, glass, and encapsulant inputs
Modules need energy-intensive glass, EVA/POE and backsheets with regional logistics limits; EU industrial electricity averaged about €0.22/kWh in 2024 (Eurostat), tightening margins and boosting supplier leverage. Local European sourcing lowers geopolitical risk but raises costs versus Asia. Multi-year supply contracts and inventory buffers reduce but do not eliminate input-price exposure.
- Energy: EU industrial €0.22/kWh (2024)
- Inputs: glass, EVA/POE, backsheets
- Risk trade-off: lower geopolitical risk vs higher cost
- Mitigation: multi-year contracts + inventory
IP, licensing, and process know-how
Advanced HJT/SWCT stacks rely on proprietary coatings and co-developed process recipes, and dependence on unique consumables or licensed steps raises royalty exposure and limits negotiation room; protecting core IP in 2024 offsets supplier leverage but interoperability still ties operations to specific vendors, so technical collaborations must be structured to avoid lock-in.
- IP protection reduces supplier bargaining but does not eliminate vendor dependence
- Licensed steps can add mid-single-digit to low-double-digit cost pressure on modules
- Structured collaborations and cross-licensing lower lock-in risk
Supplier concentration (top-3 ~70%) and EU energy €0.22/kWh squeeze margins
Supplier power is high: top‑3 n‑type wafer suppliers hold ~70% capacity (2024), raising switching costs and allocation risk. Critical pastes/chemicals and OEM tools are concentrated in a few vendors, keeping pricing and lead‑time leverage elevated. EU energy €0.22/kWh (2024) and branded IP royalties (mid‑single to low‑double digit %) further pressure margins; long‑term contracts and dual‑sourcing partially mitigate.
| Metric | 2024 |
|---|---|
| Top‑3 wafer share | ~70% |
| EU industrial energy | €0.22/kWh |
What is included in the product
Detailed Word Document
Comprehensive Porter's Five Forces assessment tailored to Meyer Burger, highlighting competitive rivalry, supplier and buyer power, entry barriers, and substitution risks to inform strategic positioning.
Customizable Excel Spreadsheet
A concise Meyer Burger Porter's Five Forces one-sheet that quantifies supplier, buyer, entrant, substitute and rivalry pressures—ideal for quick strategic pivots, boardroom slides, or investor briefings.
Customers Bargaining Power
Large buyers with tender-driven pricing
Utility-scale EPCs, distributors and installers aggregate volumes through competitive tenders that compress supplier margins and enable alternative sourcing. Bankability criteria (IEC/UL, 25-year performance/warranty, typical end-of-life ≥80% with ~0.5%/yr degradation) push tight specs and favor buyers. Meyer Burger must defend pricing by differentiating on higher commercial HJT module performance (>22%), European origin and demonstrated reliability.
Performance premium vs price sensitivity
HJT cell efficiencies reached ~25–26% in 2024 with stronger low‑temperature performance, supporting a performance premium, but buyers still benchmark on $/W where TOPCon spot prices dipped to about $0.14/W in 2024, pressuring discounts. Demonstrated LCOE advantages of roughly 5–12% and lower degradation rates (~0.25%/yr vs 0.5%/yr) justify premiums in selective segments, and education plus TCO tools reduce pure price bargaining.
Switching costs vary by segment
Equipment buyers face high switching costs from line integration, proprietary process IP and long commissioning cycles, while module buyers have moderate switching costs thanks to standardized M10/G12 form factors and IEC 61215/61730 certifications. Framework agreements and multi-year project pipelines increase customer dependence over time. After-sales 24/7 service and uptime SLAs (commonly >98%) materially lower propensity to switch.
Policy and subsidy pass-through
Quality, warranty, and bankability leverage
Buyers push Meyer Burger for extended warranties, liquidated damages and performance guarantees, tying concessions to the companys field-proven yield and balance-sheet strength.
Claims risk and warranty reserves are core to price talks; lenders and finance partners increasingly demand third-party testing and insurer or bank endorsements to lower buyer leverage.
- Buyers: extended warranties, LDs, performance guarantees
- Prerequisites: strong balance sheet, field data, third-party test
- Price drivers: claims risk, warranty reserves
- Mitigants: finance partner endorsements, insurer backing
Buyers demand warranties as HJT 25-26% vs TOPCon $0.14/W squeezes premiums
Meyer Burger faces strong buyer leverage: utility EPCs and distributors compress margins via tenders and expect subsidy pass-through (IRA/EU 2024). HJT performance (25–26% in 2024) and LCOE edge (5–12%) justify selective premiums versus TOPCon ~$0.14/W, but buyers demand warranties, LDs and bankable third‑party tests.
| Metric | 2024 Value | Buyer Impact |
|---|---|---|
| HJT eff. | 25–26% | Performance premium |
| TOPCon price | $0.14/W | Price pressure |
| Degradation | ~0.25%/yr vs 0.5% | Warranty leverage |
| SLAs | >98% | Switching cost |
Preview the Actual Deliverable
Meyer Burger Porter's Five Forces Analysis
This preview shows the exact Meyer Burger Porter's Five Forces analysis you'll receive immediately after purchase—no placeholders. The document is fully formatted, ready for download and use, and contains the complete assessment of competitive rivalry, supplier and buyer power, and threats of entry and substitutes. You get instant access to this exact file upon payment.











