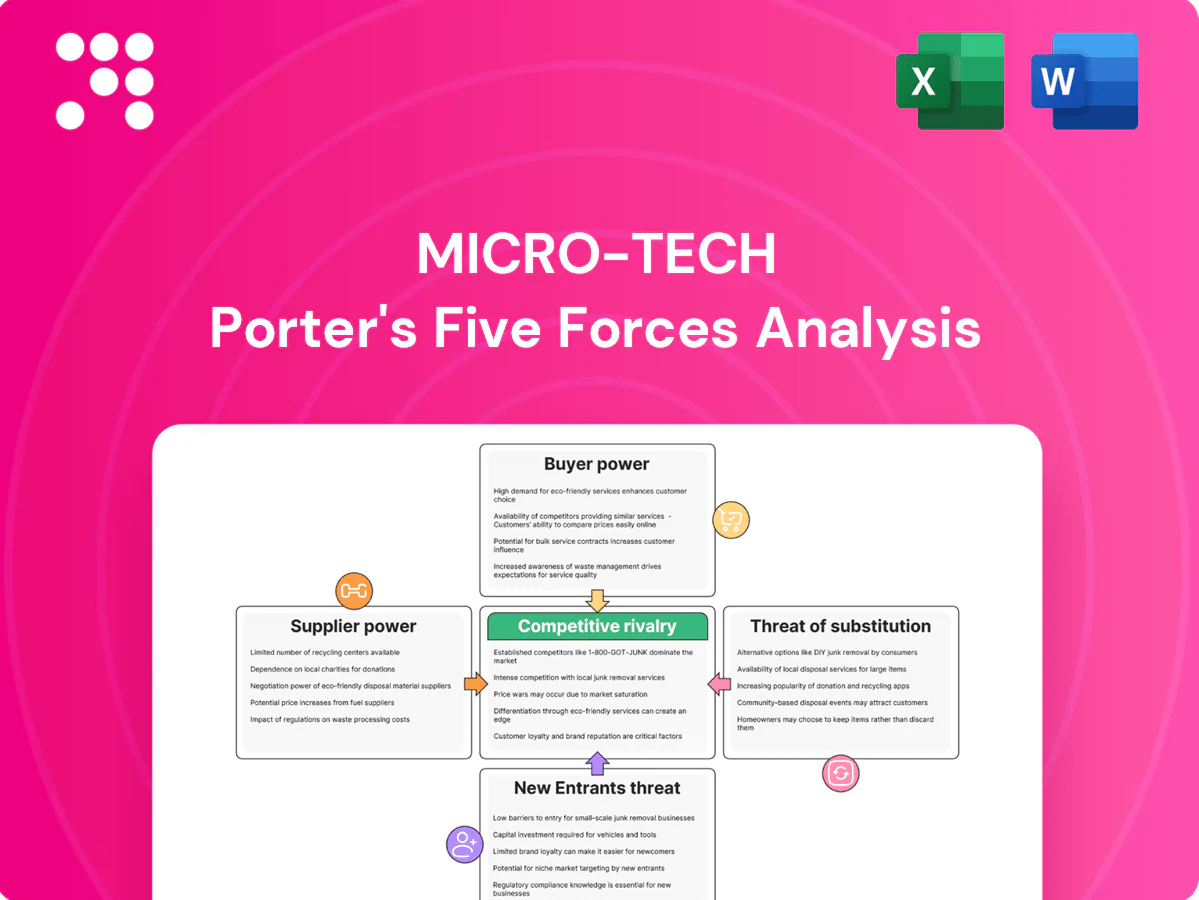
Micro-Tech Porter's Five Forces Analysis

Go Beyond the Preview—Access the Full Strategic Report
Micro-Tech’s Porter's Five Forces snapshot highlights supplier leverage, buyer bargaining, rival intensity and substitute threats shaping its margins and growth prospects. It surfaces strategic vulnerabilities and short-term market pressures. This teaser only scratches the surface—unlock the full Porter's Five Forces Analysis for force-by-force ratings, visuals, and actionable strategy to inform investment or planning.
Suppliers Bargaining Power

Specialty materials concentration
Many Micro-Tech devices rely on nitinol, PTFE, Pebax and precision micro-components sourced from a limited global pool, concentrating supplier power. Supplier concentration raises pricing power and allocation control during demand spikes, increasing procurement risk. Qualification of alternate sources is slow due to biocompatibility testing and regulatory validation, elevating dependency and switching costs for Micro-Tech.
Validated sterilization capacity
Ethylene oxide and gamma sterilization slots are scarce and tightly regulated, with industry-reported lead times of roughly 6–12 weeks in 2024; capacity bottlenecks and tighter emissions rules have cut available commercial throughput by notable margins, enabling service providers to impose timelines and surcharges. Revalidating with a new provider commonly takes 3–6 months and often exceeds 100,000 in direct costs, giving sterilization partners meaningful leverage.

Quality and compliance constraints
Suppliers must comply with ISO 13485:2016, GMP requirements under 21 CFR Part 820 and UDI/traceability rules, narrowing the eligible vendor pool. Rigorous audits, formal change controls and lot-level documentation extend supplier onboarding timelines. Compliance overheads are passed partly to buyers through supplier premiums and surcharges, leaving Micro-Tech with few low-cost alternatives that satisfy regulatory expectations.

Process IP and tooling lock-in
Custom tooling, coatings, and proprietary forming processes create vendor-specific lock-in; 2024 industry estimates show micro-manufacturing tooling and fixturing often cost $0.5–5M with qualification cycles of 6–12 months, making replication costly in time and capital. Replicating tolerances for micro-wires, braids, and endoscopic assemblies requires specialized equipment and validation, raising transfer risks and discouraging rapid supplier switching. This entrenches incumbents’ bargaining position through high exit/entry costs and lead-time advantages.
- Tooling cost: $0.5–5M (2024)
- Qualification: 6–12 months (2024)
- Switching impact: capex + yield/lead-time risks
Geopolitics and logistics volatility
Export controls, tariffs and 2024 shipping disruptions hit high-spec alloys and components, with industry reports showing lead-times spiking roughly 25% and freight surcharges adding 8–15% to unit cost; firms ramp up buffer inventory, raising working capital needs. Suppliers routinely pass through freight and hedging costs, and volatility has increased supplier leverage in tight markets.
- Lead-time spike ~25% (2024)
- Freight/hedging pass-through 8–15%
- Higher buffer inventory → increased working capital
- Stronger supplier leverage in tight supply conditions
Concentrated suppliers, sterilization bottlenecks and high tooling push up costs and working capital
Suppliers of nitinol, PTFE, Pebax and precision micro-components are concentrated, creating pricing and allocation power; switching is slow and costly due to biocompatibility and regulatory validation. Sterilization capacity bottlenecks (6–12 week lead times in 2024) and tooling costs ($0.5–5M) amplify leverage. Freight surcharges (8–15%) and ~25% lead-time spikes raise working capital needs.
| Metric | 2024 Value |
|---|---|
| Sterilization lead time | 6–12 weeks |
| Tooling cost | $0.5–5M |
| Freight/hedging pass-through | 8–15% |
| Lead-time spike | ~25% |
What is included in the product
 Detailed Word Document
Concise Porter's Five Forces assessment tailored for Micro-Tech, uncovering competitive rivalry, supplier and buyer power, entry barriers, substitutes, and emerging disruptors to inform pricing, profitability, and strategic defenses.

 Customizable Excel Spreadsheet
One-sheet Porter's Five Forces for Micro-Tech simplifies strategic pressure into a customizable spider chart—ideal for quick decisions and boardroom slides. No macros, easy to edit, and ready to integrate into Excel dashboards or reports to reflect evolving market conditions.
Customers Bargaining Power

Hospital and GPO leverage
About 90% of hospitals in the US channel purchasing through GPOs and large health systems that aggregate endoscopy, GI, respiratory and urology volume, squeezing suppliers on tiered pricing and rebates. Typical GPO-negotiated discounts run 10–25% and vendor standardization programs can cut list prices and margins roughly 15–20%. Micro-Tech must deploy value-based arguments linking clinical outcomes and total cost of care to defend pricing and preserve share.
Tender-driven pricing
Public tenders prize the lowest compliant bids, and OECD data (2024) show public procurement at roughly 12% of GDP, concentrating buying power and compressing margins. Shorter contract cycles and repeat competitive auctions drive bid margins down, often below 5% in commoditized electronics categories. Open bidding increases visibility into peers’ price floors, forcing Micro-Tech into head-to-head price pressure across multiple SKUs.

Switching and compatibility costs
Clinicians weigh scope compatibility, ergonomics and staff training heavily when switching accessories; a 2024 MEDTECH Insights survey found 62% of hospital end-users cite compatibility as the primary constraint. Where consumables are scope‑specific, switching costs are moderate, prolonging contract lifecycles. However, an estimated 45% of accessories were multi‑vendor compatible in 2024, lowering barriers. Buyers used alternative suppliers to secure average concessions of 5–8% in 2024 procurement rounds.

Clinical evidence expectations
KOLs and procurement committees increasingly require robust outcomes data and real-world evidence; absence of differentiated clinical proof accelerates commoditization and heightens buyer leverage.
- Trials, registries, economic studies required for formulary access
- Stronger evidence reduces buyer bargaining power
- Evidence gaps translate to price pressure and loss of share
Reimbursement sensitivity
Procedure volumes hinge on payer coverage and DRG rates; 2024 CMS IPPS adjustments (~2% increase) still leave hospitals sensitive to cuts, so tighter reimbursement drives trading down to lower-cost devices. Value analysis committees now demand clear ROI for premium features, raising customer price sensitivity and procurement rigor.
- DRG-driven volumes
- Trade-down risk
- ROI scrutiny
- Higher price sensitivity
GPOs govern 90% of hospital buys with 10–25% discounts; 45% multi‑vendor
About 90% of US hospitals buy via GPOs, yielding 10–25% negotiated discounts and vendor standardization cutting margins ~15–20% (2024). Public procurement ~12% of GDP (OECD 2024) concentrates buying power; public tenders push bid margins often below 5%. 45% of accessories were multi‑vendor compatible in 2024, enabling 5–8% buyer concessions and raising price sensitivity amid modest CMS IPPS +2% (2024).
| Metric | 2024 Value |
|---|---|
| Hospitals via GPOs | 90% |
| GPO Discounts | 10–25% |
| Public procurement | ~12% GDP |
| Multi‑vendor compatibility | 45% |
| Buyer concessions | 5–8% |
| CMS IPPS adj. | +2% |
What You See Is What You Get
Micro-Tech Porter's Five Forces Analysis
This preview shows the exact Micro‑Tech Porter’s Five Forces Analysis you'll receive immediately after purchase—no surprises, no placeholders. The document is fully formatted, professionally written, and ready for download and use the moment you buy. You're looking at the final deliverable; once you complete your purchase, you’ll get instant access to this exact file.

Go Beyond the Preview—Access the Full Strategic Report
Micro-Tech’s Porter's Five Forces snapshot highlights supplier leverage, buyer bargaining, rival intensity and substitute threats shaping its margins and growth prospects. It surfaces strategic vulnerabilities and short-term market pressures. This teaser only scratches the surface—unlock the full Porter's Five Forces Analysis for force-by-force ratings, visuals, and actionable strategy to inform investment or planning.
Suppliers Bargaining Power
Specialty materials concentration
Many Micro-Tech devices rely on nitinol, PTFE, Pebax and precision micro-components sourced from a limited global pool, concentrating supplier power. Supplier concentration raises pricing power and allocation control during demand spikes, increasing procurement risk. Qualification of alternate sources is slow due to biocompatibility testing and regulatory validation, elevating dependency and switching costs for Micro-Tech.
Validated sterilization capacity
Ethylene oxide and gamma sterilization slots are scarce and tightly regulated, with industry-reported lead times of roughly 6–12 weeks in 2024; capacity bottlenecks and tighter emissions rules have cut available commercial throughput by notable margins, enabling service providers to impose timelines and surcharges. Revalidating with a new provider commonly takes 3–6 months and often exceeds 100,000 in direct costs, giving sterilization partners meaningful leverage.
Quality and compliance constraints
Suppliers must comply with ISO 13485:2016, GMP requirements under 21 CFR Part 820 and UDI/traceability rules, narrowing the eligible vendor pool. Rigorous audits, formal change controls and lot-level documentation extend supplier onboarding timelines. Compliance overheads are passed partly to buyers through supplier premiums and surcharges, leaving Micro-Tech with few low-cost alternatives that satisfy regulatory expectations.
Process IP and tooling lock-in
Custom tooling, coatings, and proprietary forming processes create vendor-specific lock-in; 2024 industry estimates show micro-manufacturing tooling and fixturing often cost $0.5–5M with qualification cycles of 6–12 months, making replication costly in time and capital. Replicating tolerances for micro-wires, braids, and endoscopic assemblies requires specialized equipment and validation, raising transfer risks and discouraging rapid supplier switching. This entrenches incumbents’ bargaining position through high exit/entry costs and lead-time advantages.
- Tooling cost: $0.5–5M (2024)
- Qualification: 6–12 months (2024)
- Switching impact: capex + yield/lead-time risks
Geopolitics and logistics volatility
Export controls, tariffs and 2024 shipping disruptions hit high-spec alloys and components, with industry reports showing lead-times spiking roughly 25% and freight surcharges adding 8–15% to unit cost; firms ramp up buffer inventory, raising working capital needs. Suppliers routinely pass through freight and hedging costs, and volatility has increased supplier leverage in tight markets.
- Lead-time spike ~25% (2024)
- Freight/hedging pass-through 8–15%
- Higher buffer inventory → increased working capital
- Stronger supplier leverage in tight supply conditions
Concentrated suppliers, sterilization bottlenecks and high tooling push up costs and working capital
Suppliers of nitinol, PTFE, Pebax and precision micro-components are concentrated, creating pricing and allocation power; switching is slow and costly due to biocompatibility and regulatory validation. Sterilization capacity bottlenecks (6–12 week lead times in 2024) and tooling costs ($0.5–5M) amplify leverage. Freight surcharges (8–15%) and ~25% lead-time spikes raise working capital needs.
| Metric | 2024 Value |
|---|---|
| Sterilization lead time | 6–12 weeks |
| Tooling cost | $0.5–5M |
| Freight/hedging pass-through | 8–15% |
| Lead-time spike | ~25% |
What is included in the product
Detailed Word Document
Concise Porter's Five Forces assessment tailored for Micro-Tech, uncovering competitive rivalry, supplier and buyer power, entry barriers, substitutes, and emerging disruptors to inform pricing, profitability, and strategic defenses.
Customizable Excel Spreadsheet
One-sheet Porter's Five Forces for Micro-Tech simplifies strategic pressure into a customizable spider chart—ideal for quick decisions and boardroom slides. No macros, easy to edit, and ready to integrate into Excel dashboards or reports to reflect evolving market conditions.
Customers Bargaining Power
Hospital and GPO leverage
About 90% of hospitals in the US channel purchasing through GPOs and large health systems that aggregate endoscopy, GI, respiratory and urology volume, squeezing suppliers on tiered pricing and rebates. Typical GPO-negotiated discounts run 10–25% and vendor standardization programs can cut list prices and margins roughly 15–20%. Micro-Tech must deploy value-based arguments linking clinical outcomes and total cost of care to defend pricing and preserve share.
Tender-driven pricing
Public tenders prize the lowest compliant bids, and OECD data (2024) show public procurement at roughly 12% of GDP, concentrating buying power and compressing margins. Shorter contract cycles and repeat competitive auctions drive bid margins down, often below 5% in commoditized electronics categories. Open bidding increases visibility into peers’ price floors, forcing Micro-Tech into head-to-head price pressure across multiple SKUs.
Switching and compatibility costs
Clinicians weigh scope compatibility, ergonomics and staff training heavily when switching accessories; a 2024 MEDTECH Insights survey found 62% of hospital end-users cite compatibility as the primary constraint. Where consumables are scope‑specific, switching costs are moderate, prolonging contract lifecycles. However, an estimated 45% of accessories were multi‑vendor compatible in 2024, lowering barriers. Buyers used alternative suppliers to secure average concessions of 5–8% in 2024 procurement rounds.
Clinical evidence expectations
KOLs and procurement committees increasingly require robust outcomes data and real-world evidence; absence of differentiated clinical proof accelerates commoditization and heightens buyer leverage.
- Trials, registries, economic studies required for formulary access
- Stronger evidence reduces buyer bargaining power
- Evidence gaps translate to price pressure and loss of share
Reimbursement sensitivity
Procedure volumes hinge on payer coverage and DRG rates; 2024 CMS IPPS adjustments (~2% increase) still leave hospitals sensitive to cuts, so tighter reimbursement drives trading down to lower-cost devices. Value analysis committees now demand clear ROI for premium features, raising customer price sensitivity and procurement rigor.
- DRG-driven volumes
- Trade-down risk
- ROI scrutiny
- Higher price sensitivity
GPOs govern 90% of hospital buys with 10–25% discounts; 45% multi‑vendor
About 90% of US hospitals buy via GPOs, yielding 10–25% negotiated discounts and vendor standardization cutting margins ~15–20% (2024). Public procurement ~12% of GDP (OECD 2024) concentrates buying power; public tenders push bid margins often below 5%. 45% of accessories were multi‑vendor compatible in 2024, enabling 5–8% buyer concessions and raising price sensitivity amid modest CMS IPPS +2% (2024).
| Metric | 2024 Value |
|---|---|
| Hospitals via GPOs | 90% |
| GPO Discounts | 10–25% |
| Public procurement | ~12% GDP |
| Multi‑vendor compatibility | 45% |
| Buyer concessions | 5–8% |
| CMS IPPS adj. | +2% |
What You See Is What You Get
Micro-Tech Porter's Five Forces Analysis
This preview shows the exact Micro‑Tech Porter’s Five Forces Analysis you'll receive immediately after purchase—no surprises, no placeholders. The document is fully formatted, professionally written, and ready for download and use the moment you buy. You're looking at the final deliverable; once you complete your purchase, you’ll get instant access to this exact file.
Original: $10.00
-65%$10.00
$3.50Description
Go Beyond the Preview—Access the Full Strategic Report
Micro-Tech’s Porter's Five Forces snapshot highlights supplier leverage, buyer bargaining, rival intensity and substitute threats shaping its margins and growth prospects. It surfaces strategic vulnerabilities and short-term market pressures. This teaser only scratches the surface—unlock the full Porter's Five Forces Analysis for force-by-force ratings, visuals, and actionable strategy to inform investment or planning.
Suppliers Bargaining Power
Specialty materials concentration
Many Micro-Tech devices rely on nitinol, PTFE, Pebax and precision micro-components sourced from a limited global pool, concentrating supplier power. Supplier concentration raises pricing power and allocation control during demand spikes, increasing procurement risk. Qualification of alternate sources is slow due to biocompatibility testing and regulatory validation, elevating dependency and switching costs for Micro-Tech.
Validated sterilization capacity
Ethylene oxide and gamma sterilization slots are scarce and tightly regulated, with industry-reported lead times of roughly 6–12 weeks in 2024; capacity bottlenecks and tighter emissions rules have cut available commercial throughput by notable margins, enabling service providers to impose timelines and surcharges. Revalidating with a new provider commonly takes 3–6 months and often exceeds 100,000 in direct costs, giving sterilization partners meaningful leverage.
Quality and compliance constraints
Suppliers must comply with ISO 13485:2016, GMP requirements under 21 CFR Part 820 and UDI/traceability rules, narrowing the eligible vendor pool. Rigorous audits, formal change controls and lot-level documentation extend supplier onboarding timelines. Compliance overheads are passed partly to buyers through supplier premiums and surcharges, leaving Micro-Tech with few low-cost alternatives that satisfy regulatory expectations.
Process IP and tooling lock-in
Custom tooling, coatings, and proprietary forming processes create vendor-specific lock-in; 2024 industry estimates show micro-manufacturing tooling and fixturing often cost $0.5–5M with qualification cycles of 6–12 months, making replication costly in time and capital. Replicating tolerances for micro-wires, braids, and endoscopic assemblies requires specialized equipment and validation, raising transfer risks and discouraging rapid supplier switching. This entrenches incumbents’ bargaining position through high exit/entry costs and lead-time advantages.
- Tooling cost: $0.5–5M (2024)
- Qualification: 6–12 months (2024)
- Switching impact: capex + yield/lead-time risks
Geopolitics and logistics volatility
Export controls, tariffs and 2024 shipping disruptions hit high-spec alloys and components, with industry reports showing lead-times spiking roughly 25% and freight surcharges adding 8–15% to unit cost; firms ramp up buffer inventory, raising working capital needs. Suppliers routinely pass through freight and hedging costs, and volatility has increased supplier leverage in tight markets.
- Lead-time spike ~25% (2024)
- Freight/hedging pass-through 8–15%
- Higher buffer inventory → increased working capital
- Stronger supplier leverage in tight supply conditions
Concentrated suppliers, sterilization bottlenecks and high tooling push up costs and working capital
Suppliers of nitinol, PTFE, Pebax and precision micro-components are concentrated, creating pricing and allocation power; switching is slow and costly due to biocompatibility and regulatory validation. Sterilization capacity bottlenecks (6–12 week lead times in 2024) and tooling costs ($0.5–5M) amplify leverage. Freight surcharges (8–15%) and ~25% lead-time spikes raise working capital needs.
| Metric | 2024 Value |
|---|---|
| Sterilization lead time | 6–12 weeks |
| Tooling cost | $0.5–5M |
| Freight/hedging pass-through | 8–15% |
| Lead-time spike | ~25% |
What is included in the product
Detailed Word Document
Concise Porter's Five Forces assessment tailored for Micro-Tech, uncovering competitive rivalry, supplier and buyer power, entry barriers, substitutes, and emerging disruptors to inform pricing, profitability, and strategic defenses.
Customizable Excel Spreadsheet
One-sheet Porter's Five Forces for Micro-Tech simplifies strategic pressure into a customizable spider chart—ideal for quick decisions and boardroom slides. No macros, easy to edit, and ready to integrate into Excel dashboards or reports to reflect evolving market conditions.
Customers Bargaining Power
Hospital and GPO leverage
About 90% of hospitals in the US channel purchasing through GPOs and large health systems that aggregate endoscopy, GI, respiratory and urology volume, squeezing suppliers on tiered pricing and rebates. Typical GPO-negotiated discounts run 10–25% and vendor standardization programs can cut list prices and margins roughly 15–20%. Micro-Tech must deploy value-based arguments linking clinical outcomes and total cost of care to defend pricing and preserve share.
Tender-driven pricing
Public tenders prize the lowest compliant bids, and OECD data (2024) show public procurement at roughly 12% of GDP, concentrating buying power and compressing margins. Shorter contract cycles and repeat competitive auctions drive bid margins down, often below 5% in commoditized electronics categories. Open bidding increases visibility into peers’ price floors, forcing Micro-Tech into head-to-head price pressure across multiple SKUs.
Switching and compatibility costs
Clinicians weigh scope compatibility, ergonomics and staff training heavily when switching accessories; a 2024 MEDTECH Insights survey found 62% of hospital end-users cite compatibility as the primary constraint. Where consumables are scope‑specific, switching costs are moderate, prolonging contract lifecycles. However, an estimated 45% of accessories were multi‑vendor compatible in 2024, lowering barriers. Buyers used alternative suppliers to secure average concessions of 5–8% in 2024 procurement rounds.
Clinical evidence expectations
KOLs and procurement committees increasingly require robust outcomes data and real-world evidence; absence of differentiated clinical proof accelerates commoditization and heightens buyer leverage.
- Trials, registries, economic studies required for formulary access
- Stronger evidence reduces buyer bargaining power
- Evidence gaps translate to price pressure and loss of share
Reimbursement sensitivity
Procedure volumes hinge on payer coverage and DRG rates; 2024 CMS IPPS adjustments (~2% increase) still leave hospitals sensitive to cuts, so tighter reimbursement drives trading down to lower-cost devices. Value analysis committees now demand clear ROI for premium features, raising customer price sensitivity and procurement rigor.
- DRG-driven volumes
- Trade-down risk
- ROI scrutiny
- Higher price sensitivity
GPOs govern 90% of hospital buys with 10–25% discounts; 45% multi‑vendor
About 90% of US hospitals buy via GPOs, yielding 10–25% negotiated discounts and vendor standardization cutting margins ~15–20% (2024). Public procurement ~12% of GDP (OECD 2024) concentrates buying power; public tenders push bid margins often below 5%. 45% of accessories were multi‑vendor compatible in 2024, enabling 5–8% buyer concessions and raising price sensitivity amid modest CMS IPPS +2% (2024).
| Metric | 2024 Value |
|---|---|
| Hospitals via GPOs | 90% |
| GPO Discounts | 10–25% |
| Public procurement | ~12% GDP |
| Multi‑vendor compatibility | 45% |
| Buyer concessions | 5–8% |
| CMS IPPS adj. | +2% |
What You See Is What You Get
Micro-Tech Porter's Five Forces Analysis
This preview shows the exact Micro‑Tech Porter’s Five Forces Analysis you'll receive immediately after purchase—no surprises, no placeholders. The document is fully formatted, professionally written, and ready for download and use the moment you buy. You're looking at the final deliverable; once you complete your purchase, you’ll get instant access to this exact file.











