Micro Electronics PESTLE Analysis

Plan Smarter. Present Sharper. Compete Stronger.
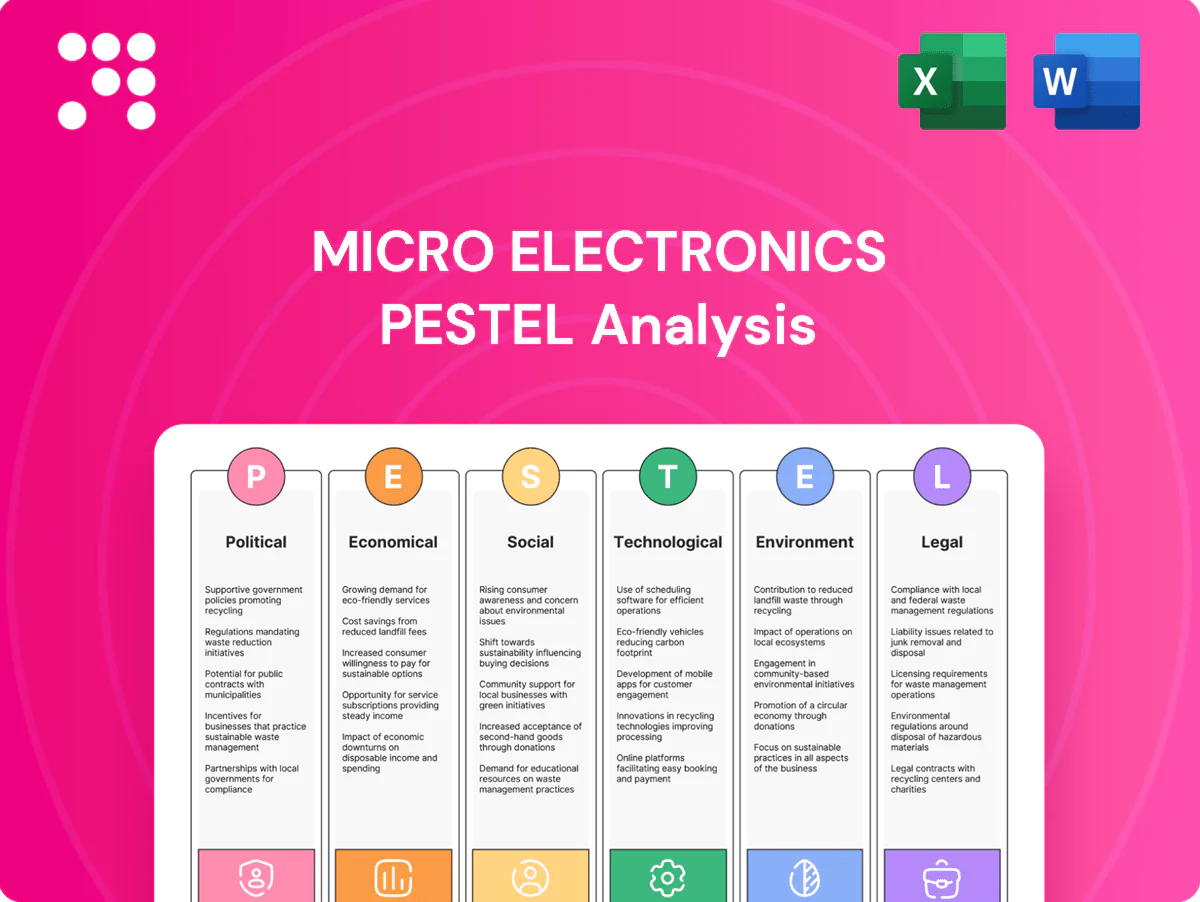
Discover how political shifts, economic cycles, social trends, technological advances, legal changes, and environmental risks are shaping Micro Electronics' strategic path in our concise PESTLE snapshot. This analysis highlights actionable threats and opportunities to inform investment and competitive decisions. Purchase the full PESTLE report for detailed insights, data-driven scenarios, and ready-to-use recommendations.
Political factors

Trade policy and tariffs on electronics
Import duties under US Section 301—with rates on many Chinese electronics items up to 25%—directly raise landed costs and compress pricing flexibility for micro‑electronics suppliers. Rapid shifts in U.S.–China relations can force quick sourcing changes, squeezing margins as lead times and freight rates move. Active vendor diversification into Taiwan, Vietnam and Korea has become common to reduce exposure to tariff shocks.
State and local tax incentives for retail
Store expansion often leverages local incentives, zoning approvals and sales tax holidays—about two dozen states ran sales tax holidays in recent years—lowering opening costs and accelerating ROI. Policy variability across states drives where Micro Electronics locates stores and times promotions to coincide with tax holidays. Coordinating with municipalities for TIFs or grants (commonly $500K–$5M for retail projects) boosts traffic and community ties.

Infrastructure and broadband initiatives
Public investment such as the US BEAD program’s $42.45 billion and the EU Digital Decade push for gigabit-ready households by 2025 strengthen e-commerce reliability by funding backbone and logistics upgrades. Improved last‑mile networks cut delivery exceptions and raise customer satisfaction, expanding repeat purchase rates. Policy-driven upgrades can bring a larger share of the ~5.3 billion global internet users online-ready, enlarging addressable online demand.

Government procurement and STEM programs
Government procurement and STEM program investment, exemplified by the CHIPS and Science Act allocating 52 billion dollars for semiconductors, drives demand for PCs and components and increases institutional orders. Participation on approved vendor lists and procurement schedules unlocks bulk sales to federal and educational buyers. Aligning assortments to curriculum standards raises adoption rates among school districts and public labs.
- CHIPS Act 52B boosts component demand
- Approved vendor programs enable bulk contracts
- Curriculum-aligned assortments improve institutional uptake
E-waste and sustainability mandates
Producer responsibility laws force take‑back programs and reverse logistics, reshaping capex and OPEX; global e‑waste reached 60.1 Mt in 2023 and EU EPR fees rose ~20% in 2024, raising compliance costs. Political momentum for circular economy policies increases regulatory burden. Proactive recycling offerings can convert mandates into customer value and new revenue streams.
- Producer responsibility: mandates reverse logistics
- Scale: 60.1 Mt e‑waste (2023)
- Cost impact: EU EPR fees +20% (2024)
- Opportunity: recycling as customer value
Tariffs, CHIPS/BEAD funding and tighter e‑waste rules squeeze costs and spur recycling
Tariffs (Section 301 up to 25%) and US–China tensions raise landed costs and force rapid sourcing shifts, squeezing margins. Incentives, zoning and tax holidays shape store expansion and ROI timing. Public programs (CHIPS $52B; BEAD $42.45B) boost institutional and online demand while e‑waste rules (60.1 Mt 2023; EU EPR +20% 2024) raise reverse‑logistics costs and create recycling opportunities.
| Item | Key figure |
|---|---|
| Section 301 tariffs | up to 25% |
| CHIPS Act | $52B |
| BEAD program | $42.45B |
| Global e‑waste 2023 | 60.1 Mt |
| EU EPR fees 2024 | +20% |
What is included in the product
 Detailed Word Document
Explores how Political, Economic, Social, Technological, Environmental and Legal forces uniquely shape Micro Electronics, with data-backed trends and region-specific market and regulatory context. Designed for executives and investors, it highlights threats, opportunities and forward-looking scenarios to inform strategy and funding decisions.

 Customizable Excel Spreadsheet
A concise, visually segmented PESTLE snapshot for Micro Electronics that relieves time-consuming external-risk research, simplifies market-positioning discussions, and is ready to drop into presentations or share across teams for quick alignment.
Economic factors

Consumer spending and discretionary cycles
PC and gaming purchases track income, consumer confidence (~100 on the Conference Board index in 2024) and employment (US unemployment ~4% in 2024), making demand cyclical. During downturns buyers shift to value tiers and refurbished units, with refurb sales and entry laptops gaining share. In upswings premium GPUs, high-end CPUs and peripherals outpace growth as gamers trade up.
Inflation and cost pass-through
Input inflation in semiconductors and freight pressures are shaping pricing strategies, with the global semiconductor market near $600B in 2024 and container freight rates roughly 70% below 2021 peaks but still volatile.
Selective pass‑through risks demand elasticity and competitive share loss—consumer studies indicate 30–40% may switch brands after price hikes in electronics categories.
Private‑label and bundle tactics have defended margins, with many retailers gaining 1–3 percentage points of private‑label share in 2023–24.

Supply chain volatility in semiconductors
Chip shortages or gluts swing availability, lead times and ASPs; lead times peaked near 26 weeks in 2021 and eased to roughly 12 weeks by 2024. Agile allocation and multi-sourcing reduce hot‑SKU stockouts and dampen ASP volatility across product tiers. Real‑time demand sensing has lifted inventory turns by up to 15%, improving cash flow and working capital efficiency.

Interest rates and financing options
Higher policy rates (US fed funds ~5.25–5.50% mid‑2025) dampen big‑ticket PC and server refreshes and reduce captive financing uptake; borrowing costs are ~300 bps higher than 2021, raising inventory carrying costs and working capital pressure for microelectronics distributors.
- Promotional APRs/0% and BNPL (adoption ~11% of US e‑commerce 2024) sustain conversion on high‑end builds
- Inventory carrying cost rise ≈2–3% pts vs 2021
Currency movements impacting vendor pricing
FX shifts (major pairs saw >5% swings in 2024) directly alter OEM wholesale prices and force promo-calendar adjustments; suppliers hedging often lags by 1–3 months, creating short-term price mismatches. Fast repricing combined with transparent messaging preserves channel trust and reduces inventory markdown risk.
- FX swings >5% (2024)
- Hedging lag 1–3 months
- Prioritize fast repricing + clear communication
Tariffs, CHIPS/BEAD funding and tighter e‑waste rules squeeze costs and spur recycling
Demand is cyclical—consumer confidence ~100 (2024) and US unemployment ~4% drive shifts to value/refurb in downturns and premium upgrades in upswings. Input inflation, freight and FX (>5% swings in 2024) pressure ASPs. Fed funds ~5.25–5.50% (mid‑2025) raises carrying costs and curbs refreshes.
| Metric | 2024/2025 |
|---|---|
| Semiconductor market | $600B |
| Consumer confidence | ~100 |
| Fed funds | 5.25–5.50% |
Full Version Awaits
Micro Electronics PESTLE Analysis
The preview shown here is the exact Micro Electronics PESTLE Analysis you’ll receive after purchase—fully formatted and ready to use. It includes the complete political, economic, social, technological, legal, and environmental assessments as displayed, with no placeholders or edits required. After payment you’ll instantly download this same professional, final document.

Plan Smarter. Present Sharper. Compete Stronger.
Discover how political shifts, economic cycles, social trends, technological advances, legal changes, and environmental risks are shaping Micro Electronics' strategic path in our concise PESTLE snapshot. This analysis highlights actionable threats and opportunities to inform investment and competitive decisions. Purchase the full PESTLE report for detailed insights, data-driven scenarios, and ready-to-use recommendations.
Political factors
Trade policy and tariffs on electronics
Import duties under US Section 301—with rates on many Chinese electronics items up to 25%—directly raise landed costs and compress pricing flexibility for micro‑electronics suppliers. Rapid shifts in U.S.–China relations can force quick sourcing changes, squeezing margins as lead times and freight rates move. Active vendor diversification into Taiwan, Vietnam and Korea has become common to reduce exposure to tariff shocks.
State and local tax incentives for retail
Store expansion often leverages local incentives, zoning approvals and sales tax holidays—about two dozen states ran sales tax holidays in recent years—lowering opening costs and accelerating ROI. Policy variability across states drives where Micro Electronics locates stores and times promotions to coincide with tax holidays. Coordinating with municipalities for TIFs or grants (commonly $500K–$5M for retail projects) boosts traffic and community ties.
Infrastructure and broadband initiatives
Public investment such as the US BEAD program’s $42.45 billion and the EU Digital Decade push for gigabit-ready households by 2025 strengthen e-commerce reliability by funding backbone and logistics upgrades. Improved last‑mile networks cut delivery exceptions and raise customer satisfaction, expanding repeat purchase rates. Policy-driven upgrades can bring a larger share of the ~5.3 billion global internet users online-ready, enlarging addressable online demand.
Government procurement and STEM programs
Government procurement and STEM program investment, exemplified by the CHIPS and Science Act allocating 52 billion dollars for semiconductors, drives demand for PCs and components and increases institutional orders. Participation on approved vendor lists and procurement schedules unlocks bulk sales to federal and educational buyers. Aligning assortments to curriculum standards raises adoption rates among school districts and public labs.
- CHIPS Act 52B boosts component demand
- Approved vendor programs enable bulk contracts
- Curriculum-aligned assortments improve institutional uptake
E-waste and sustainability mandates
Producer responsibility laws force take‑back programs and reverse logistics, reshaping capex and OPEX; global e‑waste reached 60.1 Mt in 2023 and EU EPR fees rose ~20% in 2024, raising compliance costs. Political momentum for circular economy policies increases regulatory burden. Proactive recycling offerings can convert mandates into customer value and new revenue streams.
- Producer responsibility: mandates reverse logistics
- Scale: 60.1 Mt e‑waste (2023)
- Cost impact: EU EPR fees +20% (2024)
- Opportunity: recycling as customer value
Tariffs, CHIPS/BEAD funding and tighter e‑waste rules squeeze costs and spur recycling
Tariffs (Section 301 up to 25%) and US–China tensions raise landed costs and force rapid sourcing shifts, squeezing margins. Incentives, zoning and tax holidays shape store expansion and ROI timing. Public programs (CHIPS $52B; BEAD $42.45B) boost institutional and online demand while e‑waste rules (60.1 Mt 2023; EU EPR +20% 2024) raise reverse‑logistics costs and create recycling opportunities.
| Item | Key figure |
|---|---|
| Section 301 tariffs | up to 25% |
| CHIPS Act | $52B |
| BEAD program | $42.45B |
| Global e‑waste 2023 | 60.1 Mt |
| EU EPR fees 2024 | +20% |
What is included in the product
Detailed Word Document
Explores how Political, Economic, Social, Technological, Environmental and Legal forces uniquely shape Micro Electronics, with data-backed trends and region-specific market and regulatory context. Designed for executives and investors, it highlights threats, opportunities and forward-looking scenarios to inform strategy and funding decisions.
Customizable Excel Spreadsheet
A concise, visually segmented PESTLE snapshot for Micro Electronics that relieves time-consuming external-risk research, simplifies market-positioning discussions, and is ready to drop into presentations or share across teams for quick alignment.
Economic factors
Consumer spending and discretionary cycles
PC and gaming purchases track income, consumer confidence (~100 on the Conference Board index in 2024) and employment (US unemployment ~4% in 2024), making demand cyclical. During downturns buyers shift to value tiers and refurbished units, with refurb sales and entry laptops gaining share. In upswings premium GPUs, high-end CPUs and peripherals outpace growth as gamers trade up.
Inflation and cost pass-through
Input inflation in semiconductors and freight pressures are shaping pricing strategies, with the global semiconductor market near $600B in 2024 and container freight rates roughly 70% below 2021 peaks but still volatile.
Selective pass‑through risks demand elasticity and competitive share loss—consumer studies indicate 30–40% may switch brands after price hikes in electronics categories.
Private‑label and bundle tactics have defended margins, with many retailers gaining 1–3 percentage points of private‑label share in 2023–24.
Supply chain volatility in semiconductors
Chip shortages or gluts swing availability, lead times and ASPs; lead times peaked near 26 weeks in 2021 and eased to roughly 12 weeks by 2024. Agile allocation and multi-sourcing reduce hot‑SKU stockouts and dampen ASP volatility across product tiers. Real‑time demand sensing has lifted inventory turns by up to 15%, improving cash flow and working capital efficiency.
Interest rates and financing options
Higher policy rates (US fed funds ~5.25–5.50% mid‑2025) dampen big‑ticket PC and server refreshes and reduce captive financing uptake; borrowing costs are ~300 bps higher than 2021, raising inventory carrying costs and working capital pressure for microelectronics distributors.
- Promotional APRs/0% and BNPL (adoption ~11% of US e‑commerce 2024) sustain conversion on high‑end builds
- Inventory carrying cost rise ≈2–3% pts vs 2021
Currency movements impacting vendor pricing
FX shifts (major pairs saw >5% swings in 2024) directly alter OEM wholesale prices and force promo-calendar adjustments; suppliers hedging often lags by 1–3 months, creating short-term price mismatches. Fast repricing combined with transparent messaging preserves channel trust and reduces inventory markdown risk.
- FX swings >5% (2024)
- Hedging lag 1–3 months
- Prioritize fast repricing + clear communication
Tariffs, CHIPS/BEAD funding and tighter e‑waste rules squeeze costs and spur recycling
Demand is cyclical—consumer confidence ~100 (2024) and US unemployment ~4% drive shifts to value/refurb in downturns and premium upgrades in upswings. Input inflation, freight and FX (>5% swings in 2024) pressure ASPs. Fed funds ~5.25–5.50% (mid‑2025) raises carrying costs and curbs refreshes.
| Metric | 2024/2025 |
|---|---|
| Semiconductor market | $600B |
| Consumer confidence | ~100 |
| Fed funds | 5.25–5.50% |
Full Version Awaits
Micro Electronics PESTLE Analysis
The preview shown here is the exact Micro Electronics PESTLE Analysis you’ll receive after purchase—fully formatted and ready to use. It includes the complete political, economic, social, technological, legal, and environmental assessments as displayed, with no placeholders or edits required. After payment you’ll instantly download this same professional, final document.
Original: $10.00
-65%$10.00
$3.50Description
Plan Smarter. Present Sharper. Compete Stronger.
Discover how political shifts, economic cycles, social trends, technological advances, legal changes, and environmental risks are shaping Micro Electronics' strategic path in our concise PESTLE snapshot. This analysis highlights actionable threats and opportunities to inform investment and competitive decisions. Purchase the full PESTLE report for detailed insights, data-driven scenarios, and ready-to-use recommendations.
Political factors
Trade policy and tariffs on electronics
Import duties under US Section 301—with rates on many Chinese electronics items up to 25%—directly raise landed costs and compress pricing flexibility for micro‑electronics suppliers. Rapid shifts in U.S.–China relations can force quick sourcing changes, squeezing margins as lead times and freight rates move. Active vendor diversification into Taiwan, Vietnam and Korea has become common to reduce exposure to tariff shocks.
State and local tax incentives for retail
Store expansion often leverages local incentives, zoning approvals and sales tax holidays—about two dozen states ran sales tax holidays in recent years—lowering opening costs and accelerating ROI. Policy variability across states drives where Micro Electronics locates stores and times promotions to coincide with tax holidays. Coordinating with municipalities for TIFs or grants (commonly $500K–$5M for retail projects) boosts traffic and community ties.
Infrastructure and broadband initiatives
Public investment such as the US BEAD program’s $42.45 billion and the EU Digital Decade push for gigabit-ready households by 2025 strengthen e-commerce reliability by funding backbone and logistics upgrades. Improved last‑mile networks cut delivery exceptions and raise customer satisfaction, expanding repeat purchase rates. Policy-driven upgrades can bring a larger share of the ~5.3 billion global internet users online-ready, enlarging addressable online demand.
Government procurement and STEM programs
Government procurement and STEM program investment, exemplified by the CHIPS and Science Act allocating 52 billion dollars for semiconductors, drives demand for PCs and components and increases institutional orders. Participation on approved vendor lists and procurement schedules unlocks bulk sales to federal and educational buyers. Aligning assortments to curriculum standards raises adoption rates among school districts and public labs.
- CHIPS Act 52B boosts component demand
- Approved vendor programs enable bulk contracts
- Curriculum-aligned assortments improve institutional uptake
E-waste and sustainability mandates
Producer responsibility laws force take‑back programs and reverse logistics, reshaping capex and OPEX; global e‑waste reached 60.1 Mt in 2023 and EU EPR fees rose ~20% in 2024, raising compliance costs. Political momentum for circular economy policies increases regulatory burden. Proactive recycling offerings can convert mandates into customer value and new revenue streams.
- Producer responsibility: mandates reverse logistics
- Scale: 60.1 Mt e‑waste (2023)
- Cost impact: EU EPR fees +20% (2024)
- Opportunity: recycling as customer value
Tariffs, CHIPS/BEAD funding and tighter e‑waste rules squeeze costs and spur recycling
Tariffs (Section 301 up to 25%) and US–China tensions raise landed costs and force rapid sourcing shifts, squeezing margins. Incentives, zoning and tax holidays shape store expansion and ROI timing. Public programs (CHIPS $52B; BEAD $42.45B) boost institutional and online demand while e‑waste rules (60.1 Mt 2023; EU EPR +20% 2024) raise reverse‑logistics costs and create recycling opportunities.
| Item | Key figure |
|---|---|
| Section 301 tariffs | up to 25% |
| CHIPS Act | $52B |
| BEAD program | $42.45B |
| Global e‑waste 2023 | 60.1 Mt |
| EU EPR fees 2024 | +20% |
What is included in the product
Detailed Word Document
Explores how Political, Economic, Social, Technological, Environmental and Legal forces uniquely shape Micro Electronics, with data-backed trends and region-specific market and regulatory context. Designed for executives and investors, it highlights threats, opportunities and forward-looking scenarios to inform strategy and funding decisions.
Customizable Excel Spreadsheet
A concise, visually segmented PESTLE snapshot for Micro Electronics that relieves time-consuming external-risk research, simplifies market-positioning discussions, and is ready to drop into presentations or share across teams for quick alignment.
Economic factors
Consumer spending and discretionary cycles
PC and gaming purchases track income, consumer confidence (~100 on the Conference Board index in 2024) and employment (US unemployment ~4% in 2024), making demand cyclical. During downturns buyers shift to value tiers and refurbished units, with refurb sales and entry laptops gaining share. In upswings premium GPUs, high-end CPUs and peripherals outpace growth as gamers trade up.
Inflation and cost pass-through
Input inflation in semiconductors and freight pressures are shaping pricing strategies, with the global semiconductor market near $600B in 2024 and container freight rates roughly 70% below 2021 peaks but still volatile.
Selective pass‑through risks demand elasticity and competitive share loss—consumer studies indicate 30–40% may switch brands after price hikes in electronics categories.
Private‑label and bundle tactics have defended margins, with many retailers gaining 1–3 percentage points of private‑label share in 2023–24.
Supply chain volatility in semiconductors
Chip shortages or gluts swing availability, lead times and ASPs; lead times peaked near 26 weeks in 2021 and eased to roughly 12 weeks by 2024. Agile allocation and multi-sourcing reduce hot‑SKU stockouts and dampen ASP volatility across product tiers. Real‑time demand sensing has lifted inventory turns by up to 15%, improving cash flow and working capital efficiency.
Interest rates and financing options
Higher policy rates (US fed funds ~5.25–5.50% mid‑2025) dampen big‑ticket PC and server refreshes and reduce captive financing uptake; borrowing costs are ~300 bps higher than 2021, raising inventory carrying costs and working capital pressure for microelectronics distributors.
- Promotional APRs/0% and BNPL (adoption ~11% of US e‑commerce 2024) sustain conversion on high‑end builds
- Inventory carrying cost rise ≈2–3% pts vs 2021
Currency movements impacting vendor pricing
FX shifts (major pairs saw >5% swings in 2024) directly alter OEM wholesale prices and force promo-calendar adjustments; suppliers hedging often lags by 1–3 months, creating short-term price mismatches. Fast repricing combined with transparent messaging preserves channel trust and reduces inventory markdown risk.
- FX swings >5% (2024)
- Hedging lag 1–3 months
- Prioritize fast repricing + clear communication
Tariffs, CHIPS/BEAD funding and tighter e‑waste rules squeeze costs and spur recycling
Demand is cyclical—consumer confidence ~100 (2024) and US unemployment ~4% drive shifts to value/refurb in downturns and premium upgrades in upswings. Input inflation, freight and FX (>5% swings in 2024) pressure ASPs. Fed funds ~5.25–5.50% (mid‑2025) raises carrying costs and curbs refreshes.
| Metric | 2024/2025 |
|---|---|
| Semiconductor market | $600B |
| Consumer confidence | ~100 |
| Fed funds | 5.25–5.50% |
Full Version Awaits
Micro Electronics PESTLE Analysis
The preview shown here is the exact Micro Electronics PESTLE Analysis you’ll receive after purchase—fully formatted and ready to use. It includes the complete political, economic, social, technological, legal, and environmental assessments as displayed, with no placeholders or edits required. After payment you’ll instantly download this same professional, final document.











